HAL Id: hal-00302038
https://hal.archives-ouvertes.fr/hal-00302038
Submitted on 2 Aug 2006HAL is a multi-disciplinary open access
archive for the deposit and dissemination of sci-entific research documents, whether they are pub-lished or not. The documents may come from teaching and research institutions in France or abroad, or from public or private research centers.
L’archive ouverte pluridisciplinaire HAL, est destinée au dépôt et à la diffusion de documents scientifiques de niveau recherche, publiés ou non, émanant des établissements d’enseignement et de recherche français ou étrangers, des laboratoires publics ou privés.
Seasonal dependence of peroxy radical concentrations at
a northern hemisphere marine boundary layer site
during summer and winter: evidence for photochemical
activity in winter
Z. L. Fleming, P. S. Monks, A. R. Rickard, B. J. Bandy, N. Brough, T. J.
Green, C. E. Reeves, S. A. Penkett
To cite this version:
Z. L. Fleming, P. S. Monks, A. R. Rickard, B. J. Bandy, N. Brough, et al.. Seasonal dependence of peroxy radical concentrations at a northern hemisphere marine boundary layer site during sum-mer and winter: evidence for photochemical activity in winter. Atmospheric Chemistry and Physics Discussions, European Geosciences Union, 2006, 6 (4), pp.7235-7284. �hal-00302038�
ACPD
6, 7235–7284, 2006 Seasonal dependence of peroxy radicals Z. L. Fleming et al. Title Page Abstract Introduction Conclusions References Tables Figures J I J I Back CloseFull Screen / Esc
Printer-friendly Version
Interactive Discussion
EGU
Atmos. Chem. Phys. Discuss., 6, 7235–7284, 2006 www.atmos-chem-phys-discuss.net/6/7235/2006/ © Author(s) 2006. This work is licensed
under a Creative Commons License.
Atmospheric Chemistry and Physics Discussions
Seasonal dependence of peroxy radical
concentrations at a northern hemisphere
marine boundary layer site during
summer and winter: evidence for
photochemical activity in winter
Z. L. Fleming1, P. S. Monks1, A. R. Rickard1,*, B. J. Bandy2, N. Brough2, T. J. Green2, C. E. Reeves2, and S. A. Penkett2
1
Department of Chemistry, University of Leicester, Leicester, UK
2
School of Environmental Sciences, University of East Anglia, Norwich, UK
*
now at: Department of Chemistry, University of Leeds, Leeds, UK
Received: 13 June 2006 – Accepted: 18 July 2006 – Published: 2 August 2006 Correspondence to: Paul S. Monks (psm7@le.ac.uk)
ACPD
6, 7235–7284, 2006 Seasonal dependence of peroxy radicals Z. L. Fleming et al. Title Page Abstract Introduction Conclusions References Tables Figures J I J I Back CloseFull Screen / Esc
Printer-friendly Version
Interactive Discussion
EGU
Abstract
Peroxy radicals (HO2+ΣRO2) were measured at the Weybourne Atmospheric Observa-tory (52◦N, 1◦E), Norfolk using a PEroxy Radical Chemical Amplifier (PERCA) during the winter and summer of 2002. The peroxy radical diurnal cycles showed a marked difference between the winter and summer campaigns with maximum concentrations
5
of 12 pptv at midday in the summer and maximum concentrations as high as 30 pptv (10 min averages) in winter at night. The corresponding nighttime peroxy radical con-centrations were not as high in summer (3 pptv). The peroxy radical concentration shows a distinct anti-correlation with increasing NOxduring the daylight hours. At night, peroxy radicals increase with increasing NOx indicative of the role of NO3 chemistry.
10
The average diurnal cycles for net ozone production, N(O3) show a large variability in ozone production, P(O3), and a large ozone loss, L(O3) in summer relative to winter. For a daylight average, net ozone production in summer than winter (1.51±0.5 ppbv h−1 and 1.11±0.47 ppbv h−1respectively) but summer shows more variability of (meteoro-logical) conditions than winter. The variability in NO concentration has a much larger
15
effect on N(O3) than the peroxy radical concentrations. Photostationary state (PSS) calculations show an NO2lifetime of 5 min in summer and 21 min in the winter, imply-ing that steady-state NO-NO2ratios are not always attained during the winter months. The results show an active peroxy radical chemistry at night and the ability of winter to make oxidant. The net effect of this with respect to production of ozone in winter is
20
unclear owing to the breakdown in the photostationary state.
1 Introduction
Peroxy radicals (HO2and the sum of the organic peroxy radicals, RO2(predominantly CH3O2in semi-polluted atmospheres)) represent key short-lived intermediates in atmo-spheric oxidation cycles. They can be thought of as being the intermediates between the OH radical and ozone formation or destruction (Atkinson, 2000; Heard and Pilling,
ACPD
6, 7235–7284, 2006 Seasonal dependence of peroxy radicals Z. L. Fleming et al. Title Page Abstract Introduction Conclusions References Tables Figures J I J I Back CloseFull Screen / Esc
Printer-friendly Version
Interactive Discussion
EGU
2003; Monks, 2003; 2005). Peroxy radicals are formed as the hydroxyl radical (OH) reacts with VOCs and CO viz
O3+ hν (λ < 320 nm) → O2+ O(1D) (R1)
O(1D)+ H2O → 2 OH (R2)
CH4+ OH → CH3+ H2O (R3)
CH3+ O2+ M → CH3O2+ M (R4)
The relative importance of ozone production and loss processes in the background troposphere is highly sensitive to competition between the reaction of peroxy radicals with NO and the peroxy self- and cross-reactions which act to terminate the radical chemistry. In the presence of NOx (NO and NO2), the reaction of peroxy radicals with NO, if the concentration is above a critical level (Monks, 2005), forms NO2, the subsequent photolysis of which leads to ozone production:
HO2+ NO → OH + NO2 (R5)
RO2+ NO → RO + NO2 (R6)
RO+ O2→ HO2+ carbonyl (R7)
NO2+ hν (λ < 424 nm) → O(3P)+ NO (R8)
O(3P)+ O2+ M → O3+ M (R9)
In conditions of low NOx, a corresponding cycle leads to net ozone destruction
HO2+ O3→ OH+ 2O2 (R10)
OH+ CO → H + CO2 (R11)
H+ O2+ M → HO2+ M (R12)
Overall : CO+ O3→ CO2+ O2 (R13)
The photochemical control of O3 has been linked with the relevant transport terms to explain the characteristic annual ozone cycle which shows a broad maximum in
ACPD
6, 7235–7284, 2006 Seasonal dependence of peroxy radicals Z. L. Fleming et al. Title Page Abstract Introduction Conclusions References Tables Figures J I J I Back CloseFull Screen / Esc
Printer-friendly Version
Interactive Discussion
EGU
spring and a minimum in the summer months at Northern Hemisphere mid-latitude sites (Derwent et al., 1998; Monks, 2000; Monks et al., 2000; Br ¨onnimann, 1999).
With respect to season, it has been shown that less NOx is required in winter than summer for net photochemical ozone production to occur owing to the higher water vapour concentrations and photolysis rates in summer leading to greater
photochem-5
ical loss term for ozone (Klonecki and Levy, 1997; Yienger et al., 1999, Salisbury et al., 2002; Zanis et al., 2003; Reeves et al, 2003; and Stroud et al., 2004). However, few measurement campaigns have been carried out in the winter months (Penkett et al., 1999; Monks et al., 2000; Heard et al., 2004), when the sun’s intensity is reduced dramatically at mid-latitudes.
10
Without perturbation from peroxy radicals, photodissociation of NO2to NO in Eq. (8) and subsequent regeneration of NO2 via reaction of NO with O3 is sufficiently fast in moderately polluted air masses that these species are in a dynamic equilibrium NO2+ hν (λ < 424 nm) → O(3P)+ NO
O(3P)+ O2+ M → O3+ M
NO+ O3→ NO2+ 2O2 (R14)
A photochemical steady state, PSS (Leighton, 1961) exists provided the NO-NO2-O3 system is isolated from local sources of NOx and sunlight is constant. In a low NOx environment, peroxy radicals perturb the NO2/NO ratio from its PSS value. Yang et al. (2004) looked at the NO-NO2-O3 photostationary state correlations of peroxy radi-cals with ozone and j (NO2) using the deviation from the photostationary state as
de-15
rived by Ridley et al. (1992). Under sunlit conditions, NO and NO2undergo fast inter-conversion through the reaction of peroxy radicals (6) or ozone (14) with NO and from NO2photolysis (8). Therefore the NO to NO2ratio is dependent on the reaction of NO with O3and on j (NO2). In remote regions increased peroxy radical concentrations and their reactions with NO become more competitive with Reaction (14) (Volz-Thomas et
20
al., 2003).
Previous research at Weybourne Atmospheric Observatory (WAO), the field site for 7238
ACPD
6, 7235–7284, 2006 Seasonal dependence of peroxy radicals Z. L. Fleming et al. Title Page Abstract Introduction Conclusions References Tables Figures J I J I Back CloseFull Screen / Esc
Printer-friendly Version
Interactive Discussion
EGU
the present study, includes the TIGER (Terrestrial Initiative in Global Environmental Research) program campaigns in April 1994 (WAOSE ’94), October/November 1994 (WAOWE ’94) and May/June 1995 (WAOSE ’95). One of the objectives of these studies was to study peroxy radicals formed at night via NO3 radical chemistry (Carslaw et al., 1997) and their role in the in situ photochemical production of ozone (Penkett et
5
al. (1999).
The WAOWE ’94 campaign had long periods when the air masses originated from Europe and travelled to Weybourne, passing over London. There were also periods when clean maritime Atlantic air arrived at the site. The NOx levels were up to 50 or 60 ppbv on the polluted days and <5 ppbv when clean maritime air predominated.
Per-10
oxy radical levels reached were 2–4 pptv at night and dropped to zero between dawn and dusk (These values are uncorrected for water dependency (see experimental); Carpenter et al. (1998) and Clemitshaw et al. (1997)). The high variability of ozone at this time, meant that the background variability in the peroxy radical data was so great that a large proportion of the data had to be discarded.
15
During the WAOSE ’95 campaign the site mainly received air masses from the Arctic and the tropics, that had very low ozone levels. A few days received polluted air that had travelled over polluted locations in Britain or even Holland. The summer measurements yielded higher peroxy radical concentrations during the day, up to 13 pptv, and night-time levels as high as 9 pptv on occasion (These values are uncorrected for water
20
dependency (see experimental); Carpenter et al. (1998) and Clemitshaw et al. (1997)). Daytime concentrations were generally 2 to 3 times greater than night-time values. However, some nights had concentrations as high or even higher than during the day and signalled a major night-time peroxy radical forming mechanism.
Penkett et al. (1999) reported that NO concentrations were higher, peroxy radicals
25
lower and ozone was more variable in winter than in summer. A correlation of peroxy radicals with ozone and PAN was noted on a few days, and this provided evidence of peroxy radicals being key intermediates in photochemical ozone production and the formation of PAN. The presence of a double peak in the peroxy radical diurnal cycle,
ACPD
6, 7235–7284, 2006 Seasonal dependence of peroxy radicals Z. L. Fleming et al. Title Page Abstract Introduction Conclusions References Tables Figures J I J I Back CloseFull Screen / Esc
Printer-friendly Version
Interactive Discussion
EGU
due to HO2production from OH radical chemistry, was noted during the day, producing a maximum at solar noon and then a second peak due to a production mechanism in the early evening.
Allan et al. (1999) found that the NO3 radical chemistry occurring at night led to peroxy radical formation, and Carslaw et al. (1997) observed a positive correlation
5
between NO3and peroxy radicals measured at night.
In this paper, we report on HO2+ΣRO2measurements using a state of the art dual-channel chemical amplification technique (PERCA) combined with measurements of NOx, CO, CH4, O3, condensation nuclei (CN) counts, photolysis frequencies and me-teorological parameters for two campaigns at the same site (Weybourne, north Norfolk)
10
during both winter and summer. A comparison of a variety of chemical and physical pa-rameters has been made, especially with respect to peroxy radicals to see how the two seasons can dictate the form of the radical diurnal cycle, the radical formation pathway and the absolute concentrations measured. The ability to make ozone with season is explored.
15
2 Experimental
2.1 Site
The Weybourne Atmospheric Observatory (Clemitshaw and Penkett, 1994; Penkett et al., 1999) is situated on the north Norfolk coast of England (52◦5702300N, 1◦704000E) at an altitude of 16 m above sea level. Set up in 1992, the observatory is located in
20
a converted World War II Gunnery Blockhouse, containing an instrument room hous-ing a variety of continuously runnhous-ing instruments for measurhous-ing trace gases, and a meteorological station. A ten-metre scaffolding tower fixed to the seaward side of the observatory is used for the trace gas sampling inlets.
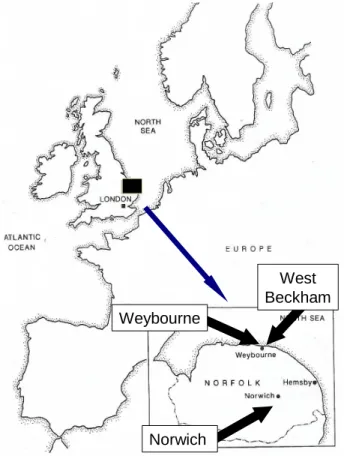
The WAO has an open seaward fetch of 30 degrees bounded by the coasts of
Eng-25
land and Scotland and the west coast of Norway, with a clear view across the North 7240
ACPD
6, 7235–7284, 2006 Seasonal dependence of peroxy radicals Z. L. Fleming et al. Title Page Abstract Introduction Conclusions References Tables Figures J I J I Back CloseFull Screen / Esc
Printer-friendly Version
Interactive Discussion
EGU
Sea to the Arctic Ocean and Bering Sea beyond (see Fig. 1). The air encountered at this site is normally clean in spring and summer but less so in winter. Air masses also travel from European southerly latitudes and pollution can be carried here from nearby cities in Britain (with Norwich 49 km and London 193 km away).
The county of Norfolk consists primarily of flat, arable farmland with several small
5
coniferous and deciduous forests, and the coastline is a mixture of pebble and sand beaches.
The winter campaign, termed WAOWEX (Weybourne Atmospheric Observatory Win-ter EXperiment) was a small-scale campaign (from 27 January to the 8 February 2002) using exclusively instruments from the University of Leicester and the University of East
10
Anglia (UEA). All instruments were controlled within the main laboratory and the inlets were all placed on the permanent 10-m tower. The spectral radiometer was situated at ground level on the grass towards the seaward side of the laboratory, out of any shading from the building.
The summer campaign was held from the 15 September to 3 October 2002 as part of
15
a large European collaboration called INSPECTRO (INfluence of clouds on the SPEC-tral actinic flux in the lower TROposphere) (Monks et al., 2004) was set up to investi-gate the effect of clouds on solar flux. The PERCA, NOxy, filter radiometers, spectral radiometer and temperature and humidity probe were all set up on a temporary build-ing on the hardcore outside the main buildbuild-ing. The inlet boxes and radiometry were all
20
placed 5 m above ground level, on a tower on top of this temporary building. 2.2 Peroxy radical measurements (PERCA)
Measurements of peroxy radicals (HO2+ΣRO2) were carried out using the jointly oper-ated Leicester University – University of East Anglia (UEA) PERCA IV instrument. The PEroxy Radical Chemical Amplifier was pioneered by Cantrell et al. (1984) and
de-25
scribed by Clemitshaw et al. (1997) and more recently Monks et al. (1998), Salisbury (2001) and Green et al. (2003). The PERCA IV instrument has a dual channel inlet and detection system the principle of which was first described by Cantrell et al. (1995)
ACPD
6, 7235–7284, 2006 Seasonal dependence of peroxy radicals Z. L. Fleming et al. Title Page Abstract Introduction Conclusions References Tables Figures J I J I Back CloseFull Screen / Esc
Printer-friendly Version
Interactive Discussion
EGU
and is described in detail for this specific instrument in Green et al. (2006).
Briefly, the method relies upon the HO2and OH radical catalysed conversion of NO and CO into CO2and NO2respectively, via addition of NO and CO into the inlet region. The yield of either CO2and NO2is equal to CL * ([HO2]+[OH]), where CL is the “chain length”, the number of HO2/OH interconversion cycles that occur before radical
termi-5
nation. The ratio of [HO2]/[OH] ranges from ≈50–200 in the atmosphere and with the organic peroxy radicals converted into HO2 in the presence of NO, the PERCA tech-nique effectively measures the sum of hydrogen and organic peroxy radicals, i.e. total peroxy radicals.
The yield of NO2 (∆NO2) is measured using commercial LMA-3 detectors, where a
10
PhotoMultiplier Tube (PMT) measures the chemiluminescence of NO2 in the sample gas flow over liquid luminol. This NO2 concentration is converted into HO2+ΣRO2 using the CL. The CL was calculated on a weekly basis during the campaign, using a calibration source based upon the photolysis of CH3I at 253.7 nm to yield CH3O2 at varying concentrations (Clemitshaw et al., 1997).
15
Termination is achieved by changing the addition points of the reagent gases, so that the amplification reactions are not initiated, giving a background NO2 (caused by the reaction of background ozone with NO in the inlet) and the overall radical levels are calculated by subtracting this background from the amplification level.
In previously described systems, the amplification and termination cycles were
ap-20
plied sequentially. In this work, with a new dual inlet system there is the potential to improve the accuracy significantly over the single channel system (See Monks et al., 1998; Green et al., 2003; and Cantrell et al., 1996). The dual-inlet system comprises two distinct sampling systems, inlet reactors and detectors. The advantage of the dual inlet system is that the two systems are run out of phase in two modes with one in
am-25
plification and the other in termination mode. In the single inlet system, the inlet was constantly switched between the two phases and subtraction of one from the other had to be over an averaging time including two termination phases and one amplification as described in Green et al. (2003). Whereas switching two inlets on a minute time
ACPD
6, 7235–7284, 2006 Seasonal dependence of peroxy radicals Z. L. Fleming et al. Title Page Abstract Introduction Conclusions References Tables Figures J I J I Back CloseFull Screen / Esc
Printer-friendly Version
Interactive Discussion
EGU
scale leads to continuous peroxy radical signal due to amplification alone. Essentially there is continuous 1 Hz data on both phases, combined together to give 1 Hz final data. For long-scale campaign data these were averaged up to minute data. Analysis was carried out with 10 min or hourly averaged data.
Mihele et al. (1998, 1999) have shown that the chain length of a chemical amplifier is
5
reduced in the presence of atmospheric water vapour. Salisbury et al. (2002) showed that the chain length of the Leicester-UEA PERCA II instrument falls approximately linearly with increasing specific humidity (Q) and from a series of laboratory experi-ments, a humidity correction factor (CF) equation (using ambient humidity and the inlet temperature) was derived to multiply all PERCA data by:
10
CF = 100/((0.17 ∗ Tinlet− 57.08) ∗ Q+ 99.96) (1)
where the inlet temperature, Tinlet was kept close to 30◦C and the specific humidity (g/kg) was calculated from ambient relative humidity measurements.
Figure 2 shows the form of the water correction factor as applied to the measured peroxy radical data. The correction factor increases as the humidity increases and as
15
the temperature of the inlet system decreases. The inlets were operates at a tempera-ture of 30◦C as to minimise the magnitude of the applied correction factor.
The uncertainty in the PERCA measurements leads to a calculated accuracy of about 42%. The sources of error and estimated magnitude of error are as follows: Radical calibration (j (CH3I) measurement (15%), mass flow controller calibration (zero
20
air and CH3I) (5%), CH3I permeation tube leak (5%), volume of photolysis cell (5%)), NO2 detection (background variability (10 %), thermal instability of luminol (20%) and the water correction factor error (20%)). This gives an uncertainty value of 18% for radical calibration and 22.4% for NO2 calibration. Therefore, the overall radical mea-surement uncertainty is 42% (see also Fleming et al., 2006).
ACPD
6, 7235–7284, 2006 Seasonal dependence of peroxy radicals Z. L. Fleming et al. Title Page Abstract Introduction Conclusions References Tables Figures J I J I Back CloseFull Screen / Esc
Printer-friendly Version
Interactive Discussion
EGU
2.3 Supporting measurements
Ozone (O3) measurements were carried out with a Thermo Environment model 49 O3 analyser (which utilises ultra-violet photometry at λ=253.7 nm) with a detection limit of ca. 1 ppbv. Carbon monoxide (CO) measurements were taken using a Trace Analysis RGA-3 Reduced Gas Analyser as described by Cardenas et al. (1998). Condensation
5
nuclei (CN) counts were monitored with a TSI model 3022A counter (cut-off size 0.007 microns) and a TSI model 3010 counter (cut-off size 0.01 microns). The meteorological data was obtained by an automatic meteorological station which recorded ambient air temperature, relative humidity, wind speed, wind direction, direct and diffuse solar irra-diance. Relative humidity and temperature were recorded using a MP103A (Campbell
10
Scientific Ltd.) attached to the inlet scaffold during the summer campaign and at the meteorological station approximately 10 m away at a height of 2 m.
2.4 NOx/NOy
The UEA NOx and NOy (NOxy) instrument was deployed for continuous NOx (NO + NO2) and NOy (Total oxidised Nitrogen: NOx+NOz, where NOz is
15
PAN+HNO3+RNO3+N2O5+NO3) measurements. This used a chemiluminescence technique, where the light was measured by a cooled, red-sensitive photomultiplier tube as described in Brough et al. (2003). The sampled air was mixed with humidified ozone in the reaction vessel and calibration was carried out using a standard concen-tration of NO in N2. The detection limit (2σ) for the NO measurements was calculated
20
to be 1–2 pptv on a one minute average with an estimated accuracy of ±8% at the 50 pptv level.
2.5 Photolysis rate coefficients
Two j (O1D) (the photolysis rate coefficient for the photolysis of O3 (Reaction 1)) and one j (NO2) fixed bandwidth filter radiometers(FR) were used to determine specific
25
ACPD
6, 7235–7284, 2006 Seasonal dependence of peroxy radicals Z. L. Fleming et al. Title Page Abstract Introduction Conclusions References Tables Figures J I J I Back CloseFull Screen / Esc
Printer-friendly Version
Interactive Discussion
EGU
photolysis rate coefficients (Shetter et al., 2003; Hofzumahaus et al., 2004). A single-monochromator diode array Spectral Radiometer (SR) was used to measure atmo-spheric actinic flux (Edwards and Monks, 2003; Monks et al., 2004; and Seroji et al., 2004). Combining the measured actinic flux with the relevant molecular parameters yields a variety of molecular photolysis frequencies including j (O1D), j (NO2), j (HONO)
5
and j (HCHO).
Outputs from the filter radiometers and spectral radiometer were obtained every sec-ond and averaged into minute time series. j (O1D) uncertainties from the SR data were are 13% and for j (NO2) 14% (Edwards and Monks, 2003). j (O1D) photolysis fre-quencies were taken from the spectral radiometer whenever possible, but the good
10
comparison between this and the FRs allowed for rare gaps in the SR data to be fitted.
3 Results and discussion
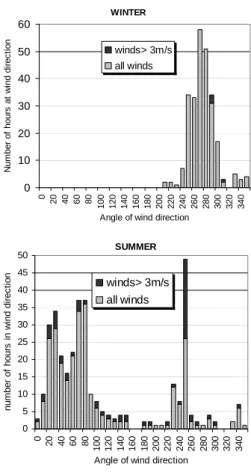
3.1 Meteorological conditions
The meteorological data comprises the relative humidity and temperature data and the Weybourne meteorological station’s wind speed and wind direction data. These
15
were averaged into hourly data and assigned a predominant wind direction. Five-day back trajectories were also obtained from the British Atmospheric Data Centre (http://badc.nerc.ac.uk). The ECMWF back trajectories were calculated for every 6 h arriving at 950 hPa in a 50 km cluster around WAO.
Figure 3 shows histograms of all the hourly wind directions reaching Weybourne
20
during the winter and summer campaigns. During the summer campaign, the majority of air masses were from a north-easterly (NE) direction (between 20 and 80◦) with another strong section from a south-westerly (SW) direction (between 230 and 250◦). A value of 3 ms−1 was used as the cut-off wind speed, below which there is stagnant circulation. Therefore, winds <3 ms−1 were not included in the analysis. During the
25
ACPD
6, 7235–7284, 2006 Seasonal dependence of peroxy radicals Z. L. Fleming et al. Title Page Abstract Introduction Conclusions References Tables Figures J I J I Back CloseFull Screen / Esc
Printer-friendly Version
Interactive Discussion
EGU
(W/SW) direction, with 85% of all hourly wind directions between 240 and 300◦. Air mass divisions for the prevailing summer conditions were made by a comparison of the back trajectories and measured wind directions throughout the campaign, result-ing into a division of four sectors. The four wind sectors that represent air of varyresult-ing composition and origin used for the summer are detailed in Table 1, and typical back
5
trajectories are shown in Fig. 4. These were: northerly (N) marine air (17–22 (morn-ing) September), easterly (E) air masses from over Scandinavia and the Baltic Sea (22 (afternoon)–24 September), westerly (NW) continental air from over north-ern Britain (25–28 (midday) September) and south-westerly (SW) that arose when northerly trajectories turned northwards a few hours before reaching Weybourne and
10
passed over northern Europe and southern England (28–29 September). The SW sec-tor (especially for the last few hours of the trajecsec-tory) can be compared to the winter data, where all the air masses passed over southern England before reaching Wey-bourne.
The winter data was not divided according to wind direction or trajectories because
15
of its relatively invariant air mass origin. The typical origin of the winter air masses are shown in Fig. 4. These mainly originate in the Atlantic Ocean or from Canada and travelled up to Weybourne through southwest Britain (Cornwall or South Wales) or through Ireland and the Midlands. Some air from a southerly origin also past over the Portuguese coast and over part of Western Europe before reaching the south of
20
England.
3.2 Winter and summer campaign chemical conditions
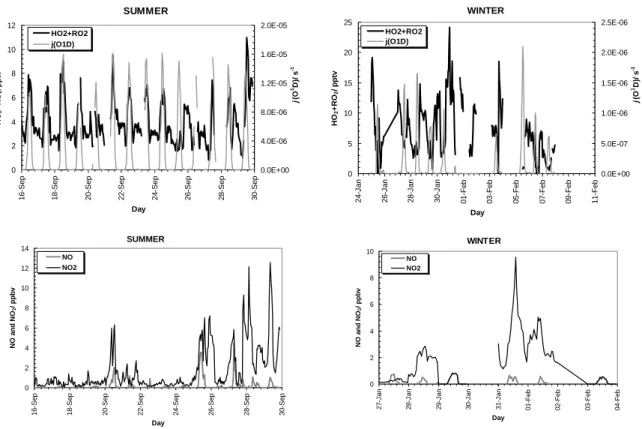
The summer and winter campaign profiles of peroxy radicals, j (O1D) and NOx are shown in Fig. 5. Unfortunately, gaps in NOxy data mean that the analysis was carried out only on those days that had NOxydata. There is more peroxy radical variation within
25
each day in winter than there is in summer, as well as more day-to-day variation. Peroxy radical concentrations show a larger range in winter and reached peak concentrations of over 25 pptv, compared to the lower summer peak concentrations of just over 10 pptv.
ACPD
6, 7235–7284, 2006 Seasonal dependence of peroxy radicals Z. L. Fleming et al. Title Page Abstract Introduction Conclusions References Tables Figures J I J I Back CloseFull Screen / Esc
Printer-friendly Version
Interactive Discussion
EGU
Table 1 shows the average ozone, relative humidity (RH), temperature, NO, NO2, NOx and HO2+ΣRO2values for the four air-mass divisions of the summer and all the winter data. The average peroxy radical concentration in winter (7.6 pptv) is approx-imately double that of each sector in summer (3.2 to 4.0 pptv). The high standard deviation in winter reflects the large peroxy radical variability. The winter conditions
5
display greater diurnal variability than in summer, with low levels during the day and elevated night-time levels.
In summer, the N and E sectors have higher ozone concentrations (>40 ppbv) and lower NOx (<1 ppbv) concentrations than the other summer sectors and the winter data. It can be assumed that these sectors represent cleaner air masses and as
10
such have slightly higher peroxy radical concentrations. The winter average NOx of 1.72 ppbv is more polluted than both the summer clean sectors (with 0.35 and 0.82 ppbv average), but in winter, on average, the peroxy radical concentration is much higher. The summer continental NW and S sectors have average NOx concentrations
>2 ppbv, but this does not significantly reduce peroxy radical levels, as the elevated
15
NOxconcentrations are generally in the form of short-lived spikes. Comparing the win-ter and summer SW air masses, there is much more NOx in summer, slightly more ozone in winter, but often twice as many peroxy radicals in winter.
Table 2 shows daylight average concentrations for the many of the same parameters as Table 1 along with j (O1D) and the ozone production and destruction terms (see later
20
section). The daylight peroxy radical concentrations do not vary significantly between wind sectors in summer. It is worth noting the factor of 10 difference between summer and winter j (O1D) values. Table 3 shows the similar nighttime only concentrations. In summer, night time HO2+ΣRO2concentrations vary little from sector to sector and show less variation than the corresponding daylight concentrations. It is clear that more
25
peroxy radicals are formed at night in winter compared to summer.
These results may be compared to measurements described by Carpenter et al. (1998) from Weybourne in winter 1993 and 1994. In winter 1993, NO2 concen-trations between 2 and 33 ppbv were recorded (much larger than seen in 2002) with
ACPD
6, 7235–7284, 2006 Seasonal dependence of peroxy radicals Z. L. Fleming et al. Title Page Abstract Introduction Conclusions References Tables Figures J I J I Back CloseFull Screen / Esc
Printer-friendly Version
Interactive Discussion
EGU
the highest NO2levels present in air arriving from Europe. These high NOxair masses had very low peroxy radical concentrations. However, the winter 1994 Weybourne measurements had lower NOx concentrations than in 1993 and peroxy radical levels as high as 30 pptv. These peroxy radical concentrations have not been water corrected (see experimental) so cannot easily be quantitatively compared to the current work.
5
Penkett et al. (1999) from winter-summer 1994–1995 Weybourne measurements, reported that NO concentrations were higher, peroxy radicals lower and ozone was more variable in winter than in summer. From the measurements taken in 1994–1995 (where again no humidity correction was taken into account), the peroxy radicals in winter were only clearly positive at night but variations of O3and PAN would suggest
10
that peroxy radicals were indeed present at all times of the day but below the detection limit of the earlier instrument. In the present work, NOx concentrations were usually lower than in winter than summer.
3.3 Diurnal variations of peroxy radicals
Figure 6 shows the hourly averaged peroxy radical diurnal cycle for the winter and
15
summer data. It demonstrates the contrasting shape of the diurnal peroxy radical cycle (winter vs. summer) and the differing hourly average values.
Hourly averaged campaign diurnal cycles for winter and summer of peroxy radicals with j (O1D), NOx and ozone with Ox (NOx+O3) are shown in Fig. 7, with the corre-sponding standard deviations. NOx has a much more structured average diurnal cycle
20
in winter, with maximum concentrations at midday. Ozone and Ox are much more structured in summer, with a maximum in the afternoon.
In summer, the hourly-averaged diurnal cycle maximum HO2+ΣRO2 concentration (at midday) was only 6 pptv. The maximum hourly concentration of 12 pptv was around midday and the night-time maximum (at 19:00) was 8 pptv. The variation in peroxy
25
radical levels between all the days was much lower at night, particularly after 10:00 p.m. The concentrations of NOxtended to be higher in the earlier part of the day, whereas ozone concentrations peaked towards the late afternoon, as expected in summer.
ACPD
6, 7235–7284, 2006 Seasonal dependence of peroxy radicals Z. L. Fleming et al. Title Page Abstract Introduction Conclusions References Tables Figures J I J I Back CloseFull Screen / Esc
Printer-friendly Version
Interactive Discussion
EGU
A peroxy radical afternoon shoulder on the diurnal cycle has been noted at many locations including at Weybourne in summer 1995 by Penkett et al. (1999) and Clemit-shaw et al. (1997). This shoulder suggests the photolysis of a substance at a higher wavelength than ozone. This higher wavelength photolysis becomes the predominant peroxy radical formation mechanism in the late afternoon. Yang et al. (2002) noted
5
significant afternoon peroxy radical formation from formaldehyde photolysis in Sum-mit, Greenland. Solberg et al. (2001) found that formaldehyde concentrations at Mace Head, Ireland and at two stations in Germany and Norway were highest in the summer and that the amount of formaldehyde photolysed was also higher in the summer. Both Burkert et al. (2003), during the INDOEX (INDian Ocean EXperiment) and Hern ´andez
10
et al. (2001), during the AEROSOLS99 campaign in the Atlantic ocean found the broad RO2diurnal cycle to coincide with increased amounts of formaldehyde.
A characteristic dip in summer peroxy radical levels between daytime and nighttime (at 06:00 and again at 17:00) is observed. NO3 is photolysed in the red region of the spectrum, so photolysis is still high in the early morning and late afternoon when
15
j (O1D) is at zero and NO3chemistry is not yet occurring. At this time photochemical OH production ceases and radical levels tend to drop (more dramatically in the early morning than the evening).
The shape of the winter peroxy radical diurnal cycle strongly contrasts to that seen in summer. The maximum hourly averaged peroxy radical concentration in winter was
20
10 pptv (during the night) and the concentrations during daylight hours were much lower (between 3 and 5 pptv), though individual night-time hourly concentrations reached as high as 25 pptv (twice as high as the maximum hourly concentration in summer) on the 30 January.
The winter peroxy radical diurnal cycle in Fig. 6, with very low daytime concentrations
25
and little daytime structure, does not reflect the recent findings of Heard et al. (2004) for HO2 in the urban highly polluted winter atmosphere. Here ozone-alkenes and the photolysis of carbonyls where implicated in the initiation and propagation of significant daytime OH and HO2levels in winter.
ACPD
6, 7235–7284, 2006 Seasonal dependence of peroxy radicals Z. L. Fleming et al. Title Page Abstract Introduction Conclusions References Tables Figures J I J I Back CloseFull Screen / Esc
Printer-friendly Version
Interactive Discussion
EGU
There was no obvious shape to the winter ozone diurnal cycle in Fig. 7 and the standard deviation between the days was up to 6 ppbv. Ozone concentrations were lower in winter with averages varying between 30–34 ppbv (37–44 ppbv in summer). 3.4 Peroxy radical and NOxrelationships
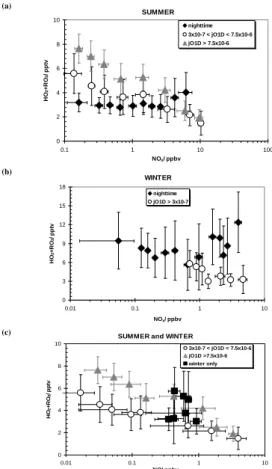
Figure 8 shows the peroxy radical dependence on NOxconcentrations for the summer
5
and winter. Summer data was sorted according to three differing levels of j(O1D) These were strong sunlight: j (O1D)>7.5×10⁻⁶, low solar intensity (mostly mornings and evenings): 3×10⁻⁷>j (O1D)>7.5×10⁻⁶ and night-time: j (O1D)<3×10⁻⁷). Winter data was simply divided into day and night, with j (O1D)<3×10⁻⁷ as the cut-off value (all values of j (O1D) have units of s−1).
10
In summer daylight hours (Fig. 8a), as NOx increases, peroxy radical concentration decreases. At NOx concentrations from ca. 1–1.2 ppbv, the decreasing radical levels expected, as NOx increases, are no longer observed, hinting that the air mass type has moved from the NOx-limited regime to the VOC-sensitive regime (Sillman and He, 2002). Above NOx values of 1.2 ppbv the radicals continue to decrease.
15
The winter HO2+ΣRO2 data (Fig. 8b) for daylight hours have corresponding [NOx]>0.7 ppbv, and little peroxy radical variation was seen over this narrow NOxrange, except for a gradual decrease.
At night, in the summer, the peroxy radicals show little influence from NOx below 1 ppbv, but for NOx greater than 2 ppbv the peroxy radical concentrations tend to be
20
higher than the radical concentrations at lower NOxlevels. This is suggestive of peroxy radical production from NO3chemistry. For winter night-time values above 1 ppbv NOx, the peroxy radicals, as in summer, are higher than at lower NOxconcentrations.
Figure 8c is a plot of daytime peroxy radical concentrations in winter and summer against binned NO. In summer, the trend is not dissimilar to the NOx trend. However,
25
in winter, any peroxy radical-NO trend breaks down completely. This observation will be discussed later with respect to the calculated ozone production.
NO converts peroxy radicals to OH via Reactions (5–7) and at high NOx, OH reacts 7250
ACPD
6, 7235–7284, 2006 Seasonal dependence of peroxy radicals Z. L. Fleming et al. Title Page Abstract Introduction Conclusions References Tables Figures J I J I Back CloseFull Screen / Esc
Printer-friendly Version
Interactive Discussion
EGU
with NO2 to form HNO3, reducing peroxy radical regeneration via OH-oxidation of CO and hydrocarbons. The decrease in peroxy radicals at high NOx seen in both seasons was predicted by Liu et al. (1980) and Logan et al. (1981). They showed that at low to intermediate NOx levels, HO2does not change with NOx but that ROx could increase with increasing NOxbecause its precursors may correlate with NOx. This could
corre-5
spond to NOx levels where peroxy radicals show a slight increase. At high NOxlevels peroxy radicals should decrease owing to removal by radical-NOxreactions.
Carpenter et al. (1998) noted a negative correlation between PSS-derived peroxy radical concentrations and NOx at Weybourne in winter 1994. Holland et al. (2003) found at the BERLIOZ campaign, outside Berlin (Germany), that for [NOx]>1 ppbv, HO2
10
decreased as NOxincreased and that for [NOx]<1 ppbv, HO2increased with increasing NOx. During the TOPSE campaign (in N. America), Stroud et al. (2004) found that peroxy radical production appears to decrease with NOx in the winter (when radicals are lower) and increase in the spring (when peroxy radicals are higher). However, Cantrell et al. (2003) found that these high peroxy radical levels were from high
radical-15
producing reactions (mainly by photolysis) and not directly because of NOx. 3.5 Night-time chemistry
During the night, in Fig. 8, at [NOx]>1 ppbv the peroxy radical levels during both the winter and the summer are higher than at low [NOx]. This may be explained by NO3 radical reactions being one of the major formation routes for peroxy radicals (Salisbury
20
et al, 2001). The gradient of the increase in night-time peroxy radical levels from low to high NOxis greater in winter than in summer. Table 3 shows that the average night-time peroxy radical concentrations in summer do not seem to vary with NOxbelow 1 ppbv. In winter, peroxy radical concentrations are much higher and there is a greater variation during the night than the day.
25
Figure 9 shows the hourly average peroxy radical concentrations during the night in winter and summer. The highest night-time concentration in summer was at 19:00 (≈12 pptv), and throughout the night the concentrations decrease. For the last three
ACPD
6, 7235–7284, 2006 Seasonal dependence of peroxy radicals Z. L. Fleming et al. Title Page Abstract Introduction Conclusions References Tables Figures J I J I Back CloseFull Screen / Esc
Printer-friendly Version
Interactive Discussion
EGU
nights of the summer campaign (where NOxlevels were higher), this decrease is even more apparent. Peroxy radical concentrations in winter also show a decreasing trend throughout the night. The percentage decrease throughout the night is greater in the winter (50%, ca. 4 pptv) than in the summer (30%, ca. 2 pptv). This decrease in peroxy radicals throughout the night is likely due to a reduced NO3source strength as the night
5
progresses, which is consistent with lower NO3 concentrations after 22:00 (Salisbury et al., 2001).
The same form of behaviour was recently noted in the BERLIOZ campaign by Geyer et al. (2003), where the measured NO3 was shown to influence the night-time peroxy radical mixing ratios. Maximum NO3and peroxy radical concentrations were between
10
19:00 and 22:00. Both then proceeded to decrease throughout the rest of the night. Bey et al. (2001) found, in an urban model, an evening peroxy radical peak at about 19:00, whereas in a rural environment, this peak was much lower and the marked decrease in peroxy radicals into the night was no longer seen.
The night-time NOx– peroxy radical trends in Fig. 8 suggest that NO3has a stronger
15
influence on peroxy radical formation in winter than summer. This type of analysis, on hourly data rather than campaign-averaged data, shows a better NO3 correlation because it is often a sudden NOxincrease that causes a rise in peroxy radicals. Without supporting data it is difficult to confirm which other peroxy radical forming mechanisms (like ozone-alkene reactions) are important (see Salisbury et al., 2001).
20
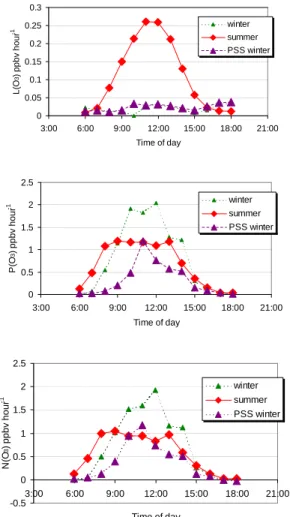
3.6 Photochemical ozone production
The ozone tendency or net photochemical in-situ production rate of ozone (N(O3)) is a measure of the ozone productivity of an air mass and neglects transport and deposition processes (see for example Monks et al., 2000). N(O3) is made up of a production term, P(O3) minus the loss term, L(O3):
25
N(O3)= kp[NO][HO2+ ΣRO2]− (2)
{f .j(O1D)+ k15[OH]+ k10[HO2]}[O3]
ACPD
6, 7235–7284, 2006 Seasonal dependence of peroxy radicals Z. L. Fleming et al. Title Page Abstract Introduction Conclusions References Tables Figures J I J I Back CloseFull Screen / Esc
Printer-friendly Version
Interactive Discussion
EGU
Where kp is a combined rate coefficient for the oxidation of NO to NO2 by all peroxy radicals and f.j (O1D)[O3] represents the fraction of ozone photolysed to yield O(1D) atoms and then OH (with f being the proportion of O(1D) atoms which react with H2O to give OH rather than being collisionally deactivated). The rate constants k15 and k10 are from the ozone loss reactions:
OH+ O3→ HO2+ O2 (R15)
HO2+ O3→ OH+ 2O2
Ozone production, destruction and net production values were calculated for each day-light hour of both campaigns and averaged. Figure 10 and Table 4 shows the net sum-mer and winter hourly averaged ozone formation, with the loss and production terms shown separately. The most obvious difference between winter and summer is the much higher ozone loss occurring in summer. In summer, the hourly ozone loss is
5
mostly lower than ozone production but on some days with low NO concentrations, and subsequently lower ozone production rates, overall ozone destruction (negative N(O3)) occurs. The averaging of all days in Fig. 10 hides these few hours of ozone destruction. In winter, L(O3) is very low (see Table 4) and N(O3) is controlled mainly by P(O3).
10
The flat shape of the N(O3) average diurnal cycle during the middle of the day (at its maximum) in summer is not a good representation of the individual day’s variability. Large variations of P(O3) from day to day in the summer are observed owing to NO variability and spikes (mainly in the morning). In Fig. 10, the only time that ozone production was higher in summer than in winter was in the early morning, owing to the
15
elevated NO experienced in summer at this time of day. The NO concentration appears to be more of a determining factor than the peroxy radical concentration on N(O3) in winter, than it does in the summer (when peroxy radical concentrations are higher).
The apparent N(O3) campaign averages are higher in summer compared to winter, but particularly at midday during the winter there appears to be a much higher potential
20
ACPD
6, 7235–7284, 2006 Seasonal dependence of peroxy radicals Z. L. Fleming et al. Title Page Abstract Introduction Conclusions References Tables Figures J I J I Back CloseFull Screen / Esc
Printer-friendly Version
Interactive Discussion
EGU
is that of a steady-state.
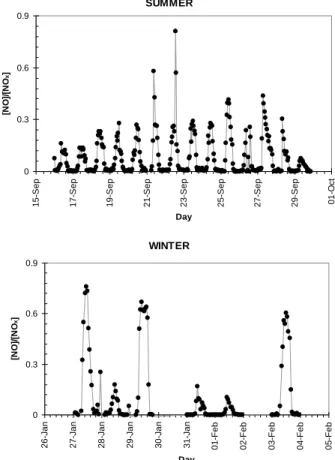
3.7 NO−NO2−O3photostationary state
Averaging ozone productivity over each campaign gives the appearance that there is a significant net ozone production in both winter and summer. The differences between the NO and NOxdependence of the peroxy radicals in Fig. 8 is suggestive of NO and
5
NO2 not being in a photostationary state (PSS) equilibrium in winter as the NO/NO2 ratio is highly variable. In-situ ozone production relies on the system being in steady state (inter alia Eq. 16).
Figure 11 shows the NO/NO2ratio in winter and summer. In winter, three days (27, 29 January and 3 February) showed NO/NOx ratios above 0.5, having NO
concentra-10
tions higher than NO2concentrations. The lower light levels of winter and other factors (e.g. emissions, PBL height) may contribute to the inability of the system to obtain photostationary equilibrium of NOx. The average [NO] in summer is 0.04 ppbv and in winter, 0.4 ppbv, while [NO2] is 0.34 ppbv in summer and 1.3 ppbv in winter. [NO] is on average ten times as high in summer as winter, and yet [NO2] is only slightly higher in
15
the summer.
The time required for photostationary state to reach equilibrium after perturbation (Yang et al., 2004) by either j (NO2) or [NO]/[NO2] is given by
τPSS= j [NO−l n0.05
2]+k14[O3] (3)
Here τPSSis defined as the time interval required for NO to complete 95% of the
read-20
justment. For winter the average value of τPSS is of the order of 225 s and 176 s in summer.
The average NO2lifetime (1/j (NO2)) between 08:00 and 16:00 was calculated to be 5 min in summer and 21 min in winter. In summer, the lifetime does not vary significantly in the daylight hours but in winter the values vary from ca. 10 min around midday to
25
ca. 40 min between 08:00 and 15:00. Thus, the ratio NO/NO2is not as stable in winter as a photostationary state takes longer to be reached. Carpenter et al. (1998) found
ACPD
6, 7235–7284, 2006 Seasonal dependence of peroxy radicals Z. L. Fleming et al. Title Page Abstract Introduction Conclusions References Tables Figures J I J I Back CloseFull Screen / Esc
Printer-friendly Version
Interactive Discussion
EGU
NO2lifetimes to be between 5 and 20 min (between 09:30 and 14:30) at Weybourne in winter 1993.
PSS deviations from NO-NO2(Ridley et al., 1992) are a method of testing whether a system is in photostationary state. Deviations from PSS can be expressed according to deviations from φ
5
φ=j (NO2)[NO2]
k14[NO][O3] (4)
During the summer, φ values were closer to 1 than in winter (daily averages between 0.86 and 1.12 for 17 to 25 September, with standard deviations of 0.08 to 0.39) but with the 16 September and the last 4 days (26 to 29 September) showing a ten-dency towards high φ ratios. These φ (± their 1σ standard deviations) were 1.43±0.6,
10
6.84±13.6, 1.20±0.3, 1.55±0.5 and 6.66±1.21 respectively.
Winter daily averaged φ values between 08:00 and 17:00 were calculated to be 1.35±0.5, 1.60±1.2, 1.04±0.1 for 28, 31 January and 1 February, and 0.06±0.01 and 0.08±0.01 for 29 January and 3 February. A value of φ equal to 1 implies a photosta-tionary state has been established, but large deviations from this (as on 29 January
15
and 3 February) imply photostationary state has not been reached. The 31 January had a value of φ>1, similar to that seen in the summer. Some care must be exercised with this analysis as demonstrated by Mannschreck et al. (2004).
Deviations of φ from 1 and NO/NO2ratios, create a clear division between the 27, 29 January and 3 February, which display non-PSS characteristics and 28 January and 1
20
February, which show good PSS behaviour. The average [NOx] for the PSS sector was 2.9 ppbv while the non-PSS sector was 0.8 ppbv. NO/NO2 ratios were 0.33±0.3 for all the winter data, 0.08±0.05 for the PSS sector and 0.50±0.2 for the non-PSS sector.
Figure 12 shows the diurnal P(O3) diurnal cycle for each winter day and with the sorted averages according to ability to obtain PSS. Owing to the small amount of data,
25
this can only illustrate that there can be large discrepancies in PSS behaviour, leading to a resultant ozone production that could be highly exaggerated. When comparing winter and summer conditions, it becomes clear that a PSS test is essential before
ACPD
6, 7235–7284, 2006 Seasonal dependence of peroxy radicals Z. L. Fleming et al. Title Page Abstract Introduction Conclusions References Tables Figures J I J I Back CloseFull Screen / Esc
Printer-friendly Version
Interactive Discussion
EGU
modelling the net ozone production.
These divisions are shown in Table 2 with a net ozone production of 1.11 ppbv h−1 for the well-equilibrated NOx environment, contrasting with 1.55 ppbv h−1 for the days where PSS is not obtained.
In agreement with a number of other campaigns (Salisbury et al, 2002; Volz-Thomas
5
et al., 2003; Yang et al., 2004) PSS calculated values of N(O3) overestimate those cal-culated using the measured radical concentrations. Volz-Thomas et al. (2003) ascribe this general failing to an unidentified process which must exist in the atmosphere that converts NO to NO2without leading to a net production of ozone.
3.8 Ozone production vs. [NOx]
10
The calculated hourly-averaged net ozone production, N(O3) for the summer and win-ter campaigns are plotted against [NO] in Fig. 13b along with air mass sector division averages. There appears to be a general increase in net ozone production as NO con-centration increases. For [NO]>2 ppbv N(O3) reaches its highest values but no longer appears to increase with increasing NO. The ozone production, P(O3) vs. NO
concen-15
tration graph in Fig. 13a appears very similar to the previous graph because high P(O3) values are hardly reduced when the L(O3) is subtracted to calculate N(O3). The lower P(O3) and N(O3) values are more different to each other as ozone loss affects N(O3) much more but due to the density of values, it is hard to see any differences between Figs. 13a and b.
20
The N(O3) hourly averages cover a range of hourly NO concentrations between 10 and 4500 pptv. The winter conditions lead only to positive N(O3) (ozone production), whereas, during the summer, the low NO concentrations on some days along with greater ozone destruction, lead to net negative ozone tendencies (for short periods).
At [NO]<0.1 pptv, P(O3) is higher in winter than in summer but at higher NO there is
25
little difference in the resulting P(O3) between the seasons. Winter data have a more scattered P(O3)-NO trend than in summer. The winter average, PSS days and non-PSS days all show a higher N(O3) than those taken in the summer air-mass-sectors of
ACPD
6, 7235–7284, 2006 Seasonal dependence of peroxy radicals Z. L. Fleming et al. Title Page Abstract Introduction Conclusions References Tables Figures J I J I Back CloseFull Screen / Esc
Printer-friendly Version
Interactive Discussion
EGU
a similar NO concentration.
Mihelcic et al. (2003), at the BERLIOZ campaign near Berlin, observed an increase in ozone production, P(O3) up until ca. 0.3 ppbv NO and then a gradual decrease with increasing NO. Similarly, measurements by the same group at Schaunisland in the Black forest, as well as measurements by Zenker et al. (1998) in Tenerife at the OCTA
5
(Oxidising Capacity of the Tropospheric Atmosphere) campaign, found an increase in ozone production up to similar NO values of 0.25 to 0.3 ppbv and a decrease at higher NO. The Weybourne 2002 data showed no such decrease in ozone production.
The average dlnP(O3)/dln[NOx] (with standard deviations in brackets) for summer and winter were 1.04 (6.70) and 2.00 (21.3). These values imply that NOx affects
10
P(O3) in an essentially linear fashion in summer, and that the same NOxleads to twice as much ozone production in winter as it would in summer (see also Fleming et al., 2006). Hourly averaged dlnL(O3)/dln[NOx] in summer and winter were 0.08 (6.38) and 1.49 (14.2). NOxhas an indirect effect on L(O3) as it affects the O3 reactions with OH and HO2 and not the photolysis term. L(O3) is much less affected by NOx in summer,
15
as photolysis is the major loss route but NOxhas a significant effect on L(O3) in winter through the reactions of ozone with OH and HO2, whose concentrations are all affected by NOx.
Many prior studies have noted an increase in net ozone formation with increasing NOx (NO+NO2), such as during the TOPSE flights over North America in the free
20
troposphere where Stroud et al. (2004) calculated dlnP(O3)/dln[NOx] to be between 0.86 and 1.02 and dlnL(O3)/dln[NOx] to be only 0.2. It should be noted, however, that the NOx concentrations were mostly between 10 and 500 pptv whereas NOx at Weybourne was generally between 500 and 6000 pptv.
Daily net ozone production values for winter and summer are shown in Fig. 14.
Dur-25
ing the summer, the daily N(O3) was always positive except on 16 September (J259), where N(O3) was negative at –0.03 ppbv h−1. The daily N(O3) ranged from –0.3 to 2.2 ppbv h−1 over the course of the day. In winter, the daily N(O3) was always posi-tive, with ozone production of 0.5, 0.6 and 1.2 ppbv h−1 for the PSS days and 1.5 to
ACPD
6, 7235–7284, 2006 Seasonal dependence of peroxy radicals Z. L. Fleming et al. Title Page Abstract Introduction Conclusions References Tables Figures J I J I Back CloseFull Screen / Esc
Printer-friendly Version
Interactive Discussion
EGU
1.8 ppbv h−1for the non-PSS days.
The NO concentration needed to produce net ozone production (known as the com-pensation point, see Monks, 2005) for Weybourne during summer was calculated to be 57 pptv [NO]. This explains why the majority of hours show positive net ozone produc-tion, since the NO concentration was usually above the 57 pptv threshold point during
5
the daylight hours There was not enough data to calculate an equivalent value for win-ter. Both Zanis et al. (2003) and Stroud et al. (2004) have noted a seasonal variation of the compensation point, typically a smaller [NO] being required in winter vs. sum-mer for net ozone production. For example, in the Arctic in the compensation point was 10 pptv in winter compared to 30 pptv in summer. (Stroud et al., 2004) leading to
10
significant net positive ozone production in winter.
4 Conclusions
A seasonal comparison of peroxy radical data obtained at the Weybourne Atmospheric Observatory on the North Norfolk coast of the UK has shown that the typical peroxy radical diurnal cycle is very different in winter and summer.
15
During the summer the maximum peroxy radical concentrations were at midday, when ozone photolysis is highest. Exceptions to this were when NOx concentrations were high and daytime peroxy radical levels were suppressed. In the winter, daylight hours saw very low peroxy radical concentrations as the solar intensity was not enough to drive substantial photochemical formation. However, during the night, large
concen-20
trations of peroxy radicals were formed in winter, making night-time levels much higher than daylight levels and even up to twice as high as the maximum summer daytime con-centrations. Night-time peroxy radical formation leads to much higher average peroxy radical concentrations in winter than summer.
The origins of the air masses reaching the site were divided into four sectors in
sum-25
mer and an overall average for winter. The summer S/SW air masses had elevated NOx concentrations but low ozone (similar to that seen in winter), which is consistent with
ACPD
6, 7235–7284, 2006 Seasonal dependence of peroxy radicals Z. L. Fleming et al. Title Page Abstract Introduction Conclusions References Tables Figures J I J I Back CloseFull Screen / Esc
Printer-friendly Version
Interactive Discussion
EGU
fresh emissions removing O3 and then the chemistry beginning to gradually re-form it. Whereas, the marine N and E air masses had low NOx and high ozone. In the winter, the air masses originated from the west and nearly all passed over southern England or the Midlands before reaching Weybourne but nevertheless, after passing over these urban areas, neither NOx or ozone was elevated. Peroxy radical concentrations were
5
relatively insensitive to air mass origin, being on average higher in the winter, because of the large night-time concentrations.
In the daytime, peroxy radicals show a distinct general trend, with increasing NOx in summer and winter, decreasing with increasing NOx. In summer, at NOx concentra-tions of just over 1 ppbv, the peroxy radical concentration appears to increase slightly
10
before continuing to decrease at higher NOx concentrations. This behaviour may indi-cate the system is no longer NOx-limited. In winter, the range of NOx is between 0.7 and 1.4 ppbv, and a decrease in peroxy radical concentrations is seen with increasing NOx.
During the night, in both winter and summer, above 1 ppbv NOx, peroxy radical
con-15
centrations increase. This has been attributed to peroxy radical formation from NO3 chemistry, with a sharper increase in peroxy radical concentrations at high NOxin win-ter. Also, the peroxy radical concentration tended to decrease throughout the night in both seasons with the maximum concentration at the start of the night.
Winter and summer average diurnal cycles of net ozone productivity show that there
20
is apparently similar ozone production in summer and winter. The magnitude is driven by two factors, the first is the larger range of air-mass variability summer vs. winter. The second is the by the substantially smaller photochemical ozone loss term in winter vs. summer coupled to the apparent ability to produce ozone in winter under low radical high [NO] conditions. Closer inspection of the winter ozone production terms suggest
25
that on many occasions photostationary state is not achieved leading to a potential to overestimate ozone production. Photostationary state calculations found the NO2 lifetimes in summer and winter to be 5 and 21 min respectively, showing the NO/NO2 ratio to be less stable in winter. Trends of net ozone production, N(O3) against NO
ACPD
6, 7235–7284, 2006 Seasonal dependence of peroxy radicals Z. L. Fleming et al. Title Page Abstract Introduction Conclusions References Tables Figures J I J I Back CloseFull Screen / Esc
Printer-friendly Version
Interactive Discussion
EGU
concentrations show that as NO increases, a similar increase in N(O3) is observed. Average dlnP(O3)/dln[NOx] for summer and winter have been determined to be 1.04 and 2.00. In general, similar [NO] concentrations lead to higher net ozone formation in winter than summer.
In summary, the data shows an active peroxy radical chemistry during the night-time
5
during the winter season than would be expected, though the concomitant daytime levels where low, they were still large enough to drive significant net ozone production. The net effect of this with respect to production of ozone in winter is unclear owing to the breakdown in the photostationary state but could lead to levels of ozone production in winter as a result of the correspondingly lower photochemical ozone destruction
10
rates. A further study with greater coverage would statistically prove the differences in ozone formation between the seasons.
Acknowledgements. We are grateful to the British Atmospheric Data Centre for providing
ac-cess to calculated trajectories using data from the European Centre for Medium Range Weather Forecasts. The authors are also grateful to G. Phillips for logistical support. The work has been
15
funded by the EU through the INSPECTRO project. CER is grateful to NERC-NCAS-DIAC for support. Weybourne Atmospheric observatory is supported in part by NERC-NCAS-UFAM.
References
Allan, B. J., Carslaw, N. Coe, H. Burgess, R. A., and Plane, J. M. C.: Observations of the nitrate radical in the marine boundary layer, J. Atmos. Chem, 33, 129–154, 1999.
20
Atkinson, R.: Atmospheric chemistry of VOCs and NOx, Atmos. Environ., 34, 2063–2101, 2000.
Bey, I., Aumont, B., and Toupance, G.: A modelling study of the nighttime radical chemistry in the lower continental troposphere 1. Development of a detailed chemical mechanism includ-ing nighttime chemistry, J. Geophys. Res., 106, 9959–9990, 2001.
25
Br ¨onnimann, S.: Early spring ozone episodes: Occurrence and case study, Phys. Chem. Earth Part C, 24, 531–536, 1999.
ACPD
6, 7235–7284, 2006 Seasonal dependence of peroxy radicals Z. L. Fleming et al. Title Page Abstract Introduction Conclusions References Tables Figures J I J I Back CloseFull Screen / Esc
Printer-friendly Version
Interactive Discussion
EGU
Brough, N., Reeves, C. E., Penkett, S. A., Stewart, D. J., Dewey, K., Kent, J., Barjat, H., Monks, P. S., Ziereis, H., Stock, P., Huntrieser, H., and Schlager, H.: Intercomparisons of aircraft instruments on board the C-130 and Falcon 20 over southern Germany during EXPORT 2000, Atmos. Chem. Phys., 5, 2127–2138, 2003.
Burkert, J., Andr ´es-Hern ´andez, M. D., Reichert, L., Meyer-Arnek, J., Doddridge, B., Dickerson,
5
R. R., M ¨uhle, J., Zahn, A., Carsey, T., and Burrows, J. P.: Trace gas and radical diurnal behaviour in the marine boundary layer during INDOEX 1999, J. Geophys. Res, 108, 8000, doi:10.1029/2002JD002790, 2003.
Cantrell, C. A., Stedman, D. H., and Wendel, G. J.: Measurement of atmospheric peroxy radi-cals by chemical amplification, Anal. Chem., 56, 1496–1502, 1984.
10
Cantrell, C. A., Shetter, R. E., and Calvert, J. G.: Dual-inlet Chemical amplifier for atmospheric peroxy radical measurements, Anal. Chem., 58, 4194–4199, 1996.
Cantrell, C. A., Edwards, G. D., Stephens, S., Mauldin, L., Kosciuch, E., Zondlo, M., and Eisele, F.: Peroxy radical observations using chemical ionisation mass spectrometrey during TOPSE, J. Geophys. Res., 108, 8371, doi:10.1029/2002JD002715, 2003.
15
Cardenas, L. M., Austin, J. F., Burgess, R. A., Clemitshaw, K. C., Dorling, S., Penkett, S. A., and Harrison, R. M.: Correlation between CO, NOy, O3and non-methane hydrocarbons and their relationships with meteorology during winter 1993 on the North Norfolk coast, UK, Atmos. Environ., 32, 3339–3351, 1998.
Cardenas, L. M., Brassington, D. J., Allan, B. J., Coe, H., Alicke, B., Platt, U., Wilson, K. M.,
20
Plane, J. M. C., and Penkett, S. A.: Intercomparison of formaldehyde measurements in clean and polluted atmospheres, J. Atmos. Chem., 37, 53–80, 2000.
Carpenter, L. J., Clemitshaw K. C., Burgess R. A., Penkett S. A., Cape J. N., and McFadyen G. C.: Investigation and evaluation of the NOx/O3photochemical steady state, Atmos. Environ., 32, 3353–3365, 1998.
25
Carslaw, N., Carpenter, L. J., Plane, J. M. C.., Allan, B. J., Burgess, R. A. Clemitshaw, K. C., Coe, H., and Penkett, S. A.: Simultaneous observations of nitrate and peroxy radicals in the marine boundary layer, 1. Model construction and comparison with field measurements, J. Geophys. Res., 102, 18 917–18 933, 1997.
Clemitshaw, K. C. and Penkett, S. A.: TOR station number 7: The Weybourne atmospheric
ob-30
servatory, in: The TOR network. A description of TOR Measurement Stations, edited by: Cvi-tas, T. and Kley, D., EUROTRAC International Scientific Secretariat Garmisch Partenkirchen, 59–63, 1994.
ACPD
6, 7235–7284, 2006 Seasonal dependence of peroxy radicals Z. L. Fleming et al. Title Page Abstract Introduction Conclusions References Tables Figures J I J I Back CloseFull Screen / Esc
Printer-friendly Version
Interactive Discussion
EGU
Clemitshaw, K. C., Carpenter, L. J., Penkett, S. A., and Jenkin, M. E.: A calibrated peroxy radical chemical amplifier (PERCA) for ground-based measurements in the troposphere, J. Geophys. Res., 102, 25 405–25 416, 1997.
Derwent, R. G., Simmonds, P. G., Seuring, S., and Dimmer, C: Observation and interpretation of the seasonal cycles in the surface concentrations of ozone and carbon monoxide at Mace
5
Head, Ireland from 1990 to 1994, Atmos. Env., 32, 145–157, 1998.
Edwards, G. D. and Monks, P. S.: Performance of a single monochromator diode array spec-trradiometer for the determination of actinic flux and atmospheric frequencies, J. Geophys. Res., 108, 8546–8558, 2003.
Fleming, Z. L., Monks, P. S., Rickard, A. R., Heard, D. E., Bloss, W. J., Seakins, P. W., Still, T. J.,
10
Sommariva, R., Pilling, M. J., Morgan, R., Green, T. J., Brough, N., Penkett, S. A., Lewis, A. C., Lee, J. D., Saiz-Lopez A., Plane, and J. M. C.: Peroxy radical chemistry and the control of ozone photochemistry at Mace Head, Ireland during the summer of 2002, Atmos. Chem. Phys., 6, 2193–2214, 2006.
Geyer, A., B ¨achmann, K., Hofzumahaus, A., Holland, F., Konrad, S., Kl ¨upfel, T., P ¨atz, H.-W.,
15
Perner, D., Mihelcic, D., Sch ¨afer, H.-J., Volz-Thomas, A., and Platt, U.: Nighttime formation of peroxy and hydroxyl radicals during the BERLIOZ campaign: Observations and modelling studies, J. Geophys. Res., 108, 8249, doi:10.1029/2001JD000656, 2003.
Green, T. J., Brough, N., Reeves, C. E., Edwards, G. D., Monks, P. S., and Penkett, S. A.: Air-borne measurements of peroxy radicals using the PERCA technique, J. Environ. Monitoring,
20
5, 75–83, 2003.
Green, T. J., Reeves, C. E., Fleming, Z., Brough, N., Rickard, A. R., Bandy, B. J., Monks, P. S., and Penkett, S. A.: An Improved Dual Channel PERCA Instrument for Atmospheric Measurements of Peroxy Radicals, J. Environ. Monitoring, 8, 530–536, 2006.
Heard, D. E. and Pilling, M. J.: The hydroxyl radical, Chem. Rev., 103, 5163–5198, 2003.
25
Heard, D. E., Carpenter, L. J., Creasey D. J., Hopkins, J. R., Lee, J. D., Lewis, A. C., Pilling, M. J., Seakins, P. W., Carslaw, N., and Emmerson, K. M.: High levels of the hydroxyl radical in the winter urban troposphere, Geophys. Res. Lett., 31, L18112, doi:10.1029/2004GL020544, 2004.
Hern ´andez, M. D. A., Burkert, J., Reichert, L., St ¨obener, D., Meyer-Arnek, J., Burrows, J. P.,
30
Dickerson, R. R., and Doddridge, B. G.: Marine boundary layer peroxy radical chemistry during the AEROSOLS99 campaign: Measurements and analysis, J. Geophys. Res., 106, 20 833–20 846, doi:10.1029/2001JD900113, 2001.
![Fig. 9. Average night time HO 2 +Σ RO 2 concentrations for (a) summer (all nights and just last 3 nights, where [NO x ] was significantly higher) and (b) winter (all nights and the only two complete nights)](https://thumb-eu.123doks.com/thumbv2/123doknet/14775213.593339/46.918.169.545.59.515/average-concentrations-summer-nights-nights-significantly-higher-complete.webp)