HAL Id: hal-00298129
https://hal.archives-ouvertes.fr/hal-00298129
Submitted on 8 Jun 2006HAL is a multi-disciplinary open access
archive for the deposit and dissemination of sci-entific research documents, whether they are pub-lished or not. The documents may come from teaching and research institutions in France or abroad, or from public or private research centers.
L’archive ouverte pluridisciplinaire HAL, est destinée au dépôt et à la diffusion de documents scientifiques de niveau recherche, publiés ou non, émanant des établissements d’enseignement et de recherche français ou étrangers, des laboratoires publics ou privés.
Biogeochemical records of past global iron connections
Z. S. An, J. J. Cao, K. K. Anderson, H. Kawahata, R. Arimoto
To cite this version:
Z. S. An, J. J. Cao, K. K. Anderson, H. Kawahata, R. Arimoto. Biogeochemical records of past global iron connections. Climate of the Past Discussions, European Geosciences Union (EGU), 2006, 2 (3), pp.233-265. �hal-00298129�
CPD
2, 233–265, 2006
Past global iron connections Z. S. An et al. Title Page Abstract Introduction Conclusions References Tables Figures J I J I Back Close
Full Screen / Esc
Printer-friendly Version
Interactive Discussion
EGU
Clim. Past Discuss., 2, 233–265, 2006 www.clim-past-discuss.net/2/233/2006/ © Author(s) 2006. This work is licensed under a Creative Commons License.
Climate of the Past Discussions
Climate of the Past Discussions is the access reviewed discussion forum of Climate of the Past
Biogeochemical records of past global
iron connections
Z. S. An1, J. J. Cao1, K. K. Anderson2, H. Kawahata3, and R. Arimoto4
1
State Key Lab of Loess and Quaternary Geology, Institute of Earth Environment, Chinese Academy of Sciences, P.O. Box 17, Xi’an 710075, China
2
Niels Bohr Institute for Astronomy, Physics and Geophysics, University of Copenhagen, Denmark DK-2100 Copenhagen Denmark
3
Geological Survey of Japan, National Institute of Advanced Industrial Science and Technology (AIST) Tsukuba-higashi 1-1-1, Ibaraki 305–8567, Japan
4
Carlsbad Environmental Monitoring and Research Center, New Mexico State University, 1400 University Drive, Carlsbad, NM 88220, USA
Received: 3 April 2006 – Accepted: 7 May 2006 – Published: 8 June 2006 Correspondence to: J. J. Cao ([email protected])
CPD
2, 233–265, 2006
Past global iron connections Z. S. An et al. Title Page Abstract Introduction Conclusions References Tables Figures J I J I Back Close
Full Screen / Esc
Printer-friendly Version
Interactive Discussion
EGU
Abstract
Paleorecords of dust deposition can be used to evaluate global iron connections under conditions different from those today. Dust production and deposition has co-varied with ocean paleoproductivity, pCO2, and climate over glacial-interglacial cycles, and in this paper we review the current understanding and highlight research needs with 5
respect to paleorecords of global iron connections. These records, which include data from terrestrial (loess) deposits, marine sediments, and ice cores, suggest that average eolian deposition rates were approximately 2–20 times higher during glacial periods than during interglacials. Enhanced dust fluxes to the oceans during glacial times, particularly to the main high-nutrient/low-chlorophyll (HNLC) areas of the open ocean 10
(i.e., the Pacific subarctic, the equatorial Pacific, and the Southern Ocean), may have “fertilized” marine biota, thereby enhancing ocean productivity (1–2 fold) and driving atmospheric CO2 lower. Current models yield variable results, however, with glacial-interglacial changes in dust fluxes changing atmospheric pCO2 by the equivalent of 5 to >50% of the total glacial-interglacial change of 80–100 ppm. Positive correlations 15
among Asian dust, ocean productivity and atmospheric CO2in last 130 kyr, 1200 yr and 50 yr indicate that eolian iron has played an important role in global biogeochemical cycles of the past. A simple calculation suggests that one-tenth to one-third of the global change in CO2due to dust-supplied Fe could be ascribed to variations in the dust supply flux from Asia and its associated effects on productivity in the Pacific Ocean. 20
1 Introduction
The relevance of the “iron hypothesis” for glacial-interglacial control of the concentration of atmospheric CO2 stems from the premise that biological productivity in some large portions of the world’s oceans is limited by an insufficient supply of the micro-nutrient iron (Martin, 1990). In these waters, the standing stocks of phytoplankton are relatively 25
CPD
2, 233–265, 2006
Past global iron connections Z. S. An et al. Title Page Abstract Introduction Conclusions References Tables Figures J I J I Back Close
Full Screen / Esc
Printer-friendly Version
Interactive Discussion
EGU
lead to their designation as “high nitrate low chlorophyll” (HNLC) regions. Rather it is a limitation in the supply of iron to the biota in the HNLC regions that prevents the biolog-ical pump from working at its maximum efficiency (i.e. completely using the available NO−3 Coale et al., 1996). Any reduction in dust/iron supply might therefore intensify the Fe limitation where it already exists and possibly cause Fe-based limitation where 5
it was previously non-limiting. One important effect of this would be a reduction in the amount of CO2taken up by the ocean.
Paleorecords of dust in continental sediments, marine sediments and ice cores can be used to verify the existence of global iron connections (GIC) (Jickells et al., 2005) and to evaluate the GICs under conditions different from those today (Martin et al., 10
1994; Kumar et al., 1995; Boyd et al., 2000, 2004; Watson et al., 2000; Johnson et al., 2003; R ¨othlisberger et al., 2004). That is, the evaluation of past GICs provides a historical analog for present-day studies and serves as means for establishing bound-ary conditions and validating model studies. Studies of the Vostok ice core (Petit et al., 1999) for example, have demonstrated that close connections existed between the at-15
mospheric CO2concentrations and atmospheric temperature over Antarctica over the last four glacial cycles. The atmospheric CO2 content is anti-correlated with the dust content in Vostok core, with relatively high atmospheric pCO2(ca. 280 ppm) during in-terglacials, and low atmospheric pCO2 (ca. 190 ppm) during the most intense glacial periods. This suggests that a causal relationship between dust fluxes and pCO2 has 20
acted over glacial time-scales.
The connections between dust supplies to the ocean and atmospheric CO2are nei-ther simple nor direct, however, and nei-there are two main obstacles complicating the in-terpretation of the relationships between dust fluxes and pCO2based on paleorecords. First, in the case of the Vostok ice core, the dust record reflects dust emitted from 25
the Patagonian deserts of Argentina (Petit et al., 1999), and more generally sedimen-tary records from specific areas do not necessarily represent variations in global dust fluxes. Second, while increased dust inputs to the ocean may have primed the bio-logical pump thereby increasing the uptake of CO2 by the surface oceans, variations
CPD
2, 233–265, 2006
Past global iron connections Z. S. An et al. Title Page Abstract Introduction Conclusions References Tables Figures J I J I Back Close
Full Screen / Esc
Printer-friendly Version
Interactive Discussion
EGU
in paleo-productivity have not been clearly established for the various ocean basins around the world in the past, especially not for HNLC regions.
The IGBP “Fast Track” Meeting on “Global Iron Connections” was organized largely because the iron fertilization of the oceans is thought to have great significance in terms of global climatic and environmental changes, in particular for regulating the low 5
glacial-age atmospheric CO2content. While details of the processes involved are still not completely understood, the “iron hypothesis” provides a plausible mechanism for global modification of the ocean’s productivity over geological time scales, by geologi-cal means. This paper focuses on investigations of dust, paleoproductivity, and CO2in the past, and evaluates the evidence for GICs from the paleorecords covering the past 10
130 kyr, 1200 yr, 50 yr.
2 Biogeochemical records for past global iron connections
Here we summarize records of dust, paleoproductivity and atmospheric CO2as chroni-cled in continental sediments, marine sediments and ice cores; these provide evidence for global dust/iron connections.
15
2.1 Global distribution of dust in the present and past
The natural sources of mineral dust today mainly lie in semi-arid to arid belts in the trop-ics and subtroptrop-ics (Fig. 1), with the most important source regions being the Sahara– Sahel in northern Africa and the Gobi–Taklamakan in central Asia (Middleton, 1991; Middleton et al., 1986; Bergametti, 1992). The amount of dust transported from the 20
Sahara has been estimated at 600–700 Mt/year (d’Almeida, 1989), of which ca. 220 Mt is deposited in the North Atlantic (Duce et al., 1991). The total emission of Asian dust is around 500 Mt/yr (Zhang et al., 1997) of which about half dust is deposited to the north Pacific (Prospero et al., 1989; Zhang et al., 1997). Other, less important, source areas for dust include the Middle East (Middleton, 1986a, b; Pease et al., 1998), the northern 25
CPD
2, 233–265, 2006
Past global iron connections Z. S. An et al. Title Page Abstract Introduction Conclusions References Tables Figures J I J I Back Close
Full Screen / Esc
Printer-friendly Version
Interactive Discussion
EGU
part of the Indian subcontinent (Middleton, 1986b), southern South Africa (Prospero, 1981; Prospero et al., 1981), the interior basins of the southwestern USA and the southern High Plains (Orgill and Sehmel, 1976; Lee and Tchakerian, 1995; Bach et al., 1996), southern South America (Ares, 1994; Buschiazzo et al., 1999) and cen-tral Auscen-tralia (Middleton, 1984; McTainsh and Pitblado, 1987; Shao and Leslie, 1997). 5
Dust production and deflation can also occur under periglacial conditions in the high latitudes (Pye, 1995; Landvik, 1998), but in today’s climate, the areas affected are of limited extent and do not contribute significantly to the total global dust budget. Due to the larger source regions, for dust north of the equator, ∼8 times more atmospheric dust is produced and deposited in the northern hemisphere than in the southern hemi-10
sphere (Duce et al., 1991).
The present-day distribution of eolian dust sources is similar to those in the past, especially those in the late Pleistocene, i.e., most dust source regions are located in Sahara and central Asia in the northern Hemisphere. The fates of dust emitted from these two major sources are different, however. When dust from the Sahara is lifted 15
into the atmosphere, a large portion of it either is deposited in the North Atlantic or transported far downwind, and therefore little information on dust fluxes is preserved in continental records in Africa. In contrast, much of the eolian material emitted from the Asian deserts is deposited in nearby downwind regions – the Chinese Loess Plateau first, then the north Pacific, with some of the dust being transported at least as far as 20
Greenland (Biscaye et al., 1997). As a result, the relatively continuous dust records from the land, ocean, and ice cores provide a means for an integrated study of the spatial distribution and temporal variations of Asian dust.
Large-scale changes in dust fluxes over glacial/interglacial cycles are well docu-mented in loess deposits, ice core and sediment records from around the world. These 25
records suggest that the global dust fluxes were 2–20 times higher during the last glaciation compared with the interglacials (e.g. Petit et al., 1981; Hammer et al., 1985; An et al., 1991; Rea, 1994). The increased dust deposition during glacial periods has been explained by several factors, which more than likely act in combination. First, an
CPD
2, 233–265, 2006
Past global iron connections Z. S. An et al. Title Page Abstract Introduction Conclusions References Tables Figures J I J I Back Close
Full Screen / Esc
Printer-friendly Version
Interactive Discussion
EGU
increase in dust supply may have resulted from a reduction in soil moisture and veg-etation cover, which was caused by increased aridity and an expansion of the source regions (Rea, 1994; Petit et al., 1981). Second, an increase in wind intensities under glacial conditions (COHMAP members, 1988) may have entrained more dust and car-ried it farther downstream. Finally, a slowing in the rate at which the hydrological cycle 5
operated could have allowed the dust particles to remain in the atmosphere longer than when the cycling of water was more rapid (Yung et al., 1996, Andersen and Ditlevsen, 1998).
In the past two decades, loess deposits have been used to investigate the spatial-temporal distribution of Asian dust, and these studies indicate that dust deposition 10
was 2–3 times higher during glacial periods than in the interglacials (An et al., 1991; Zhang et al., 1994). Figure 2 is the comparison of the dust flux in four loess profiles from the Chinese Loess Plateau (CLP): (2a) is the dust flux at Potou section (35◦450N, 109◦250E) (An et al., 1991), (2b) at Heimugou section (35◦150N, 109◦250E) (Zhang et al., 1994), (2c) at Zhaojiachuan section (35◦530N, 107◦580E) (Sun, 2000), (2d) at 15
Lingtai section (35◦040N, 107◦390E). The reconstructed dust fluxes for these sites dur-ing the interglacial period, ranged from approximately 8 to 12 g/cm2kyr. During the glacial period, the amount of dust flux increased 2–3 fold, varying between 30 and 45 g cm−2kyr−1. This increase has been ascribed to changes in the aridity of the dust source regions and the strength of Asian winter monsoon (An et al., 1991; Porter and 20
An, 1995).
The sediments in large regions of the ocean floor, especially those in the deep basins, are dominated by atmospherically-derived clay minerals. These regions thus seem to be ideal locations for sampling dust records. In order to understand variations in the dust flux, a sedimentary core was taken the Hess Rise located in the mid-latitude 25
North Pacific under the westerly wind system. The δ18O, grain size and grain shape of type 1 quartz suggest that this quartz is of eolian origin. Strong correlations between Al and aerosol quartz content and mass accumulation rate (MAR) indicate that the alumino silicate minerals in sediments from the open ocean are mainly transported by
CPD
2, 233–265, 2006
Past global iron connections Z. S. An et al. Title Page Abstract Introduction Conclusions References Tables Figures J I J I Back Close
Full Screen / Esc
Printer-friendly Version
Interactive Discussion
EGU
wind. The MAR of mineral aerosol (MARAerosol) varies from 1.6 to 7.3 g/m2/yr during the last 200 kyr (Kawahata et al., 2000). The MARAerosolmaxima occur in Oxygen Isotope Stage (OIS) 4, the latest part of OIS 5, and the middle of OIS 6, moderate maxima occur in early OIS 1 to 2, late OIS 3 and middle OIS 3. These maxima have been ascribed to reduced wet scavenging of dust during transport or decreased vegetative 5
cover in source regions during the summer monsoon and to strengthening of the winds during the winter monsoon (Kawahata et al., 2000).
The quantities and characteristics of dust particles retrieved from ice cores vary greatly with changes in climate. Higher concentrations and smaller particles are gener-ally found for colder conditions in ice cores collected in areas far from the dust sources. 10
During the last glacial period, the dust flux to the polar ice caps changed dramatically in concert with glacial-interglacial cycles and interstadial Dansgaard-Oeschger (or D-O) events. Records from Greenland indicate that most of these changes in dust fluxes occur abruptly, and the changes in the magnitude of the reconstructed dust fluxes are substantial. Dust concentrations over the last glacial cycle roughly fall into four cat-15
egories with the North GReenland Icecore Project (NGRIP) particle concentrations, CN being ∼1×10⁴ml−1 during the early Holocene, ∼5×10⁴ml−1 during the warm in-terstadials, ∼5×10⁵ml−1during the cold stadials and ∼1×10⁶ml−1for the Last Glacial Maximum (Ruth et al., 2003). In comparison to ice cores from Greenland, Antarctic ice cores have lower accumulation rates, and they reach further back in time. For example, 20
the Vostok (Petit et al., 1999) ice core spans 420 kyrs, the Dome Fuji record 340 kyrs (Watanabe et al., 1999), and the new EPICA Dome C record (EPICA members, 2004) at least 740 kyrs. Dust concentrations over the past glacial cycles closely follow the cli-matic changes depicted by variations in the stable hydrogen isotope ratio, δD. Highest dust values are found for the cold marine isotope stages MIS 2, 4, and 6 and increases 25
in dust flux for these periods are by factors, ∼25, ∼20 and ∼12 as compared with the Holocene (Delmonte et al., 2004).
CPD
2, 233–265, 2006
Past global iron connections Z. S. An et al. Title Page Abstract Introduction Conclusions References Tables Figures J I J I Back Close
Full Screen / Esc
Printer-friendly Version
Interactive Discussion
EGU
2.2 Paleoproductivity variations in the past
During glacial times, copious dust fluxes to the ocean, particularly in the main HNLC ar-eas of the open ocean (i.e., the Pacific subarctic, the equatorial Pacific, and the South-ern Ocean), apparently “fertilized” marine biota and the increased biological activity drove atmospheric CO2 lower (Martin, 1990; Berger, 1991). Over the last decade, a 5
considerable body of evidence has accumulated based on paleoceanographic records in HNLC areas documenting past changes in the strength of biological pump.
2.2.1 North Pacific
Despite the fact that this is not a typical HNLC region and there was no corresponding evidence for changes in the Gulf of Alaska (McDonald et al., 1999), paleoceanograph-10
ical data from the mid-latitude northwestern Pacific show increases in productivity dur-ing periods of glaciation (Kawahata et al., 2000; Kawahata, 2002). Primary productiv-ities during the late Pleistocene, as estimated from cores S2612 and LH3166, around 35◦N and S, respectively, in the western Pacific demonstrate that productivity maxima occurred at late Oxygen Isotope Stage 2 (OIS 2), late Stage 4 (OIS 4) (middle Stage 4 15
for L3187) and late Stage 6 (OIS 6) while minima were observed at Stage 5 (Kawahata, 1999). Mass accumulation rates of organic carbon and biogenic opal also show sim-ilar profiles in these cores. These results and paleontological evidence show that the transition zone between subtropical and subarctic waters migrated in near synchrony along the latitudinal transect during the last 150 kyr.
20
A gravity core H3571 recovered from the eastern corner of the Hess Rise at 34◦54.250N and 179◦42.180E was analyzed to understand fluctuations in paleopro-ductivity in the mid-latitude regions of the North Pacific (Kawahata et al., 2000). The MAR of organic carbon (MARorganic) in that core exhibited two prominent maxima, one in OIS 2, the other in 4, and relatively high values in mid- to late OIS 6. These au-25
thors suggested that enhanced primary productivity was most likely responsible for the observed high burial rate of organic carbon in the sediments. Downcore geochemical
CPD
2, 233–265, 2006
Past global iron connections Z. S. An et al. Title Page Abstract Introduction Conclusions References Tables Figures J I J I Back Close
Full Screen / Esc
Printer-friendly Version
Interactive Discussion
EGU
data from Site 887 (54◦21.920N, 148◦26.780W) indicate that exceptional episodic in-creases in primary production occurred throughout the Brunhes Chron (McDonald et al., 1999); this was marked by rapid settling of biogenic detritus and the deposition of diatom oozes. The diatom-rich intervals are characterized by an abundance and rapid accumulation of large frustules. This deduction is supported by230Th data showing a 5
doubling to a quintupling of the sedimentation rate in the two large diatom bands oc-curring in Stage 5.2 and in the 5/4 transition. We speculate that the episodic input of meltwater- or dust-borne iron from Asian or Alaskan sources may have promoted the extraordinary diatom production events recorded in the sedimentary record.
2.2.2 Equatorial Pacific 10
High biological productivity occurred during glacial times in the central equatorial Pa-cific (Murray et al., 2000), in the western equatorial PaPa-cific (Kawahata et al., 1998), and in eastern equatorial Pacific (Weber and Pisias, 1999). Temporal and spatial variability in several chemical proxies of export production, and in particular the distributions of Ba, scavenged Al, and P, have been studied in a set of sediment cores gathered along 15
a cross-equatorial transect at 5◦S, 2◦S, 0◦, 2◦N, and 4◦N across the central equatorial Pacific Ocean (Murray et al., 2000). During interglacial oxygen isotope Stage 11, the chemical proxies indicate lower particle fluxes and export production compared with OIS Stage 12 (glacial). That is, even though maximum productivity occurred at the equator during both glacial and interglacial conditions, the magnitude of export pro-20
duction integrated from 5◦S to 4◦N during Stage 11 was 25–50% less than during Stage 12, and also was 25–50% less than it is now.
Similar to the central equatorial Pacific, the primary productivity, as inferred from the C4402 sediments in the western equatorial Pacific in the West Caroline Basin, increased during Stage 2, Stage 3, late Stage 6, Stage 6/7 boundary and Stage 8 25
(Kawahata et al., 1998). These results are generally representative of other reports documenting higher glacial productivity in low-latitude regions. In the same way, high-resolution records of glacial-interglacial variations in biogenic carbonate in sediments
CPD
2, 233–265, 2006
Past global iron connections Z. S. An et al. Title Page Abstract Introduction Conclusions References Tables Figures J I J I Back Close
Full Screen / Esc
Printer-friendly Version
Interactive Discussion
EGU
from 15 sites in the eastern equatorial (sampling resolution is ∼1 kyr) demonstrate that accumulation rates of carbonate are higher during glacials and glacial-interglacial transitions in all cores (Weber and Pisias, 1999).
2.2.3 Southern Ocean
In contrast to the Equatorial and North Pacific, data from the South Pacific suggest 5
little change or slight decrease in export production during glacial times (Berger, 1991; Chase et al., 2003). Nevertheless, a study of N isotopes in the modern Southern Ocean corroborates the interpretation of the δ15N record in sediments that suggest an increase in surface nitrate utilization during glacial periods (Altabet and Francois, 2001). Data from the South Atlantic and the Indian Ocean clearly indicate a lower 10
export production south of the modern-day Polar Front and higher export between approximately 53.5◦S and 40◦S (Kumar et al., 1995; Anderson et al., 1998; Nees et al., 1999; Moore et al., 2000). Complementary data for a set of radionuclide proxies in sediments from the southernmost Atlantic Ocean indicate that glacial periods were characterized by greatly increased fluxes of biogenic detritus out of surface waters 15
(Kumar et al., 1995). This increase in export production, which may have contributed to lower concentrations of carbon dioxide in the glacial atmosphere, was coincident with at least a five-fold increase in the accumulation of lithogenic iron; this eolian material was transported from the Patagonian deserts. Paleoceanographic records based on proxies of export production have been constructed for the South Atlantic sector of 20
the Southern Ocean (Anderson et al., 1998). A radionuclide-ratio proxy of particle flux (10Be/230Th) and the accumulation rate of authigenic uranium, which responds to the flux of organic carbon to the sea bed, both indicate a dramatic enhancement, relative to the present, in the export production of the Subantarctic zone (approximately the region between the present-day positions of the Subtropical Convergence and the Antarctic 25
Polar Front) during glacial periods.
Paleontological data for last two glacial-interglacial cycles preserved in core MD88-779 from the southeastern Indian Ocean over the South Tasman Rise (47◦50.690S,
CPD
2, 233–265, 2006
Past global iron connections Z. S. An et al. Title Page Abstract Introduction Conclusions References Tables Figures J I J I Back Close
Full Screen / Esc
Printer-friendly Version
Interactive Discussion
EGU
146◦32.750E; 2260 m water depth) have been analysed by Nees et al. (1999). Diatom and benthic foraminiferal data indicate there were significant increases in ocean sur-face productivity during glacial periods and, in particular, during OIS 2, late OIS 3 and OIS 6. Moore et al. (2000) estimated that export production in the Southern Ocean as a whole increased by 2.9–3.6 GT C yr−1 at the last glacial maximum (LGM) compared 5
with the modern era.
Finally, the data for nine sediment cores from North Pacific, Equatorial Pacific, and South Ocean, which are major HNLC regions indicate that paleoproductivity was higher during glacial periods than in interglacials (Fig. 3). Although the magnitudes of the increases are not same in all regions, the paleoproductivity during glacial periods was 10
up to twice times that during interglacials. 2.3 Impact of dust on atmospheric CO2 2.3.1 CO2changes in ice cores
Analyses of bubbles of ancient air trapped in Antarctic ice reveal that atmospheric
P CO2 during peak glacial times, was roughly 80–100 ppm lower than the interglacial 15
value of 280 ppm (Barnola et al., 1987). The connection between atmospheric tem-perature changes and CO2 levels has been the subject of considerable study. For example, Petit et al. (1999) found generally good agreement between atmospheric tem-perature, CO2and dust levels in Antarctic ice, however the temporal resolution of the data in that study was relatively low, and the uncertainty in the gas-ice age difference 20
too large for any firm conclusions to be reached on the relative timing of the changes. Related studies show that CO2 in ice from Taylor Dome in Antarctica (Inderm ¨uhle et al., 2000) covaries with δD – this is an indicator of atmospheric temperature over the Antarctic warming events A1 to A4 (20 to 60 kyr BP).
A more general picture of paleoclimate relationships has emerged from data for 25
Glacial Terminations I and III (Monnin et al., 2001; Caillon et al., 2003; R ¨othlisberger et al., 2004). These authors have shown that changes in CO2 are highly correlated with
CPD
2, 233–265, 2006
Past global iron connections Z. S. An et al. Title Page Abstract Introduction Conclusions References Tables Figures J I J I Back Close
Full Screen / Esc
Printer-friendly Version
Interactive Discussion
EGU
changes in Antarctic temperature, however with CO2changes lag temperature by 500– 800 years. Certain features in the CO2curves, however, are closely connected to and indeed in phase with Northern Hemisphere events such as the onset of the Bølling-Allerød period and the end of the Younger Dryas. From a comparison of Antarctic non-seasalt calcium as an indicator for wind-born dust and CO2R ¨othlisberger et al. (2004) 5
concluded that only a minor part (20 ppm) of the total CO2 increase (80 ppm) during the last transition can be ascribed to increased iron limitation of the Southern Ocean caused by a declining dust flux from Patagonia. They ascribe another 8 ppm of the change in CO2to iron limitation in the North Pacific.
2.3.2 Models of global iron connections 10
Numerical models of global ocean biogeochemistry have been developed to quantify the effects dust deposition on marine biota and atmospheric pCO2. Differences in dust deposition from the present-day to LGM (Mahowald et al., 1999) led models predict a CO2drawdown in the range 5–45 ppm (Archer et al., 2000; Bopp et al., 2003; Ridgwell, 2001; Watson et al., 2000). The whole-ecosystem global modeling study by Watson 15
et al. (2000), which was based on variations in dust fluxes observed in the Vostok core and holding all other boundary conditions constant, showed a drawdown of atmo-spheric CO2by 40 ppm, about half of the observed change. On the other hand, Archer et al. (2000), using an oceanic general circulation model with a simple biogeochemical cycle, showed that the impact of iron fertilization resulted only in an 8 ppm drawdown of 20
atmospheric CO2. A state-of-the-art ocean biogeochemistry model predicted that the maximum impact of high dust deposition on atmospheric CO2must be <30 ppm (Bopp et al., 2003).
There are substantial uncertainties in our current understanding of the connections between the ocean carbon and iron cycle and how they separately and jointly respond 25
to perturbations, and how they are affected by ocean circulation and the terrestrial biosphere. The marine iron cycle may well contribute to the instability in the climate system though positive feedback links. Therefore improving the representation of iron
CPD
2, 233–265, 2006
Past global iron connections Z. S. An et al. Title Page Abstract Introduction Conclusions References Tables Figures J I J I Back Close
Full Screen / Esc
Printer-friendly Version
Interactive Discussion
EGU
biogeochemistry in ocean carbon cycle models may be a prerequisite to gaining a full understanding of late Quaternary atmospheric CO2changes and climatic variability.
3 Relationships among Asian dust, ocean productivity, and atmospheric CO2 over different time scales
Arid and semi-arid regions in Central Asia are one of the world’s largest sources of 5
dust, and the North Pacific is also one of the most important depositional regions of the global oceans. However, the connections between dust fluxes and ocean productivity in the Asia/Pacific region and the roles they play in the global climatic system are not clearly understood. An examination of the variations of dust/iron-paleoprodutivity-CO2in the Asian Pacific region based on continuous records provides a broad view of 10
dust/iron connections and the relationship to biogeochemical systems. 3.1 The last 130 kyr
The wind-blown loess-paleosol and Red-clay sequence in the Chinese Loess Plateau (CLP) provides the most complete record of Asian dust, covering at least 6–8 Ma BP (An et al., 2001). Loess deposits quickly and changes little during loessification; this 15
makes it a nearly ideal material for reconstructing high-resolution dust records.
The classical Lingtai loess section (35◦040N, 107◦39◦E) is located in the western part of the CLP. Dust deposition in this profile can be traced back to 7 Ma B.P. (Sun et al., 1998). The upper section has been studied intensively to provide a dust record for the past 130 kyr. As loess and paleosol have different deposition rates, subsam-20
ples were taken at intervals of 4 and 2 cm, with the higher resolution samples from the more rapidly depositing loess. Continuous records of magnetic susceptibility, particle-size distribution and ten major elements (Si, Al, Fe, Ca, K, P, Mn, Mg, Na, Ti) have been generated. Based on correlations with the particle concentration curve (Ruth et al., 2003) and the oxygen isotopic curve of the GRIP ice cores on the SS09 time-25
CPD
2, 233–265, 2006
Past global iron connections Z. S. An et al. Title Page Abstract Introduction Conclusions References Tables Figures J I J I Back Close
Full Screen / Esc
Printer-friendly Version
Interactive Discussion
EGU
scale (NGRIP, 2004), we match the three rapid changes in particle-size distribution at 1.08 m, 8.24 m and 10.68 m in the profile with markers for the Younger Dryas/Holocene transition (11.55 kyr), OIS4/OIS5 (78.6 kyr) and OIS5/OIS6 (129.3 kyr) (Johnsen et al., 2001; Yuan et al., 2004). The ages for the successive stratigraphic levels were calcu-lated based on the grain-size vs. age model of Porter and An (1995), assuming that 5
the >43 µm coarse particle fraction is linearly related to the deposition rate. Elemental fluxes (EFx) were reconstructed using the equation: EFx=CxρLDR, where Cx refers to concentration of element x, ρ is bulk density for dust particle (1.6 g cm−3), LDR is linear deposition rate of loess material. The dust flux (Fdust) is calculated as the product of aluminum concentration, assuming 6% Al by weight for Asian dust (Zhang et al., 1994). 10
Figure 4 shows the dust fluxes for Lingtai loess profile over the past 130 kyr varied from 7.1 g cm−2kyr−1 to 27.6 g cm−2kyr−1. As was seen for the ocean sediments, high dust fluxes occurred during the glacial stages and low dust fluxes during the interglacial stages. During the last interglacial (OIS5), the dust flux dropped to the lowest level of any stage in the record, averaging just 10.3 g cm−2kyr−1. On the other hand, the 15
dust flux increased in the last glacial, especially in OIS2 and OIS4, with an average value of 20.1 g cm−2kyr−1, or about 2-times higher than during the last interglacial. In the Holocene, the dust flux decreased quickly, averaging ∼19.0 g cm−2kyr−1, but it remained higher than during the last interglacial.
Core H3571 was taken from mid-latitude North Pacific, which is a main deposition 20
region for Asian dust. The organic mass accumulation rate (MAROC) determined for H3571 was used as a proxy for paleoproductivity in the North Pacific (Kawahata et al., 2000). During the past 130 kyr, the MAROC fluctuated over glacial-interglacial timescales: the MAROC is high during the glacial and relatively low during the inter-glacial. The carbon/nitrogen atom ratios in organic matter verified that the organic C 25
was mainly of marine in origin, and this supports the notion that paleoproductivity in the North Pacific increases in glacial and decreases in interglacial periods.
As Fig. 4 shows, the dust and iron fluxes at Lingtai and the MAROC of H3571 all display similar patterns over the past 130 kyr: high productivity occurred during glacial
CPD
2, 233–265, 2006
Past global iron connections Z. S. An et al. Title Page Abstract Introduction Conclusions References Tables Figures J I J I Back Close
Full Screen / Esc
Printer-friendly Version
Interactive Discussion
EGU
periods when dust fluxes were high, and low productivity occurred in the interglacials when the dust fluxes were lower. This demonstration that the input of Asian dust is connected to productivity in North Pacific raises the possibility that a deficit of iron in the open ocean is the main cause for the observed low productivity.
The oceanic biological pump, which transports carbon from the atmosphere to the 5
deep sea, has been identified as a key modulator of atmospheric P CO2 over glacial-interglacial timescales (Broecker and Henderson, 1998). From Fig. 4, it can be seen that the concentration of CO2in air extracted from Vostok ice is strongly anti-correlated with the MAR for total organic carbon in the North Pacific, which is a proxy for ma-rine productivity. This inverse relationship between atmospheric CO2 and productivity, 10
implies the biological pump operating in the North Pacific may have affected the at-mospheric CO2 level during the past 130 kyr. The results support the hypothesis that changes in atmospheric CO2are at least partly due to the fluctuations in iron deposition in the Asia-Pacific region.
3.2 The last 1200 years 15
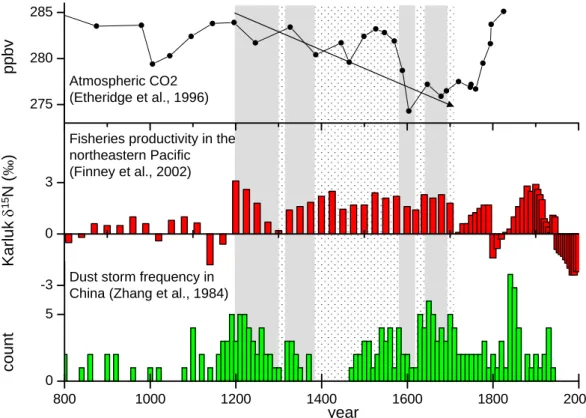
Beside the effects of the GICs over glacial-interglacial cycles, geological and historical records have shown that dust/iron connections operated in the northern Hemisphere over the last 1200 years. Zhang et al. (1984) reconstructed the frequency of dust events over this time period from Chinese historical documents, and Fig. 5a presents a time series of dust storm frequencies based on those analyses. Before 1200 A.D., the 20
frequency of dust storms was relatively low, averaging 1.5 times/year. From 1200 A.D. to 1700 A.D., the occurrence frequency of dust events increased to ∼3 times/year. Figure 5b presents a comparable 1200 yr record of paleoproductivity reconstructed from δ15N data for cores of Karluk Lake sediments from Kodiak Island, Alaska. The
δ15N profile (‰) in these sediments is a proxy for sockeye salmon abundances in 25
Alaska, and by implication a first-order measure of productivity for the northeastern Pacific Ocean.
CPD
2, 233–265, 2006
Past global iron connections Z. S. An et al. Title Page Abstract Introduction Conclusions References Tables Figures J I J I Back Close
Full Screen / Esc
Printer-friendly Version
Interactive Discussion
EGU
that is, positive values of δ15N indicate an increase of fisheries productivity, and vice versa. Before ∼AD 1200, the δ15N is much lower (∼−0.5‰) than average, whereas it reached ∼2.0‰ from AD 1200 to AD 1700, suggesting that the paleoproductivity in the North Pacific increased during this 500 yr interval (Finney et al., 2002). More to the point, the period of increased δ15N matches the more frequent dust storms in 5
Asia (Fig. 5a), implying that the increase of Asian dust is a positive factor contribut-ing to the productivity changes in North Pacific. At the same time, the atmospheric
P CO2 dropped about 10 ppm based on the ice core record at Low Dome in Antarc-tic. Although the reasons for the decrease in CO2 are likely diverse, the influence of dust/iron fluxes to the oceans is a distinct possibility.
10
3.3 The last 50 years
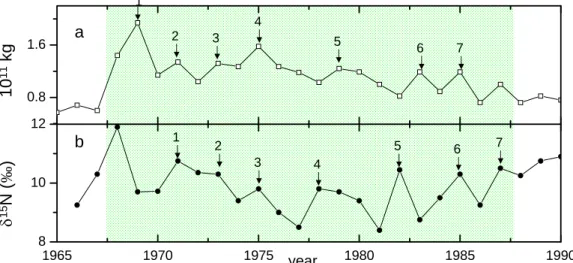
The influence of Asian dust on ocean productivity recently has been detected for mod-ern dust events (Bishop et al., 2002). However, there are almost no studies that have addressed the connections between dust and paleoproductivity over decadal time scales. Here we compare recently published data to assess these connections. Fig-15
ure 6a presents the total Asian dust emissions simulated by Northern Aerosol Regional Climate Model (NARCM) from 1965 to 1990 (Zhang et al., 2003). These model-derived estimates of springtime emissions varied between 0.55×10¹⁰ and 2.0×10¹¹kg, with a maximum in 1969 and a minimum in 1965. From 1969 to 1990, the total emission displayed a decreasing trend. Figure 6b shows the δ15N variations of Pacific salmon, 20
which reflect the changes of primary productivity in eastern Pacific (Satterfield and Finney, 2002). Even though the estimation of Asian dust emissions has large uncer-tainties and the temporal resolution is low, seven peaks from 1968 to 1988 can be seen to match between the two time series, with a 2–3 year lag in the productivity records. While this is clearly a simple and crude first assessment, the results suggest a possible 25
correspondence between dust/iron fluxes and productivity in Asia-Pacific regions, and we believe this deserves further investigation.
CPD
2, 233–265, 2006
Past global iron connections Z. S. An et al. Title Page Abstract Introduction Conclusions References Tables Figures J I J I Back Close
Full Screen / Esc
Printer-friendly Version
Interactive Discussion
EGU
3.4 The influence of Asian dust on past changes in global atmospheric CO2
Here we use a simple approach to semi-quantitatively evaluate the contribution of Asian dust to the global change in the concentration of atmospheric CO2. The principle of this method, as described in R ¨othlisberger et al. (2004), is to estimate data-based bounds for the contribution of iron fertilization to atmospheric CO2 variations during selected 5
periods. In this case, the estimates are made for periods when variations in Asian dust supply were large, but changes in other parameters likely to affect atmospheric CO2 were modest.
This assessment spans the last 60 kyr, and Fig. 7 presents a comparison of the dust records of the Lingtai profile with Vostok dust and with atmospheric CO2records from 10
the Taylor and Vostok cores (Smith et al., 1999; EPICA community members, 2004). In general, one would assume that the loess from the CLP reflect the dust fluxes in north-ern hemisphere while the Vostok records reflect conditions in southnorth-ern hemisphere. A comparison of these records shows that there was a period during the last glacial maximum when the dust fluxes in the two hemispheres were reversed. From 23 kyr 15
to 18 kyr B.P., the deposition of Asian dust as recorded in the Lingtai loess increased quickly, but the dust concentration in the Vostok core for this period indicates the oppo-site trend was occurring in the southern hemisphere, that is dust concentrations were decreasing. Furthermore, the CO2 concentrations in Vostok ice core decreased by 9 ppm during this period and by 4 ppm decrease in the high resolution Tayor ice core. 20
One could argue that the observed change of 4 to 9 ppm in CO2concentration was due to the influence of Asian dust deposition to the Pacific if it is assumed that the other mechanisms contributing to the CO2changes remained constant. While this likely rep-resents an upper limit for the effect of increased iron fertilization due to an increase in dust input into the Pacific Ocean, this result is consistent with the 6 to 8 ppm effect 25
estimated by Rothlisberger et al. (2004). Since the maximum impact of high dust de-position on global atmospheric CO2is though to be around 30 ppm (Bopp et al., 2003), it would appear that one-tenth to one-third of the global change in CO2caused by dust
CPD
2, 233–265, 2006
Past global iron connections Z. S. An et al. Title Page Abstract Introduction Conclusions References Tables Figures J I J I Back Close
Full Screen / Esc
Printer-friendly Version
Interactive Discussion
EGU
deposition is due to Asian dust.
4 Concluding remarks
In summary, the positive correlations among Asian dust, ocean productivity and at-mospheric CO2 over different time scales indicate an important role of dust/iron in global biogeochemical cycles in the past. The GICs revealed though examination of 5
paleorecords are generally consistent with the results of modern studies. Dust/iron connections clearly existed in the Asia/Pacific region in the past, and further studies are needed to compare past records of GICs with those occurring today. A simple es-timation shows that one-tenth to one-third of the change in global CO2due to the GIC was caused by the change the dust dynamics in Asia and the associated effects on 10
productivity in the Pacific Ocean.
Acknowledgements. This paper is a result of an IGBP “Fast Track” Meeting on “Global Iron
Connections” held in Norwich in April 2004. This project is supported by the National Basic Research Program of China (2004CB720200).
References 15
Altabet, M. A. and Francois, R.: Nitrogen isotope biogeochemistry of the Antarctic polar frontal zone at 170 degrees W., Deep-Sea Res., 48, 4247–4273, 2001.
An, Z. S., Kutzbach, J. E., Prell, W. L., and Porter. S. C.: Evolution of Asian monsoons and phased uplift of the Himalaya-Tibetan plateau since Late Miocene times, Nature, 411, 62– 66, 2001.
20
An, Z. S., Kukla, G., Porter, S. C., and Xiao, J. L.: Late Quaternary dust flow on the Chinese Loess Plateau, Catena, 18, 125–132, 1991a.
An, Z. S., Kukla, G. J., Porter, S. C., et al.: Magnetic susceptibility evidence of monsoon vari-ation on the loess plateau of central China during the last 130 000 years, Quat. Res., 36, 29–36, 1991b.
CPD
2, 233–265, 2006
Past global iron connections Z. S. An et al. Title Page Abstract Introduction Conclusions References Tables Figures J I J I Back Close
Full Screen / Esc
Printer-friendly Version
Interactive Discussion
EGU
Andersen, K. K. and Ditlevsen, P. D.: Glacial/interglacial variations of meridional transport and washout of dust: A one-dimensional model, J. Geophys. Res., 103, 8955–8962, 1998. Anderson, R., Kumar, N., Mortlock, R., Froelich, P., Kubik, P., Dittrich-Hannen, B., and Suter,
M.: Late Quaternary changes in productivity of the Southern Ocean, J. Mar. Syst., 17, 497– 514, 1998.
5
Archer, D., Winguth, A., Lea, D., and Mahowald, N.: What caused the glacial/interglacial atmo-spheric pCO2 cycles?, Rev. Geophys., 38, 159–189, 2000.
Ares, J.: Long-range long-term transport and decay of PAHs in a Semi-arid coastal area of Argentina, Toxicol. Environ. Chem., 41, 109–123, 1994;
Bach, A. J., Brazel, A. J., and Lancaster, N.: Temporal and spatial aspects of blowing dust
10
in the Mojave and Colorado deserts of southern California, 1973–1994, Phys. Geogr., 17, 329–353, 1996.
Bareille, G., Labracherie, M., Bertrand, P., Labeyrie, L., Lavaux, G., and Dignan, M.: Glacial-interglacial changes in the accumulation rates of major biogenic components in Southern Indian Ocean sediments, J. Mar. Syst., 17, 527–539, 1998.
15
Barnola, J.-M., Raynaud, D., Korotevich, Y., and Lorius, C.: Vostok ice core provides 160,000 year record of atmospheric CO2, Nature, 329, 408–414, 1987.
Bergametti, G.: Atmospheric cycle of desert dust, Encyclopedia of Earth System Science, Academic Press, San Diego, 171–182, 1992.
Berger, W. H.: Productivity of the Glacial Ocean: Discussion of the Iron Hypothesis, Limnol.
20
Oceanogr., 36(8), 1899–1918, 1991.
Biscaye, P. E., Grousset, F. E., Revel, M., van der Gaast, S., Zielinski, G. A., Vaars, A., and Kukla, G.: Asian provenance of glacial dust stage 2 in the Greenland Ice Sheet Project 2 Ice Core, Summit, Greenland, J. Geophys. Res., 102, 26 765–26 781, 1997.
Bishop, J. K. B., Davis, R. E., and Sherman, J. T.: Robotic observations of dust storm
enhance-25
ment of carbon biomass in the North Pacific, Science, 298, 817–821, 2002.
Bonn, W. J., Gingele, F. X., Grobe, H., Mackensen, A., and Futterer, D. K.: Paleoproductivity at the Antarctic continental margin: Opal and barium records for the last 400 kyr, Palaeogeogr. Palaeoclimatol. Palaoecol., 139, 195–211, 1998.
Bopp, L., Kohfeld, K. E., Quere, C. L., et al.: Dust impact on marine biota and atmospheric CO2
30
during glacial periods, Paleoceanography, 18(2) 1046, doi:10.1029/2002PA000810, 2003. Boyd, P. W., Law, C. S., Wong, C. S., et al.: The decline and fate of an iron-induced subarctic
CPD
2, 233–265, 2006
Past global iron connections Z. S. An et al. Title Page Abstract Introduction Conclusions References Tables Figures J I J I Back Close
Full Screen / Esc
Printer-friendly Version
Interactive Discussion
EGU
Boyd, P., Watson, A. J., Law, C. S., et al.: A mesoscale phytoplankton bloom in the polar Southern Ocean stimulated by iron fertilization, Nature, 407, 695–702, 2000.
Buschiazzo, D. E., Zobeck, T. B., and Aimar, S. B.: Wind erosion in loess soils of the Semiarid Argentinian Pampas, Soil Sci., 164, 133–138, 1999.
Caillon, N., Severinghaus, J. P., Jouzel, J., et al.: Timing of Atmospheric CO2 and Antarctic
5
Temperature Changes Across Termination III, Science, 299, 1728–1731, 2003.
Chase, Z., Anderson, R., Fleisher, M., and Kubik, P.: Accumulation of biogenic and lithogenic material in the Pacific sector of the Southern Ocean during the past 40,000 years, Deep Sea Res., Part II, 50(3–4), 799–832, 2003.
Coale, K., Johnson, K. S., Fitzwater, S. E., et al.: A massive phytoplankton bloom induced by
10
an ecosystem-scale iron fertilization experiment in the equatorial Pacific Ocean, Nature, 383, 495–501, 1996.
COHMAP Members: Climatic changes of the last 18,000 years: Observations and model sim-ulations, Science, 241, 1043–1052, 1988.
d’Almeida, G. A.: Desert aerosol: characteristics and effects on climate, in: Palaeoclimatology
15
and Palaeometeorology: Modern and Past Patterns of Global Atmospheric Transport, edited by: Leinen, M. and Sarnthein, M., Kluwer Academic Publishing, Dordrecht, 311–338, 1989. Delmonte, B., Basile-Doelsch, I., Petit, J. R., et al.: Comparing the EPICA and Vostok dust
redords during the last 220,000 years: Stratigraphic correlation and provenance in glacial periods, Earth Sci. Rev., 66, 63–87, 2004.
20
Duce, R. A., Liss, P. S., Merrill, J. T., Atlas, E. L., and Buat-Menard, P.: The atmospheric input of trace species to the world ocean, Global Biochem. Cycles, 5, 193–259, 1991.
EPICA community members: Eight glacial cycles from an Antarctic ice core, Nature, 429, 623– 628, 2004.
Etheridge, D. M., Steele, L. P., Langenfelds, R. L., et al.: Natural and anthropogenic changes
25
in atmospheric CO2over the last 1000 years from air in Antarctic ice and firn, J. Geophys. Res., 101, 4115–4128, 1996.
Finney, B. P., Gregory-Eaves, I., Douglas, M. S. V., and Smol, J. P.: Fisheries productivity in the northeastern Pacific Ocean over the past 2200 years, Nature, 416, 729–733, 2002.
Frank, M., Gersonde, R., van der Loeff, M. R., Bohrmann, G., Nrnberg, C. C., Suter, M., and
30
Mangini, A.: Similar glacial and interglacial export bioproductivity in the Atlantic sector of the Southern Ocean: Multiproxy evidence and implications for glacial atmospheric CO2,
CPD
2, 233–265, 2006
Past global iron connections Z. S. An et al. Title Page Abstract Introduction Conclusions References Tables Figures J I J I Back Close
Full Screen / Esc
Printer-friendly Version
Interactive Discussion
EGU
Fujii, Y., Kohno, M., Matoba, S., et al.: A 320 k-year record of microparticles in the Dome Fuji, Antarctica ice core measured by laser-light scattering, Mem. Natl. Polar Res., 57, 46–62, 2003.
Hammer, C. U., Clausen, H. B., Dansgaard, W., et al.: Continuous impurity analysis along the Dye 3 deep core, in: Greenland Ice Core: geophysics, geochemistry, and the environment,
5
edited by: Langway Jr., C. C., Oeschger, H., and Dansgaard, W., Geophysical Monographs, AGU, Washington, DC, 33, 90–94, 1985.
Hansson, M. E.: The Renland ice core: a northern hemisphere record of aerosol composition over 120,000 years, Tellus, 46B, 390–418, 1994.
Hesse, P. P.: The record of continental dust from Australia in Tasman Sea sediments, Quat.
10
Sci. Rev., 13, 257–272, 1994.
Hesse, P. P. and McTainsh, G. H.: Last Glacial Maximum to early Holocene wind strength in the mid-latitudes of the southern hemisphere from aeolian dust in the Tasman Sea, Quat. Res., 52, 343–349, 1999.
Inderm ¨uhle, A., Monnin, E., Stauffer, B., Stocker, T. F., and Wahlen, M.: Atmospheric CO2
15
concentration from 60 to 20 kyr BP from the Taylor Dome ice core, Antarctica, Geophys. Res. Lett., 27(5), 735–738, 2000.
Jickells, T. D., An, Z. S., Andersen, K. K., et al.: Global Iron Connections Between Desert Dust, Ocean Biogeochemistry, and Climate, Science, 308, 67–71, 2005.
Johnsen, S. J., Dahl-Jensen, D., Gundestrup, N., et al.: Oxygen isotope and paleotemperature
20
records from six Greenland ice-core stations: camp century, Dye-3, GRIP, GRIP2, Renland and NorthGRIP, J. Quat. Sci., 16(4), 299–307, 2001.
Johnson, K. S., Elrod, V. A., Fitzwater, S. E., et al.: Surface ocean-lower atmosphere inter-actions in the Northeast Pacific Ocean Gyre: Aerosols, iron, and the ecosystem response, Global Biogeochem. Cycles, 17(2), 1063, doi:10.1029/2002GB002004, 2003.
25
Kawahata, H., Suzuki, A., and Ahagon, N.: Biogenic sediments in the West Caroline Basin, the western equatorial Pacific during the last 330,000 years, Marine Geology, 149, 155–176, 1998.
Kawahata, H., Okyrmoto, T., Matsumoto, E., and Ujiie, H.: Fluctuations of eolian flux and ocean productivity in the mid-latitude North Pacific during the last 200 kyr, Quat. Sci. Rev., 9, 1279–
30
1282, 2000.
Kawahata, H.: Shifts in oceanic and atmospheric boundaries in the Tasman Sea (Southwest Pacific) during the Late Pleistocene: Evidence from organic carbon and lithogenic fluxes,
CPD
2, 233–265, 2006
Past global iron connections Z. S. An et al. Title Page Abstract Introduction Conclusions References Tables Figures J I J I Back Close
Full Screen / Esc
Printer-friendly Version
Interactive Discussion
EGU
Palaeogeography Palaeoclimatology Palaeoecology, 184, 225–249, 2002.
Kolla, V. and Biscaye, P. E.: Distribution and origin of quartz in the sediments of the Indian Ocean, J. Sediment. Petrol., 47, 642–649, 1977.
Kumar, N., Anderson, R. F., Mortlock, R. A., Froelich, P. N., Kubik, P., Dittrich-Hannen, A., and Suter, M.: Increased biological productivity and export production in the glacial Southern
5
Ocean, Nature, 378, 675–680, 1995.
Landvik, J. Y.: Wind erosion and transport in an Arctic environment. An analogue to past pro-cesses in mid latitude regions, in: Dust Aerosols, Loess, Soils and Global Change, edited by: Busacca, A., Washington State University, Seattle, WA, 19–21, 1998.
Lee, J. A. and Tchakerian, V. P.: Magnitude and frequency of blowing dust on the Southern
10
High Plains of the United States, 1947–1989. Ann. Assoc. Am. Geogr., 85, 684–693, 1995. Mahowald, N., Kohfeld, K. E., Hansson, M., et al.: Dust sources and deposition during the Last
Glacial Maximum and current climate: a comparison of model results with paleodata from ice cores and marine sediments, J. Geophys. Res., 104, 15 895–16 436, 1999.
Marcantonio, F., Anderson, R., Higgins, S., Fleisher, M., Stute, M., and Schlosser, P.: Abrupt
15
intensification of the SW Indian Ocean monsoon during the last deglaciation: Constraints from Th and Pa and He isotopes, Earth Planet. Sci. Lett., 184, 505–514, 2001.
Martin, J. H.: Glacial-interglacial CO2 change: the iron hypothesis, Paleoceanography, 5, 1–13, 1990.
Martin, J. H. and Fitzwater, S. E.: Iron deficiency limits phytoplankton growth in the northeast
20
Pacific subarctic, Nature, 331, 341–343, 1988.
Martin, J. H., Coale, K. H., Johnson, K. S., et al.: Testing the iron hypothesis in ecosystems of the equatorial Pacific Ocean, Nature, 371, 123–129, 1994.
Martin, J. H. and Gordon, R. M.: Northeast Pacific iron distributions in relation to phytoplankton productivity, Deep-Sea Res., 35, 177–196, 1987.
25
McDonald, D., Pedersen, T., and Crusius, J.: Multiple late Quaternary episodes of exceptional diatom production in the Gulf of Alaskyr, Deep Sea Res. Part II, 46, 2993–3017, 1999. McTainsh, G. H. and Pitblado, J. R.: Dust storms and related phenomena measured from
meteorological records in Australia, Earth Surf. Processes Landforms, 12, 415–424, 1987. Middleton, N. J.: A geography of dust storms in south-west Asia, J. Climatol., 6, 183–196,
30
1986b.
Middleton, N. J.: Dust storms in Australia: frequency, distribution and seasonality, Search, 15, 46–47, 1984.
CPD
2, 233–265, 2006
Past global iron connections Z. S. An et al. Title Page Abstract Introduction Conclusions References Tables Figures J I J I Back Close
Full Screen / Esc
Printer-friendly Version
Interactive Discussion
EGU
Middleton, N. J.: Dust storms in the Middle East, J. Arid Environ., 10, 83–96, 1986a.
Middleton, N. J.: Dust storms in the Mongolian People’s Republic, J. Arid Environ., 20, 287– 297, 1991.
Middleton, N. J., Goudie, A. S., and Wells, G. L.: The frequency and source areas of dust storms, in: Aeolian Geomorphology, edited by: Nickling, W. G., Allen and Unwin, Boston,
5
237–260, 1986.
Monnin, E., Inderm ¨uhle, A., D ¨allenbach, A., et al.: Atmospheric CO2 concentrations over the last glacial termination, Science, 291, 112–114, 2001.
Moore, J. K., Abbott, M. R., Richman, J. G., et al.: The Southern Ocean at the last glacial maximum: a strong sink for atmospheric carbon dioxide, Global Biogeochem. Cycles, 14,
10
455–475, 2000.
Murray, R. W., Knowlton, C., Leinen, M., et al.: Export production and terrigenous matter in the Central Equatorial Pacific Ocean during interglacial oxygen isotope Stage 11, Global and Planetary Change, 24, 59–78, 2000.
Nees, S., Armand, L., Deckker, P. D., et al.: A diatom and benthic foraminiferal record from
15
the South Tasman Rise (southeastern Indian Ocean): implications for palaeoceanographic changes for the last 200,000 years, Marine Micropaleontology, 38, 69–89, 1999.
Orgill, M. M. and Sehmel, G. A.: Frequency and diurnal variation of dust storms in the contigu-ous. U.S.A., Atmos. Environ., 10, 813–825, 1976.
Paytan, A., Kastner, M., and Chavez, F.: Glacial to interglacial fluctuations in productivity in the
20
equatorial Pacific as indicated by marine barite, Science, 274, 1355–1357, 1996.
Pease, P. P., Tchakerian, V. P., and Tindale, N. W.: Aerosols over the Arabian Sea: geochem-istry and source areas for Aeolian desert dust, J. Arid Environ., 39, 477–496, 1998.
Petit, J. R., Briat, M., and Royer, A.: Ice age aerosol content from East Antarctic ice core samples and past wind strength, Nature, 293, 391–394, 1981.
25
Petit, J. R., Mounier, L., Jouzel, J., et al.: Paleo-climatological and chronological implications of the Vostok core dust record, Nature, 343, 56–58, 1990.
Petit, J. R., Jouzel, J., Raynaud, D., et al.: Climate and atmospheric history of the past 420,000 years from the Vostok ice, Antarctica, Nature, 399, 429–436, 1999.
Porter, S. C. and An, Z. S.: Correlation between climate events in the North Atlantic and China
30
during the last glaciation, Nature, 375, 305–308, 1995.
Prospero, J. M.: Eolian transport to the world ocean, in: The Oceanic Lithosphere, The Sea, edited by: Emiliani, C., Wiley, New York, 801–874, 1981.
CPD
2, 233–265, 2006
Past global iron connections Z. S. An et al. Title Page Abstract Introduction Conclusions References Tables Figures J I J I Back Close
Full Screen / Esc
Printer-friendly Version
Interactive Discussion
EGU
Prospero, J. M., Glaccum, R. A., and Nees, R. T.: Atmospheric transport of soil dust from Africa to South America, Nature, 289, 570–572, 1981.
Prospero, J. M. and Savoie, D. L.: Effect of continental sources on nitrate concentration over the Pacific Ocean, Nature, 339, 687–689, 1989.
Pye, K.: The nature, orgin and accumulation of loess, Quat. Sci. Rev., 14, 653–667, 1995.
5
Rea, D.: The paleoclimatic record provided by eolian deposition in the deep sea: The geologic history of wind, Rev. Geophys., 32, 159–195, 1994.
Ridgwell, A. J.: Glacial-interglacial perturbations in the global carbon cycle, Ph.D. thesis, Univ. of East Anglia at Norwich, UK, 2001.
Ruth, U., Wagenbach, D., Steffensen, J. P., et al.: Continuous record of microparticle
concen-10
tration and size distibution in the central Greenland NGRIP ice core during the last glacial period, 108(D3), 4098, doi:10.1029/2002JD002376, 2003.
R ¨othlisberger, R., Bigler, M., Wolff, E. W., et al.: Ice core evidence for the extent of past atmospheric CO2 change due to iron fertilization, Geophys. Res. Lett., 31, 16, doi:10.1029/2004GL020338, 2004.
15
Sarnthein, D., Thiede, J., Pflaumann, U., et al.: Atmospheric and oceanic circulation patterns off Northwest Africa during the past 25 million years, in: Geology of the Northwest African Con-tinental Margin, edited by: Rad, U. V., Hinz, K. M., Sarnthein M., and Seibold E., Springer-Verlag, Berlin, 547–604, 1982.
Satterfield, F. R. and Finney, B. P.: Stable isotope analysis of Pacific salmon: insight into trophic
20
status and oceanographic conditions over the last 30 years, Progress in Oceanography, 53, 231–246, 2002.
Shao, Y. and Leslie, L. M.: Wind erosion prediction over the Australian continent, J. Geophys. Res., 102, 30 091–30 105, 1997.
Smith, H. J., Fischer, H., Wahlen, M., Mastroianni, D., and Deck, B.: Taylor CO2: Dual Modes
25
of the Carbon Cycle Since the Last Glacial Maximum, Nature, 400, 248–250, 1999.
Steffensen, J. P.: The size distribution of microparticles from selected segments of the Green-land Ice Core Project ice core representing different climatic periods, J. Geophys. Res., 102, 26 755–26 763, 1997.
Steig, E., Morse, D. L., Waddington, E. D., et al.: Wisconsinan and Holocene climate history
30
from an ice core at Taylor Dome, western Ross Embayment, Antarctica, Geografiska Annaler, 82A, 213–235, 2000.
CPD
2, 233–265, 2006
Past global iron connections Z. S. An et al. Title Page Abstract Introduction Conclusions References Tables Figures J I J I Back Close
Full Screen / Esc
Printer-friendly Version
Interactive Discussion
EGU
equatorial Pacific seafloor, Paleoceanography, 12, 797–804, 1997.
Sun, Y. B.: Variations of grain size and dust flux for late Cenozoic eolian sediment in the Chinese Loess Plateau, Ph.D. thesis, Institute of Earth Environment, Chinese Academy of Sciences, China, 2000.
Sun, D. H., Shaw, J., An, Z. S., Cheng, M., and Yue, L.: Magnetostratigraphy and Paleoclimatic
5
interpretation of a continuous 7.2 Ma late Cenozoic eolian sediments from the Chinese Loess Plateau, Geophys. Res. Lett., 25, 85–88, 1998b.
Thompson, L. G., Davis, M. E., Mosley-Thompson, E., et al.: A 25,000-year tropical climate history from Bolivian ice cores, Science, 282, 1858–1864, 1998.
Thompson, L. G. and Mosley-Thompson, E.: Microparticle concentration variations linked with
10
climatic change: evidence from polar ice, Science, 212, 812–815, 1981.
Thompson, L. G., Mosley-Thompson, E., Davis, M. E., et al.: Late-glacial stage and Holocene tropical ice core records from Huascaran, Peru, Science, 269, 46–50, 1995.
Watanabe, O., Fujii, Y., Kamiyama, K., et al.: Basic analyses of Dome Fuji Deep Ice Core part 1: Stable oxygen and hydrogen isotope ratios, major chemical compositions and dust
15
concentration, Polar Meteorology and Glaciology, 13, 83–89, 1999.
Watson, A. J., Bakker, D. C. E., Ridgwell, A. J., et al.: Effect of iron supply on Southern Ocean CO2 uptake and implications for glacial atmospheric CO2, Nature, 407, 730–733, 2000. Watson, A. J., Bakker, D. C. E., Ridgwell, A. J., Boyd, P. W., and Law, C. S.: Effect of iron supply
on Southern Ocean CO2 uptake and implications for glacial atmospheric CO2, Nature, 407,
20
730–733, 2000.
Weber, M. E. and Pisias, N. G.: Spatial and temporal distribution of biogenic carbonate and opal in deep-sea sediments from the eastern equatorial Pacific: implications for ocean history since 1.3 Ma, Earth Planet. Sci. Lett., 174, 59–73, 1999.
Yuan, D. X., Chen, H., Lawrence, E. R., et al.: Timing, duration of last interglacial Asian
mon-25
soon, Science, 304, 575–578, 2004.
Yung, Y. L., Lee, T., Wang, C. H., et al.: Dust: A diagnostic of the hydrologic cycle during the last glacial maximum, Science, 271, 962–963, 1996.
Zhang, X. Y., An, Z. S., Chen, T., et al.: Late quaternary records of the atmospheric input of eolian dust to the center of the Chinese Loess Plateau, Quat. Geology, 41, 35–43, 1994.
30
Zhang, X. Y., Gong, S. L., Zhao, T. L., et al.: Sources of Asian dust and role of climate change versus desertification in Asian dust emission, Geophys. Res. Lett., 30, 2272, doi:10.1029/2003GL018206, 2003.
CPD
2, 233–265, 2006
Past global iron connections Z. S. An et al. Title Page Abstract Introduction Conclusions References Tables Figures J I J I Back Close
Full Screen / Esc
Printer-friendly Version
Interactive Discussion
EGU
Zhang, X. Y., Arimoto, R., and An, Z. S.: Dust emission from Chinese desert sources linked to variations in atmospheric circulation, J. Geophys. Res., 102, 28 041–28 047, 1997.
CPD
2, 233–265, 2006
Past global iron connections Z. S. An et al. Title Page Abstract Introduction Conclusions References Tables Figures J I J I Back Close
Full Screen / Esc
Printer-friendly Version
Interactive Discussion
EGU (a) dust sources
(b) dust flux
Figure 1
Fig. 1. The modern location of dust sources, transport paths and deposition zones. (a) Modern dust source regions and wind trajectories reconstructed from observations of dust storms after Livingstone and Warren (1996);(b) global fluxes mg/m2year of mineral aerosols to the ocean after Duce et al. (1991).
CPD
2, 233–265, 2006
Past global iron connections Z. S. An et al. Title Page Abstract Introduction Conclusions References Tables Figures J I J I Back Close
Full Screen / Esc
Printer-friendly Version Interactive Discussion EGU 130 120 110 100 90 80 70 60 50 40 30 20 10 0 30 20 10 0 60 50 40 30 20 10 0 30 20 10 0 30 20 10 0 Dust fluxes (mg.cm-2.ka-1) Dust fluxes (mg.cm-2.ka-1) Dust fluxes (mg.cm-2.ka-1) Dust fluxes (mg.cm-2.ka-1) Age ( k y r)
Po Tou Heimugou Zhao Jiachuan LingTai
Figure 2
Fig. 2. Dust flux variations in Chinese Loess Plateau since the last interglaciation. Lingtai profile from our paleo-data; Zhaojiachuan profile from Sun et al. (2001); Potou profile from An et al. (1991); and Heimugou profile from Zhang et al. (1994). The dust flux of Zhaojiachuan and Potou profiles were calculated by a method put forward by An et al. (1991), whereas the dust flux of other two profiles were followed a method by Zhang et al. (1994).
CPD
2, 233–265, 2006
Past global iron connections Z. S. An et al. Title Page Abstract Introduction Conclusions References Tables Figures J I J I Back Close
Full Screen / Esc
Printer-friendly Version Interactive Discussion EGU 4 0 120 100 80 60 40 20 0 14 7 75 60 45 24 16 8 240 160 240 160 0.2 0.1 6 3 018 12 6 0 H3571 NGC108 S-2 C4402 W84 R13 PS24495 V22-108 RC13-254 Ag e (kyr) MAROC (mg cm-2 kyr-1) MAROC (mg cm-2kyr-1) MAROPAL (mg cm-2kyr-1) MAROC g cm-2yr-1 MAROC mmol m-2yr-1 231Pa ex/230Thex MAROC (mg cm-2kyr-1) MAROC g cm-2yr-1 MAROC mmol m-2yr-1
North Pacific Equatorial Pacific South Ocean
(34o54’N,179o42’E) (36o36’N,158o20’E) (33o21’N,159o07’E) (2o58’N,135o01’E) (46o30’S,15o20’W ) (43o11’S,3o15’W ) (48o34’S,5o07’W) Glacial period Glacial period F
Fig. 3. Variations of paleoproductivity recorded at 9 marine cores in 3 major HNLC regions. H3571 from Kawahata et al. (2000); NGC108 from Maeda et al. (2002); S-2 from Masayuki (2003); C4402 from Kawahata (1999); W83 and R13 from Beaufort et al. (2001), PS2449-5 from Asmus et al. (1999); V22-108 and RC13-254 from Anderson et al. (1998).
CPD
2, 233–265, 2006
Past global iron connections Z. S. An et al. Title Page Abstract Introduction Conclusions References Tables Figures J I J I Back Close
Full Screen / Esc
Printer-friendly Version Interactive Discussion EGU 0 10 20 30 40 50 60 70 80 90 100 110 120 130 25 20 15 10 0.9 0.8 0.7 0.6 0.5 0.4 0.3 0.2 7 6 5 4 3 2 1 0 180 200 220 240 260 280 300 106 105 104 Dust flu x /g.cm -2 .k a -1 Age/kyr Ir on f lux/ g .c m -2 .ka -1 MAR TO C /m g.cm -2 .ka -1 N u mb er ( cou nt ) CO 2 /P .P .M .V . Figure 4 4
Fig. 4. Correlations between Asian dust and iron fluxes recorded in Lingtai loess profile, dust particulate counts of GRIP ice core, paleoproductivity represented in MARTOC variations of H3571 core of northern Pacific ocean, and atmospheric CO2recorded in Vostok ice core during the last 130 kyr.
CPD
2, 233–265, 2006
Past global iron connections Z. S. An et al. Title Page Abstract Introduction Conclusions References Tables Figures J I J I Back Close
Full Screen / Esc
Printer-friendly Version Interactive Discussion EGU ppbv count Karluk δ 15N ( ‰ )
Dust storm frequency in China (Zhang et al., 1984) Fisheries productivity in the northeastern Pacific (Finney et al., 2002) Atmospheric CO2 (Etheridge et al., 1996) 275 280 285 800 1000 1200 1400 1600 1800 2000 0 5 -3 0 3 year Figure 5
Fig. 5. Correlations of dust storm events in China and fisheries productivity variations in the northeastern Pacific Ocean with CO2changes during the last 1800 years. (a) Dust storm fre-quency in China (Zhang et al., 1984). (b) Fisheries productivity in the northeastern Pacific Ocean (Finney et al., 2002). (c) Atmospheric CO2 concentration data are from Etheridge et al. (1996) after 1000 A.D.; data before 1000 A.D. are from Inderm ¨uhle et al. (1998). An atmo-spheric CO2was apparently increased since the late 18 century, which was mainly influenced by anthropogenic activities. The rest data of CO2is not included.
CPD
2, 233–265, 2006
Past global iron connections Z. S. An et al. Title Page Abstract Introduction Conclusions References Tables Figures J I J I Back Close
Full Screen / Esc
Printer-friendly Version Interactive Discussion EGU 0.8 1.6 1965 1970 1975 1980 1985 1990 8 10 12 10 11 kg δ 15 N ( ‰ ) 1 1 2 2 3 3 4 4 5 5 6 6 7 7 b a year Figure 6
Fig. 6. A comparison between dust emission in Asia (a) (Zhang et al., 2003), fisheries produc-tivity(b) reflected by δ15N of Pacific salmon (Satterfield and Finney, 2002) in the Pacific Ocean from 1965 to 1990. 7 peaks can be matched respectively. 2–3 years lag of peaks can be seen in δ15N curve.