HAL Id: hal-00503211
https://hal.archives-ouvertes.fr/hal-00503211
Submitted on 16 Jul 2010
HAL is a multi-disciplinary open access
archive for the deposit and dissemination of
sci-entific research documents, whether they are
pub-lished or not. The documents may come from
teaching and research institutions in France or
abroad, or from public or private research centers.
L’archive ouverte pluridisciplinaire HAL, est
destinée au dépôt et à la diffusion de documents
scientifiques de niveau recherche, publiés ou non,
émanant des établissements d’enseignement et de
recherche français ou étrangers, des laboratoires
publics ou privés.
A few days before the end of the 2008 extreme outburst
of EX Lup : accretion shocks and a smothered stellar
corona unveiled by XMM-Newton
Nicolas Grosso, Kenji Hamaguchi, Joel Kastner, Michael Richmond, David
Weintraub
To cite this version:
Nicolas Grosso, Kenji Hamaguchi, Joel Kastner, Michael Richmond, David Weintraub. A few days
before the end of the 2008 extreme outburst of EX Lup : accretion shocks and a smothered stellar
corona unveiled by XMM-Newton. Astronomy and Astrophysics - A&A, EDP Sciences, 2010, 522,
pp.A56. �10.1051/0004-6361/200913850�. �hal-00503211�
Astronomy & Astrophysicsmanuscript no. EX˙Lup˙XMM˙2008˙final˙printer.hyper26290 ESO 2010c July 16, 2010
A few days before the end of the 2008 extreme outburst of EX Lup :
accretion shocks and a smothered stellar corona
unveiled by XMM-Newton
N. Grosso
1, K. Hamaguchi
2, J. H. Kastner
3, M. Richmond
3, and D. A. Weintraub
41 Observatoire Astronomique de Strasbourg, Universit´e de Strasbourg, CNRS, UMR 7550, 11 rue de l’Universit´e, F-67000 Strasbourg, France
e-mail: nicolas.grosso@astro.unistra.fr
2 NASA/Goddard Space Flight Center, Greenbelt, Maryland 20771, USA 3 Rochester Institute of Technology, Rochester, New York 14623-5604, USA 4 Vanderbilt University, Nashville, Tennessee 37235, USA
Received 10 December 2009 / Accepted 21 June 2010
ABSTRACT
Context.EX Lup is a pre-main sequence star that exhibits repetitive and irregular optical outbursts driven by an increase in the mass accretion rate in its circumstellar disk. In mid-January 2008, EX Lup, the prototype of the small class of eruptive variables called EXors, began an extreme outburst that lasted seven months.
Aims.We attempt to characterize the X-ray and UV emission of EX Lup during this outburst.
Methods.We observed EX Lup during about 21 h withXMM-Newton, simultaneously in X-rays and UV, on August 10–11, 2008 – a few days before the end of its 2008 outburst – when the optical flux of EX Lup remained about 4 times above its pre-outburst level. Results.We detected EX Lup in X-rays with an observed flux in the 0.2–10 keV energy range of 5.4 × 10⁻¹⁴erg s−1cm−2during a low-level period. This observed flux increased by a factor of four during a flaring period that lasted about 2 h. The observed spectrum of the low-level period is dominated below ∼1.5 keV by emission from a relatively cool plasma (∼4.7 MK) that is lightly absorbed (NH ≃ 3.6 × 1020cm−2) and above ∼1.5 keV by emission from a plasma that is ∼ten times hotter and affected by a photoelectric absorption that is 75 times larger. The intrinsic X-ray luminosity of the relatively cool plasma is ∼ 4 × 1028 erg s−1. The intrinsic X-ray luminosity of EX Lup, ∼ 3.4 × 1029erg s−1, is hence dominated by emission from the hot plasma. During the X-ray flare, the emission measure and the intrinsic X-ray luminosity of this absorbed plasma component is five times higher than during the low-level period. We detected UV variability on timescales ranging from less than one hour up to about four hours. We show from simulated light curves that the power spectral density of the UV light curve can be modeled with a red-noise spectrum with a power-law index of 1.39 ± 0.06. None of the UV events observed on August 10–11, 2008 correlate unambiguously with simultaneous X-ray peaks. Conclusions.The soft X-ray spectral component is most likely associated with accretion shocks, as opposed to jet activity, given the absence of forbidden emission lines of low-excitation species (e.g., [O i]) in optical spectra of EX Lup obtained during outburst. The hard X-ray spectral component, meanwhile, is most likely associated with a smothered stellar corona. The UV emission is reminiscent of accretion events, such as those already observed with the Optical/UV Monitor from other accreting pre-main sequence stars, and is evidently dominated by emission from accretion hot spots. The large photoelectric absorption of the active stellar corona is most likely due to high-density gas above the corona in accretion funnel flows.
Key words.X-rays: stars – stars: individual: EX Lup – stars: pre-main sequence, coronae, activity – accretion
1. Introduction
Young, low-mass stars that accrete material through their cir-cumstellar disks can exhibit dramatic increases in brightness in the optical. These erupting pre-main sequence (PMS) stars are classified as FUors and EXors, named after the prototypes FU Ori and EX Lup. FUors exhibit a single (observed) ma-jor increase in brightness (≥4–5 mag), occurring perhaps once per century or only a few times over the PMS lifetime of the star, with a decay timescale of 10–100 yr (Herbig 1966,
1977a; Hartmann & Kenyon 1996). The characteristics of the EXor class are dominated by what is known about the proto-type, namely, that the outbursts of EX Lup are repetitive and irregular, occurring perhaps every few decades, with a decay timescale of a few months to a few years (Herbig 1989,2008).
Send offprint requests to: N. Grosso
In PMS stars, the typical rates of mass accretion are lower than ∼10−7M
⊙yr−1, but, because of thermal instability, may jump to
∼10−6–∼10−4 M
⊙yr−1, producing an FUor-type or EXor-type
optical outburst (Hartmann & Kenyon 1996).
Although luminous X-ray emission is characteristic of PMS stars (see reviews of Feigelson & Montmerle 1999 and
G¨udel & Naz´e 2009), there exist very few observations of high-energy (UV through X-ray) radiation from FUors or EXors in outburst. AnXMM-Newtonobservation of FU Ori itself shows the cool (∼ 8 MK) and hot (≥ 58 MK) plasma components usually detected in T Tauri stars (Preibisch et al. 2005), but the absorption toward the hot plasma component is at least 10 times larger than the optical extinction (Skinner et al. 2006). The observed X-ray flux is dominated by the hot plasma com-ponent, which is evidently due to magnetic activity. However,
Skinner et al. (2006) contend that the temperature of the cool component is too high to be caused by accretion shocks.
An XMM-Newton observation of the FUor V1735 Cyg de-tected a hard X-ray spectrum from a hot (≥ 58 MK) plasma (Skinner et al. 2009). In these two FUors, the high temperature of the hot plasma component indicates that the X-ray emission is dominated by magnetic processes. Pre-outburst observations of these FUors in X-rays are not available, hence we are unable to assess the impact of the accretion outburst on their X-ray emis-sion.
In late 2003, V1647 Ori, a young, low-mass star deeply embedded in the L1630 cloud in Orion (d ∼ 400 pc) bright-ened suddenly, illuminating McNeil’s nebula. V1647 Ori is the first PMS star to have been observed in X-rays, before, during, and after a major mass-accretion episode (Kastner et al. 2004,
2006b; Grosso et al. 2005;Grosso 2006).Chandraand XMM-Newtonobservations demonstrate that the sharp increase in X-ray flux post-outburst relative to pre-outburst closely tracked that of the optical/IR brightness increase of V1647 Ori. The X-ray mean flux of V1647 Ori follows the optical/IR decline of the outburst, but enhanced variability on timescales of less than a day was also observed in X-rays. These results appear to be most accurately explained by star-disk magnetic reconnection events that were generated in association with this major mass-accretion episode. V1647 Ori returned to near pre-outburst levels only by late 2005, and was reported to flare again in the optical in late August, 2008 (Itagaki et al. 2008). A new snapshot mon-itoring with Chandra (Cycle 10; D. A. Weintraub, PI) caught the overall rise/fall shape of this new X-ray outburst (Teets et al. 2010a, in preparation). A Suzaku observation in October 2008 detected strong fluorescent iron line emission that was not present during the 2003–2005 outburst. The structure of the cir-cumstellar gas very close to the stellar core that absorbs and re-emits X-ray emission from the central object may have changed between 2005 and 2008 (Hamaguchi et al. 2010).
The EXor candidate V1118 Ori, a young low-mass star in the Orion Nebula (d ∼ 400 pc), displayed a mass accretion out-burst from 2005 to 2006. Follow-up observations of this object detected a moderate enhancement in the X-ray flux that was correlated with the optical/IR flux (Audard et al. 2005, 2010;
Lorenzetti et al. 2006).
The Herbig Be/FUor binary star Z CMa exhibited in 2008– 2009 the largest optical outburst reported during the almost 90 years of available observations. The FUor component is respon-sible for this optical outburst and the X-ray emission of Z CMa. However, no changes in the stellar X-ray properties of the FUor component were seen during this optical outburst (Stelzer et al. 2009).Szeifert et al.(2010) show that the bolometric luminos-ity of Z CMa remained surprisingly constant during this optical outburst and conclude that the increase in luminosity was caused by a decrease in extinction.
In contrast to the previous results, a Chandra observation was unable to detect the outburst source that illuminates the new nebula associated with IRAS 04376+5413 in LDN 1415, located at d ∼ 170 pc (Kastner et al. 2006a; Stecklum 2006;
Stecklum et al. 2007).
Given the variety of behavior observed during PMS star outbursts, additional monitoring of PMS star outbursts is es-sential. We are conducting such a monitoring campaign of po-tential FUor and/or EXor outbursts, by means of coordinated XMM-Newton andChandra target of opportunity (ToO) pro-grams. Here, we report on UV/X-ray observations of EX Lup ob-tained via ourXMM-NewtonToO program.
EX Lup is located between the star-forming clouds Lupus 3 and 4 (see review on the Lupus clouds of Comer´on 2008), at a distance of 155 ± 8 pc (Lombardi et al. 2008). It has a normal
brightness of V = 13.2 mag (Herbig 2007) and a M0V spectral type (Herbig 1977b). In 1955, the visual observations of A. F. Jones helped to infer that EX Lup had experienced a major out-burst with a peak magnitude of V = 8.4 mag (Herbig 1977a). During the 1993–2005 period, eight outbursts not brighter than
V = 11 mag were observed (Herbig et al. 2001;Herbig 2007).
Jones (2008a) announced that EX Lup was again in outburst with onset in mid-January 2008. Follow-up visual observations showed that in early February 2008 EX Lup reached a peak
V-band luminosity of ∼8 mag, making this last outburst the
brightest ever observed from EX Lup (Jones 2008b;K´osp´al et al. 2008). On the basis ofSpitzerspectroscopy obtained before and during outburst,Abrah´am et al.´ (2009) claim that heat from this bright outburst transformed, via thermal annealing, amorphous silicate dust in the surface layer of the inner accretion disk of EX Lup into crystalline form (namely, forsterite). They propose that interstellar (amorphous) dust within the protosolar nebula was transformed into crystalline silicate grains present in comets and meteorites during these accretion outbursts.
The 2008 optical outburst of the EXor prototype EX Lup triggered our (anticipated) ToO observations with Chandra (Cycle 9; D. A. Weintraub, PI). This Chandra mon-itoring of EX Lup with snapshots showed that EX Lup was relatively X-ray bright in March 25, 2008, and had then faded by a factor of three by June 16, 2008, and by another factor of about two by October 2008. The changes in X-ray brightness appear to correlate in a meaningful way with the optical/IR fluxes, which strongly suggests that the level of X-ray production above qui-escence for this star is generated by the same physical process that produced the optical eruption, i.e., mass accretion (Teets et al. 2010b, in preparation). The positive detection of EX Lup in X-rays with Chandra allowed us to trigger a long-exposure observation with XMM-Newton (AO-7; N. Grosso, PI) to perform X-ray CCD spectroscopy and to investigate X-ray and UV variability on a timescale of about one day that we report here. We describe in Sect.2theXMM-Newtonobservation and our reduction of these data. We present our results in Sect.3, discuss them further in Sect. 4, and offer our conclusions in Sect. 5. We describe in detail our reduction of the Optical/UV Monitor data in AppendixA.
2. XMM-Newton observation and data reduction
2.1. Observing period
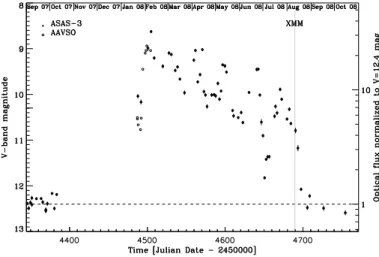
The 78 ks exposure was scheduled at the very beginning of the Summer visibility window of EX Lup (XMM-Newton revolu-tion 1588), on August 10–11, 2008. This observing period is shown in the context of the 2008 extreme outburst of EX Lup in Fig.1.
For the V-band data plotted in Fig.1, we selected only mea-surements with error bars from the American Association of Variable Star Observers (AAVSO)1and from the ASAS-3
pho-tometric catalog2 of the All Sky Automated Survey (ASAS; Pojmanski 2002). We estimated the pre-outburst optical level of EX Lup using the median of V measurements obtained on Sep.– Oct. 2007, just before the conjunction of EX Lup with the Sun. We found that V ≃ 12.4 mag, which is above its normal bright-ness of V = 13.2 mag (Herbig 2007). EX Lup returned to this pre-outburst optical level on late August, 2008.
1 See the AAVSO site athttp://www.aavso.org.
2 The ASAS-3 photometric catalog is available at http://www.astrouw.edu.pl/asas/.
N. Grosso et al.: accretion shocks and a smothered stellar corona unveiled by XMM-Newton
Fig. 1. V-band light curve of EX Lup. Filled and empty circles are V-band magnitudes of EX Lup from the All Sky Automated Survey (ASAS-3) and the American Association of Variable Star Observers (AAVSO), respectively. The horizontal dashed line is the pre-outburst optical level. The right y-axis gives the optical flux in pre-outburst flux units. The grey stripe at JD ≃ 2454690 identifies theXMM-Newtonobserving period in August 2008.
Figure1shows that ourXMM-Newtonobservation was ob-tained only a few days before the end of the 2008 outburst, but that EX Lup was clearly still in an elevated state during the ob-servation. Ten hours after the end of theXMM-Newton obser-vation, EX Lup was observed by the ASAS at V = 10.79 ± 0.06 mag. For comparison, this optical level is as bright as the peak of the brightest outburst of the 1993–2005 period that was observed on August, 2002, and 4.4 times above its 2008 pre-outburst optical level.
2.2. Instrumental setup
The prime instrument was EPIC, with pn (Str¨uder et al. 2001) and the two MOS (Turner et al. 2001), used in the full frame science mode with the medium optical blocking filter.
The Optical/UV Monitor (OM;Mason et al. 2001) was used in the default fast mode with the UVM2 filter (covering the wavelength band from 205 to 245 nm, with an effective wave-length of 231 nm), which allowed us to image a 17′× 17′
field-of-view and obtain for EX Lup fifty UV event lists (1200 s observations separated by gaps of 321.6 s due to overhead time). Because, during our OM observation, no good guide stars were found, we were unable to use theXMM-NewtonScience Analyzing System (SAS)3 to correct the UV event lists of EX Lup for spacecraft drifts. We present in Appendix A the method we used to correct the OM fast-mode light curve for spurious features caused by spacecraft drifts.
2.3. Target identification
The pipeline data products (PPS) provide correlations of EPIC sources in our observation with archival catalogs. The EPIC source XMMU 160305.5-401825, with a positional uncertain-ties of 1.′′56 (including a 1.′′50 systematic error), is located only 0.′′7 from the coordinate position of 2MASS J16030548-4018254 (=EX Lup). Therefore, this EPIC source is the X-ray counterpart of EX Lup. The closest neighboring X-ray source
3 Seehttp://xmm.esac.esa.int/external/xmm data analysis/.
detected byXMM-Newtonis located at a distance of 2.′3 from the EX Lup source. The Cycle 9 Chandra images show that the closest X-ray source to EX Lup is a faint object located at a distance of 44′′. Therefore, the X-ray and UV flux from
XMMU 160305.5-401825 are not contaminated by flux from any nearby source.
From the PPS list of OM sources detected in the 17′× 17′
field-of-view, we correlated the positions of OM sources of a signal-to-noise ratio (S/N) greater than 3.5 with the positions of 2MASS sources4, which corrects the OM source positions for a
small pointing offset (∆α = 1.′′6 ± 0.′′2 and ∆δ = −2.′′7 ± 0.′′2),
leading to a position uncertainty of 0.′′3. We find a bright UV source located only 0.′′3 from 2MASS J16030548-4018254.
Therefore, this OM source is the UV counterpart of EX Lup. 2.4. Data reduction
The data were reprocessed and analyzed using the SAS (version 9.0) following standard procedures5. Source plus background
X-ray events6. were extracted within a circular region centered on EX Lup that had been optimized to maximize the S/N (which gives a 14′′radius for pn). The background X-ray events located on the same CCD were extracted using an annular region cen-tered on EX Lup. We applied to the X-ray light curve of each camera both relative corrections (dead time, GTIs, exposure, background counts) and absolute corrections (vignetting, bad pixels, chip gaps, PSF, quantum efficiency) with the SAS task epiclccorr. Therefore, we report the count rates that would have been detected if the X-ray events had been collected with an infinite extraction radius.
All the EPIC spectra presented here were binned to at least 15 counts per spectral bins. Spectral modeling was performed with XSPEC (version 12.5.1;Dorman & Arnaud 2001). We used X-ray spectra from optically-thin plasmas in collisional ioniza-tion equilibrium, which include continuum and emission line output from the Astrophysical Plasma Emission Code7(vapec model in XSPEC). We adopted the abundance pattern of the XMM-Newton Extended Survey of the Taurus molecular cloud (XEST;G¨udel et al. 2007a), which we take to be the typical el-emental abundances of the coronae of young stars, as measured with grating X-ray spectroscopy8. We combined these emission spectra with photoelectric absorption using the XSPEC model wabs, which is based on the photo-ionization cross sections ofMorrison & McCammon(1983) and the solar abundances of
Anders & Ebihara(1982). 2.5. Effective exposure
This observation was affected by bad space weather (Fig.2). In particular, the last 3 ks of the exposure were strongly affected by
4 We use the SAS task eposcorr.
5 See SAS threads at http://xmm.esac.esa.int/sas/current-/documentation/threads/.
6 For PN, we selected only single and double pixel events (i.e.,
PATTERNin the 0 to 4 range) with FLAG value equal to zero. For MOS, we selected single, double, triple, and quadruple pixel events (PATTERN in the 0 to 12 range), and used the FLAG list #XMMEA SM, which is ad-vised for accurate spectral analysis (see the SAS taskemchain)
7 For more informations on APEC, see http://hea-www.harvard.edu-/APEC .
8 The abundance pattern of the XEST (G¨udel et al. 2007a) is : C=0.45, N=0.788, O=0.426, Ne=0.832, Mg=0.263, Al=0.5, Si=0.309, S=0.417, Ar=0.55, Ca=0.195, Fe=0.195, and Ni=0.195 (with respect to the solar photospheric abundances ofAnders & Grevesse 1989).
Fig. 2. Flaring-background light curve in the pn detector dur-ing ourXMM-Newtonobservation of EX Lup. The line is the background light curve produced by the SAS task epchain. The horizontal dashed line indicates the maximum level of flaring-background for our spectral analysis. The resulting time periods with low flaring-background are shown in grey. The vertical dot-ted line indicates the end of the useful exposure.
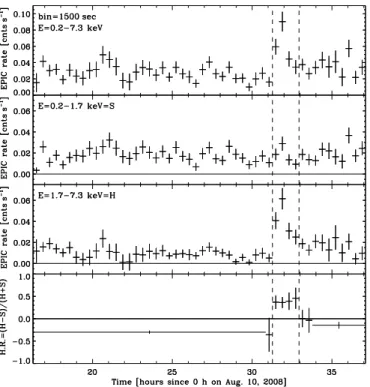
Fig. 3.XMM-Newton/EPIC background-subtracted X-ray light curves of EX Lup. The top panel shows the EPIC (pn+MOS1+MOS2) X-ray light curve of EX Lup in the en-ergy band from 0.2 to 7.3 keV.The middle panelsshow the soft (S=0.2–1.7 keV) and hard (H=1.7–7.3 keV) band X-ray light curves. The bin size of the X-ray light curves is 1500 s. The bottom panelshows the variation of the corresponding hardness ratio. The vertical dashed lines bracket the source flaring period.
highly elevated flaring-background. Therefore, we did not use EPIC data obtained on August 11, 2008 after about 13:00 (i.e., after about 37 h in Fig.2).
For the time variability study presented in Sect. 3.1, this XMM-Newtonobservation with an effective exposure of ∼ 74 ks is the longest continuous X-ray (and UV) observation that was obtained during this optical outburst of EX Lup.
For the spectral analysis presented in Sect. 3.2, we sup-pressed time intervals with flaring background rate above 8.0 pn count ks−1arcmin−2, which reduces the effective exposure for the pn spectrum to only ∼22 ks (see time periods shown in grey in Fig.2).
3. Results
3.1. X-ray variability
To limit the background, we concentrated our variability anal-ysis on the energy range from 0.2 keV to 7.3 keV. We divided this energy range into soft (S, 0.2–1.7 keV) and hard (H, 1.7– 7.3 keV) bands to allow a hardness ratio study using the formula
HR = (H − S )/(H + S ). We used 1500 s for the bin size of the
X-ray light curves of each camera to ensure that each time bin has a positive count rate in at least one of the three cameras. We replaced the negative count rates by zero.
Figure3shows the background-subtracted X-ray light curves of EX Lup obtained by adding the pn, MOS1, and MOS2 light curves. During the first two-thirds of the observation, EX Lup exhibited a low level of activity, with amplitude varia-tion of about 0.02 EPIC counts s−1around an average count rate
of about 0.03 EPIC counts s−1. Then, just after 31.2 h, as shown in the top panel of Fig.3, we observed a rapid increase in the count rate that peaked at ∼3 times the average low-level count rate, before decaying to the pre-outburst level at the end of the observation. This last, decay phase, occurring just after 33 h, was strongly affected by the highly elevated background. The source flare-like event was detected mainly in the hard band, and was the only clear variability detected in this energy band. There was also a possible fainter second source flare-like event seen in both the hard and soft X-ray bands around 20.5 h, but this time inter-val was strongly affected by a large flaring background; there-fore, we cannot conclude definitively that EX Lup experienced two flares, though it certainly experienced only one bright flare peaking above 0.07 count s−1 during this 74 ks observing
win-dow.
The bottom panel of Fig.3shows that the hardness ratio is soft during the low-level period, hard during the main period of the source flare lasting about 6.5 ks (see vertical dashed lines in Fig.3), and returns to softer values during the decay phase and the end of the observation. We conclude that this variability and this hardening is characteristic of an X-ray flare from EX Lup.
For the pn, MOS1, and MOS2 light curves in the soft band, we applied a Kolmogorov-Smirnov (KS) test9 to
estab-lish whether the variations are consistent with Poisson noise that is associated with a constant source. For each of the three light curves, we found a KS-test probability below 0.001, which indi-cates a reliable level of soft-band variability (e.g.,Getman et al. 2005).
3.2. Time-dependent X-ray spectral analysis
The MOS spectra of EX Lup are very faint hence cannot be used to provide useful constraints from spectral modeling; the spec-tral modeling results we present were therefore obtained exclu-sively from the pn spectra. We first performed X-ray modeling of the data from the low-level period of our observation, before the source flare that began at 31.2 h (see vertical dashed lines in Fig. 3); this low-level period has a low flaring-background exposure time of 18.6 ks (see Fig. 2). The top panel of Fig.4 shows the spectrum of the low-level period. It is dominated by soft emission that peaks around 0.7 keV, which suggests that the emission below ∼1.5 keV originates in a relatively cool plasma. X-rays were detected at energies as low as 0.2 keV, which indi-9 We used the ftools task lcstats (xronos subpack-age). ftools is available at http://heasarc.nasa.gov/-lheasoft/ftools/ftools menu.html.
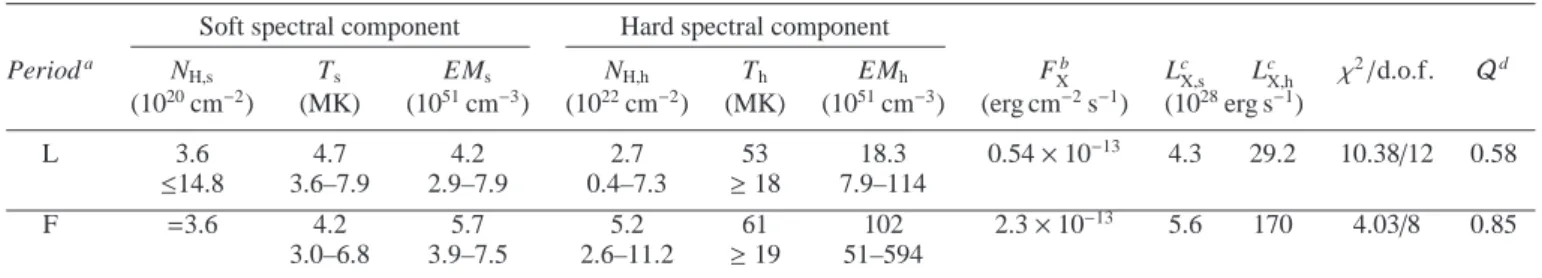
N. Grosso et al.: accretion shocks and a smothered stellar corona unveiled by XMM-Newton Table 1. Physical parameters of the X-ray emission from EX Lup obtained by spectral fitting of the pn data.
Soft spectral component Hard spectral component
Perioda N H,s Ts EMs NH,h Th EMh FXb L c X,s L c X,h χ 2/d.o.f. Qd (1020cm−2) (MK) (1051cm−3) (1022cm−2) (MK) (1051cm−3) (erg cm−2s−1) (1028erg s−1) L 3.6 4.7 4.2 2.7 53 18.3 0.54 × 10⁻¹³ 4.3 29.2 10.38/12 0.58 ≤14.8 3.6–7.9 2.9–7.9 0.4–7.3 ≥ 18 7.9–114 F =3.6 4.2 5.7 5.2 61 102 2.3 × 10⁻¹³ 5.6 170 4.03/8 0.85 3.0–6.8 3.9–7.5 2.6–11.2 ≥ 19 51–594
Notes: The model used for the photoelectric absorption is wabs. The model used for the continuum and emission lines produced by an optically thin plasma in thermal collisional ionization equilibrium is vapec, using the abundance pattern of theXMM-Newton Extended Survey of the Taurus molecular cloud (XEST;G¨udel et al. 2007a). The second line of each period corresponds to the confidence intervals at the 90% confidence level (i.e., ∆χ2= 2.706 for each parameter of interest).
a The low-level and the flaring period are labeled L and F, respectively. b Observed X-ray flux in the 0.2–10 keV energy range.
c X-ray luminosity corrected for the absorption in the 0.2–10 keV energy range, at a distance of 155 pc (Lombardi et al. 2008).
d The Q-value is the probability that one would observe the chi-square value, or a larger value, if the assumed model is true, and the best-fit model parameters are the true parameter values.
Fig. 4. pn spectra of EX Lup. Top panel: low-level emission. Bottom panel:flaring emission. The continuous, dashed and dot-ted lines are the best model of the whole spectrum, and the soft and hard components (see Table1), respectively. The residuals of the fit (in sigma units) are shown in the bottom sections of each panel.
cates that the photoelectric absorption is low, for energies as low as 10 keV.
A single-component model consisting of thermal plasma emission combined with a very low photoelectric absorption provided a poor fit (χ2 = 27.84 for 15 degrees of freedom) and
can be statistically rejected (i.e., the probability that the best-fit model matches the data, Q = 0.023, is lower than 0.05).
When we added a second plasma component to the model of the flux during the low-level period, where both components were affected by the same photoelectric absorption, we obtained a statistically acceptable fit (χ2 = 15.86 for 13 degrees of free-dom, corresponding to Q = 0.26)10. However, the best-fit value for the hot plasma temperature corresponds to the highest tem-perature available in vapec and the resulting lower limit of 175 MK is too high for a PMS star (e.g.,Preibisch et al. 2005). Moreover, the residuals of the fit show a dip in the 1.2–2.0 keV energy range and an excess in the 2.0–5.0 keV energy range, suggesting that the modeling could be improved. We conclude that the spectral shoulder above ∼1.5 keV prevents us from ob-taining any satisfactory model fit to the full spectrum during the low-level period if the model includes a single value for the ab-sorbing column density for both plasma components.
Hence, to simultaneously fit both the soft and hard spec-tral components, we introduced a second absorber (hydrogen column densities, NH,s and NH,h, for the soft and hard spectral components, respectively). Procedurally, we first fitted the spec-trum at energies below 1.5 keV, thereby obtaining best-fit values for NH,s, the plasma temperature (Ts), and the emission mea-sure (E Ms) for the soft spectral component. Fixing these best-fit model parameters, we then fitted the whole spectrum, and ob-tained best-fit values for model parameters (NH,h, Th, E Mh) for the hard spectral component. Using these six best-fit parameters as initial conditions, we then fit the whole spectrum, allowing all the parameters vary. With these initial conditions, the model parameters varied only slightly and provided to a good fit (first line of Table 1). Using the F-test, we verified that adding this second absorber increases the goodness-of-fit at the 5% signifi-cance level. The soft spectral component is modeled with lightly absorbed (NH,s ≃ 3.6 × 1020 cm−2) emission from a 4.7 MK
10 The best-fit model parameters are : a very low photoelectric absorp-tion of 6.0 × 1020cm−2(1.7 × 10²⁰–21 × 1020cm−2 at the 90% confi-dence level); a relatively cool plasma with a temperature of 3.8 MK (2.6–6.2 MK) and an emission measure of 2.8 × 1051cm−3( 1.2 × 1051– 15.6 × 1051cm−3); and a very hot plasma with a temperature of 794 MK (≥ 175 MK) and an emission measure of 8.1 × 1051cm−3( 5.4 × 1051– 10.1 × 1051cm−3
plasma. The hard spectral component is modeled with emis-sion from a 53 MK plasma affected by much larger absorption (NH,s ≃ 2.7 × 1022 cm−2). The X-ray luminosities of the soft and the hard components, after correcting for absorption, are ∼ 4.3 × 1028and ∼ 29.2 × 1028 erg s−1, respectively. Therefore,
the intrinsic X-ray emission of EX Lup is dominated by emission from the hotter plasma.
The bottom panel of Fig.4 shows the spectrum during the flaring period, from 31.2 to 33.0 h of the whole exposure of ∼6.5 ks (Fig.3). The shape of the spectrum during the flare in-corporates both soft and hard spectral components, with some similarity but also significant differences in overall shape from the spectrum obtained during the low-level period. The great-est difference between the flare and low-level spectra is the greater prominence of the hard component during the flare. As for the low-level emission, a model of the flare period spectrum in which both temperature components are subject to the same absorbing column fails. Such a model again cannot fit the data in the 1.2–2.0 and 2.0–5.0 keV energy ranges, and results in an unrealistically high value for the temperature of the hot compo-nent. Therefore, we used a model for which both plasma com-ponents were affected by different photoelectric absorption when fitting the flare spectrum; however, the statistics of the soft spec-tral component during the flare are very poor, due to the short flare duration. The weak signal from the soft component dur-ing the flare precludes us from constraindur-ing NH,sfrom the flare spectrum. We therefore assumed that the absorption of the soft spectral component did not change during the flare and we fixed the value of NH,s to that obtained from modeling the low-level spectrum.
Our model fit to the overall flare spectrum inferred for the soft spectral component a plasma temperature and emission measure similar to that of the low-level period (second line of Table1). For the hard spectral component, we found a higher value for the absorption and the plasma temperature of the hard spectral component during the flare (5.2 × 1022 cm−2 versus 2.7 × 1022cm−2, and 61 MK versus 53 MK, respectively). Given
the range of possible values in our confidence interval, however, we cannot conclude with confidence that the absorption and the plasma temperature had increased. We can conclude, though, that the emission measure and the intrinsic X-ray luminosity of the hard spectral component increased by a factor of ∼five dur-ing the flare.
After the source flaring period, the source faintness and the brevity of the exposure with low-background level available af-ter 33 h (i.e., ∼2.5 ks, see Fig.2) did not allow us to obtain a useful spectrum.
3.3. UV variability
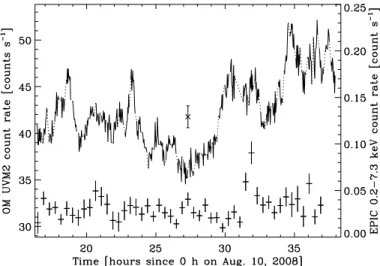
The UV event lists produced by the OM fast mode were re-binned to a bin size of 120 s to increase the signal-to-noise ra-tio. We obtained 10 UV measurements per OM fast-mode ex-posure, thus, 500 UV measurements for the whole observation. Figure5shows this UV light curve and, for comparison, the X-ray light curve. Significant UV variability was detected, with several events lasting from shorter than one hour to as long as about four hours. During these one-to-four hour events, the UV flux increased by ten to twenty percent from the initial count rate before returning to it. The baseline level of the UV light curve was not constant. In the first half of the observation, it followed a downward trend from about 40 counts s−1 to a minimum of about 36 counts s−1, and, then, an upward trend to a maximum of about 45 counts s−1.
Fig. 5. Simultaneous UV and X-ray light curves of EX Lup. The upper and lower curves are the OM light curve (left y-axis) and the EPIC light curve (right y-axis), respectively. The UV light curve obtained with the OM fast mode was rebinned to bin size of 120 s. In the figure center, the cross with error bar indicates the median value and median error of the UV photometry. To guide the eye, the dotted lines link consecutive OM exposures. The bin size of the X-ray light curve is 500 s.
Fig. 6. Lomb normalized periodogram (LNP) of the UV light curve. The grey line is the LNP of the OM light curve. The dashed and dotted lines are the average value and the 3σ up-per threshold of the LNP of red noise with power-law index of 1.39. The vertical dashed-dotted lines indicate the frequency as-sociated with our observing set-up and harmonic values (n=2, 3, 4).
None of the multiple UV peaks correlated simultaneously with any of the possible changes in the X-ray count rate. The rise of the X-ray flare occurred about 2 h after the start of a large UV flare. However, we cannot conclude, definitively, that absolutely no connection exists between the UV and X-ray flare events.
To search for any periodicity in this UV light curve, we com-puted the Lomb normalized periodogram (LNP; Lomb 1976;
Scargle 1982; Press & Rybicki 1989), which is well suited to unevenly sampled time series. The LNP revealed that the power of the UV signal versus frequency has a power-law shape (i.e., red noise), in addition to several high frequency peaks (Fig.6). A least squares log-log fitting of the LNP versus frequency inferred a negative slope, a = −1.26 ± 0.05. However, our observing
pro-N. Grosso et al.: accretion shocks and a smothered stellar corona unveiled by XMM-Newton cedure may flatten the LNP at high frequencies (e.g.,Uttley et al.
2002), hence the value of the LNP slope is not simply the nega-tive of the power-law index (α) of the true power spectral density (PSD), PS D( f ) ∝ f−α, where f is the frequency (see our
sim-ulations below). Nevertheless, this best-fit value of a indicates that α is most likely to be between 1 and 2, which are values of α associated with flicker noise and random-walk noise (Press 1978), respectively. In contrast to the case of Gaussian white noise (α = 0), where the significance level of any peak in the LNP can be evaluated analytically (Scargle 1982), we needed here to perform detailed simulations to assess the level of signif-icance of the high frequency peaks.
We assumed first that the true PSD of the intrinsic UV time series is that of red noise that we sampled evenly at the Nyquist frequency of our observation ( fNyquist = 2/120 Hz) from 60 s to 10 times the duration of our observation, and we then used the algorithm ofTimmer & Koenig(1995) to produce the corre-sponding light curve. We divided this light curve into 10 shorter light curves matching the duration of our observation. Each light curve was then binned in the same way as our UV light curve, and scaled to match the UV mean count rate and standard de-viation. The corresponding LNPs were then computed, leading to a sample of 10 LNP. We repeated this procedure 10 000 times to obtain a large (100 000) sample of LNPs. We found that red noise with α = 1.39±0.06 reproduces the slope of the LNP of the observed UV light curve. The observed high frequency peaks are below the upper threshold of the 99.7% confidence level (equiv-alent to 3σ in the Gaussian case) of the random fluctuation of the LNP, and are, hence, not significant. Indeed, our simulated light curves display similar high frequency peaks that we iden-tify as aliasing produced by our observing windows. The lower frequency ( f ≈ 6.6 × 10⁻⁴Hz ≈ 1/1522 Hz) matches the fre-quency associated with the sum of fast mode exposure (1200 s) and exposure gap (321.6 s); the other frequencies are harmonics (n × f , with n=2, 3, 4).
We conclude that the UV variability can be modeled with red noise (α = 1.39 ± 0.06) that arises from a true variability of the underlying physical process. We detected no significant, periodic signal in the UV light curve.
4. Discussion
4.1. Two-absorber X-ray sources
The X-ray spectrum of EX Lup exhibits two plasma compo-nents, one that is cooler with low absorption and one that is hot-ter with high absorption. Similar soft and hard spectral compo-nents with two absorbers have previously been observed in a few low-mass stars and protostars with accretion disks and jets that have been detected in forbidden emission lines (Kastner et al. 2005;G¨udel et al. 2005;G¨udel et al. 2007b).
The acronym TAX, which stands for Two-Absorber X-ray, was introduced by G¨udel et al. (2007b) to classify jet-driving sources that display this peculiar X-ray spectrum. The interpre-tation of the X-ray spectra of young stellar objects classified as TAX sources is that variable emission from the hotter plasma of the stellar corona is absorbed by circumstellar material, pro-ducing the hard spectral component. The non-variable, lightly absorbed soft component, meanwhile, likely arises as a conse-quence of shocks located at the base of jet-launching zones.
The prototype of the FUor class, FU Ori, shows this kind of unusual X-ray spectrum, but the ∼ 8 MK temperature of the soft component in FU Ori may reflect a coronal magnetic process rather than a shock origin (Skinner et al. 2006).
4.2. The origin of the hard X-ray component of EX Lup The flaring activity of the hard component of EX Lup, com-bined with the hotter plasma temperature of this component, points clearly to magnetic processes and probably coronal ac-tivity as the source of these X-rays. For comparison, the frac-tional X-ray activity11 of EX Lup, during the low-level period,
log(LX/Lbol) = −3.8, is similar to the median value observed for (accreting) T Tauri stars of the Orion nebula cluster (i.e., −3.74; Preibisch et al. 2005). Moreover, the flare amplitude is well within the range of values observed in this sample for T Tauri stars having similar value of low-level X-ray luminos-ity (see Fig. 3b ofStassun et al. 2007).
The large photoelectric absorption of the hotter plasma com-ponent of EX Lup is equivalent to an optical extinction of ∼ 15 mag (Vuong et al. 2003). However, the value of the op-tical extinction of EX Lup, although not well known, is very likely much lower, and generally assumedto be 0 or 1 mag in the literature (e.g.,Herbig et al. 2001;Gras-Vel´azquez & Ray 2005; Sipos et al. 2009). Herbig et al. (2001) noticed that the near-IR colors of EX Lup obtained in March 1992 (Hughes et al. 1994) are redder than those of normal M0 dwarfs. We found here that the reddened color of EX Lup in the near-IR is consis-tent with the intrinsic near-IR excesses of classical T Tauri stars (CTTSs), which are caused by direct emission of near-IR flux from disks and not by the reddening of photospheric emission by dust. In particular, 2MASS near-IR colors of EX Lup (J − H = 0.770 ± 0.032 mag, H − K = 0.462 ± 0.030 mag) – obtained on May 16, 1999, when EX Lup was at its minimum level (a visual magnitude of 13.5;Herbig 2007) – are well located on the loci of CTTSs (Meyer et al. 1997) tranformed to the 2MASS color system (using the color transformations of Carpenter 2001). Therefore, we conclude that the optical extinction of EX Lup is fully consistent with the argument that EX Lup experiences no optical extinction (AV = 0 mag) by dusty material. Moreover,
Sipos et al. (2009) argued, from modeling of the spectral en-ergy distribution of EX Lup during quiescence, that the accretion disk is viewed more nearly face-on than edge-on, with a best-fit model inclination of 20◦. This low inclination prevents any
ab-sorption of the stellar coronal emission by circumstellar material (gas+dust), which is consistent with the null optical extinction.
The large column density is hence necessarily produced by a dust-free gas with a low ionization. The accreted material close to a few stellar radii of the stellar photosphere is naturally dust-free after the sublimation of the dust grains. Moreover, the ac-cretion funnels, loaded with high density gas (∼ 1012cm−3), can easily produce this large column density on a length scale of only 0.3 stellar radii. The more or less pole-on view may also favor the absorption by these accretion funnels of X-ray emission from stellar magnetic loops at lower latitudes (Gregory et al. 2007).
On the surface, the sustained presence of a luminous, hard (coronal) X-ray component toward the end of the outburst of EX Lup would seem to be at odds with models in which en-ergetic ions emitted during coronal flares transform disk dust grains from silicate to amorphous form (Glauser et al. 2009), 11 FollowingKenyon & Hartmann(1995), we compute the stellar lu-minosity of EX Lup, Lbol, from its magnitude in the J-band – specifi-cally 2MASS (low-level) measurement of 9.73 mag, transformed to the homogenized system ofBessell & Brett(1988) using the color trans-formations of Carpenter(2001) – using V − J color and bolometric correction appropriate for a M0 spectral type star (see Table A5 of Kenyon & Hartmann 1995). We obtain Lbol = 0.55 L⊙, and a corre-sponding stellar radius of 1.7 R⊙for an effective temperature of 3850 K (Kenyon & Hartmann 1995).
given that the reverse was observed during the EX Lup outburst (Abrah´am et al. 2009´ ). We speculate that the large column den-sity observed in front of a coronal active region during the 2008 extreme outburst of EX Lup protected the fresh crystalline sili-cate apparently produced, against amorphization, hence possibly encouraging the production of cometary material during accre-tion outburst. Further modeling of the potential effects of PMS outbursts and flares on disk dust-grain structure is clearly war-ranted.
4.3. The origin of the soft X-ray component of EX Lup The low plasma temperature of the soft component is con-sistent with X-ray emission from a shock, located either in-side a jet, as proposed for TAX sources (Kastner et al. 2005;
G¨udel et al. 2005; G¨udel et al. 2007b), or at the base of an ac-cretion shock, as suggested by analyses of high-resolution X-ray spectra of CTTSs (Kastner et al. 2002;Stelzer & Schmitt 2004;
Schmitt et al. 2005; G¨unther et al. 2006; Argiroffi et al. 2007;
Robrade & Schmitt 2007;Brickhouse et al. 2010).
The former is unlikely as there is no indication of a jet in EX Lup. Forbidden emission lines of [O i], [N ii], and [S ii], which are the jet signatures visible in optical spectrum of CTTSs (e.g.,Hirth et al. 1997), are not detected in the optical spectra of EX Lup (e.g.,K´osp´al et al. 2008, and references therein; see in particularHerbig 2007for Keck/HIRES optical spectrum show-ing a lack of [S ii] emission lines).
Furthermore, in contrast to TAX sources (e.g., Fig. 2 of
G¨udel et al. 2007b), variability is evident in the soft component of the EX Lup X-ray spectrum. Hence, we favor the latter inter-pretation of the soft X-ray component, i.e., that this component has its origin in accretion shocks. As in the case of TW Hya (Kastner et al. 2002; Brickhouse et al. 2010), our pole-on view of the EX Lup star-disk system indeed probably provides a direct view of the relatively cool plasma associated with these shocks.
4.4. The origin of the UV emission of EX Lup
The UV light curve of EX Lup is reminiscent of the UV activ-ity already observed with the OM from other accreting pre-main sequence stars (e.g., BP Tau; Schmitt et al. 2005). In these ac-creting systems, the UV emission is directly related to a hot spot on the stellar surface (Calvet & Gullbring 1998;Gullbring et al. 1998). In this framework of magnetospheric accretion (see re-view of Bouvier et al. 2007), hot spots are located at the base of magnetic loops, which connect the photosphere and the accre-tion disk and are loaded with free-falling material that produces accretion shocks at the stellar surface.
Following Schmitt et al. (2005), we estimated the surface filling factor of the hot spots, i.e., the ratio of the hot spot area to the surface of the EX Lup photosphere. Using the UVM2 filter count rate to flux conversion factor12 of 2.19 × 10⁻¹⁵ erg cm−2s−1Å−1, we converted the minimum count rate of ∼36 counts s−1to 1.8 × 10⁻¹⁰erg cm2s−1. As we discussed in Sect.4.2, the optical extinction is negligible in EX Lup, there-fore, we could consider this value to be the intrinsic UV flux. We assumed for the hot spot a black-body spectrum of temper-ature 13 000 K, as measured from an IUE spectrum obtained during the 1994 outburst, when EX Lup was at V = 12.1 mag (Herbig et al. 2001), i.e., 3.3 times fainter than during our ob-servation. We found a surface filling factor of 0.9% for the hot
12 Seethe OM calibration status (issue 5.0).
spot. This small surface-filling factor is typical of values found in CTTSs (Calvet & Gullbring 1998).
The increase by about 45% in the count rate from the min-imum to the maxmin-imum observed value over a period of about 10 h can be explained either by an increase in the surface filling factor of the hot spot in the same proportion, or by an increase of 1000 K in the hot spot temperature. The latter can be pro-duced by an increase in the mass accretion rate of a factor of ∼1.2 (an estimate we obtained by interpolating the grid of mod-els of Calvet & Gullbring 1998).
5. Conclusions
We observed EX Lup withXMM-Newtona few days before the end of its 2008 extreme optical outburst, but when EX Lup was still in an elevated state. This observation is the longest contin-uous exposure that was obtained in X-rays and UV during this optical outburst.
We have found that the X-ray light curve of EX Lup contains mainly a low-level period and a two-hour flare event, during which the observed flux increased by a factor of four and notice-ably hardened. The variability observed in the UV on timescales ranging from less than one hour up to about four hours can be modeled with a red-noise spectrum. None of the UV events ob-served on August 10–11, 2008 correlate unambiguously with si-multaneous X-ray peaks. This UV activity is typical of accretion events and is dominated by emission from accretion hot spots covering only about one percent of the stellar surface.
The X-ray spectrum of EX Lup reveals two plasma com-ponents, one that is cooler with low absorption and one that is hotter with high absorption. The intrinsic X-ray luminosity of EX Lup is dominated by the emission from the hot plasma com-ponent. During the X-ray flare, the emission measure and the intrinsic X-ray luminosity of this absorbed plasma component is five times greater.
The soft plasma component is most likely associated with X-ray emission from accretion shocks – an inference based mainly on the absence of a jet in EX Lup. The nearly pole-on viewing geometry likely explains the high absorption of X-ray emission from low-latitude active regions by the high-density accretion funnel flows. Hence, the same dust-free accreting material that generates the soft component (via shocks) also largely smothers the corona of EX Lup. This model predicts that large values of column density, such as we measured toward the hard spectral component of EX Lup near the end of its 2008 outburst, should be present only during these accretion-driven optical outbursts.
Acknowledgements. We thanks theXMM-NewtonScience Operations Centre for the prompt schedule of this observation. This research is based on ob-servations obtained withXMM-Newton, an ESA science mission with instru-ments and contributions directly funded by ESA Member States and NASA. We acknowledge with thanks the variable star observations from the AAVSO International Database contributed by observers worldwide and used in this re-search.
References
´
Abrah´am, P., Juh´asz, A., Dullemond, C. P., et al. 2009, Nature, 459, 224 Anders, E. & Ebihara, M. 1982, Geochim. Cosmochim. Acta, 46, 2363 Anders, E. & Grevesse, N. 1989, Geochim. Cosmochim. Acta, 53, 197 Argiroffi, C., Maggio, A., & Peres, G. 2007, A&A, 465, L5
Audard, M., G ¨udel, M., Skinner, S. L., et al. 2005, ApJ, 635, L81 Audard, M., Stringfellow, G. S., G ¨udel, M., et al. 2010, A&A, 511, A63 Bessell, M. S. & Brett, J. M. 1988, PASP, 100, 1134
N. Grosso et al.: accretion shocks and a smothered stellar corona unveiled by XMM-Newton Bouvier, J., Alencar, S. H. P., Harries, T. J., Johns-Krull, C. M., & Romanova,
M. M. 2007, in Protostars and Planets V, ed. B. Reipurth, D. Jewitt, & K. Keil, 479–494
Brickhouse, N. S., Cranmer, S. R., Dupree, A. K., Luna, G. J. M., & Wolk, S. 2010, ApJ, 710, 1835
Calvet, N. & Gullbring, E. 1998, ApJ, 509, 802 Carpenter, J. M. 2001, AJ, 121, 2851
Comer´on, F. 2008, The Lupus Clouds, in Handbook of Star Forming Regions, Volume II: The Southern Sky, ASP Monograph Publications, Vol. 5, ed. B. Reipurth, p. 295–350
Dorman, B. & Arnaud, K. A. 2001, in Astronomical Society of the Pacific Conference Series, Vol. 238, Astronomical Data Analysis Software and Systems X, ed. . H. E. P. F. R. Harnden Jr., F. A. Primini, 415
Feigelson, E. D. & Montmerle, T. 1999, ARA&A, 37, 363 G ¨udel, M., Skinner, S. L., Briggs, K. R., et al. 2005, ApJ, 626, L53 Getman, K. V., Flaccomio, E., Broos, P. S., et al. 2005, ApJS, 160, 319 Glauser, A. M., G ¨udel, M., Watson, D. M., et al. 2009, A&A, 508, 247 Gras-Vel´azquez, `A. & Ray, T. P. 2005, A&A, 443, 541
Gregory, S. G., Wood, K., & Jardine, M. 2007, MNRAS, 379, L35
Grosso, N. 2006, in ESA Special Publication, Vol. 604, The X-ray Universe 2005, ed. A. Wilson, 51–56
Grosso, N., Kastner, J. H., Ozawa, H., et al. 2005, A&A, 438, 159 G ¨udel, M., Briggs, K. R., Arzner, K., et al. 2007a, A&A, 468, 353 G ¨udel, M. & Naz´e, Y. 2009, A&A Rev., 7
G ¨udel, M., Telleschi, A., Audard, M., et al. 2007b, A&A, 468, 515 Gullbring, E., Hartmann, L., Brice˜no, C., & Calvet, N. 1998, ApJ, 492, 323 G ¨unther, H. M., Liefke, C., Schmitt, J. H. M. M., Robrade, J., & Ness, J.-U.
2006, A&A, 459, L29
Hamaguchi, K., Grosso, N., Kastner, J. H., Weintraub, D. A., & Richmond, M. 2010, ApJ, 714, L16
Hartmann, L. & Kenyon, S. J. 1996, ARA&A, 34, 207 Herbig, G. H. 1966, Vistas in Astronomy, 8, 109 Herbig, G. H. 1977a, ApJ, 217, 693
Herbig, G. H. 1977b, ApJ, 214, 747
Herbig, G. H. 1989, in European Southern Observatory Astrophysics Symposia, Vol. 33, ESO Workshop on Low Mass Star Formation and Pre-Main Sequence Objects, ed. B. Reipurth, p. 233–246
Herbig, G. H. 2007, AJ, 133, 2679 Herbig, G. H. 2008, AJ, 135, 637
Herbig, G. H., Aspin, C., Gilmore, A. C., Imhoff, C. L., & Jones, A. F. 2001, PASP, 113, 1547
Hirth, G. A., Mundt, R., & Solf, J. 1997, A&AS, 126, 437
Hughes, J., Hartigan, P., Krautter, J., & Kelemen, J. 1994, AJ, 108, 1071 Itagaki, K., Nakano, S., & Yamaoka, H. 2008, IAU Circ., 8968, 2 Jones, A. F. 2008a, Central Bureau Electronic Telegrams, 1217, 1 Jones, A. F. 2008b, Central Bureau Electronic Telegrams, 1231, 1
Kastner, J., Richmond, M., Simon, T., et al. 2006a, Central Bureau Electronic Telegrams, 760, 1
Kastner, J. H., Franz, G., Grosso, N., et al. 2005, ApJS, 160, 511
Kastner, J. H., Huenemoerder, D. P., Schulz, N. S., Canizares, C. R., & Weintraub, D. A. 2002, ApJ, 567, 434
Kastner, J. H., Richmond, M., Grosso, N., et al. 2004, Nature, 430, 429 Kastner, J. H., Richmond, M., Grosso, N., et al. 2006b, ApJ, 648, L43 Kenyon, S. J. & Hartmann, L. 1995, ApJS, 101, 117
K ´osp´al, A., Nemeth, P., Abraham, P., et al. 2008, Information Bulletin on Variable Stars, 5819, 1
Lomb, N. R. 1976, Ap&SS, 39, 447
Lombardi, M., Lada, C. J., & Alves, J. 2008, A&A, 480, 785 Lorenzetti, D., Giannini, T., Calzoletti, L., et al. 2006, A&A, 453, 579 Mason, K. O., Breeveld, A., Much, R., et al. 2001, A&A, 365, L36 Meyer, M. R., Calvet, N., & Hillenbrand, L. A. 1997, AJ, 114, 288 Morrison, R. & McCammon, D. 1983, ApJ, 270, 119
Pojmanski, G. 2002, Acta Astronomica, 52, 397
Preibisch, T., Kim, Y.-C., Favata, F., et al. 2005, ApJS, 160, 401 Press, W. H. 1978, Comments on Astrophysics, 7, 103 Press, W. H. & Rybicki, G. B. 1989, ApJ, 338, 277 Robrade, J. & Schmitt, J. H. M. M. 2007, A&A, 473, 229 Scargle, J. D. 1982, ApJ, 263, 835
Schmitt, J. H. M. M., Robrade, J., Ness, J.-U., Favata, F., & Stelzer, B. 2005, A&A, 432, L35
Sipos, N., ´Abrah´am, P., Acosta-Pulido, J., et al. 2009, A&A, 507, 881 Skinner, S. L., Briggs, K. R., & G ¨udel, M. 2006, ApJ, 643, 995
Skinner, S. L., Sokal, K. R., G ¨udel, M., & Briggs, K. R. 2009, ApJ, 696, 766 Stassun, K. G., van den Berg, M., & Feigelson, E. 2007, ApJ, 660, 704 Stecklum, B. 2006, Central Bureau Electronic Telegrams, 690, 1 Stecklum, B., Melnikov, S. Y., & Meusinger, H. 2007, A&A, 463, 621 Stelzer, B., Hubrig, S., Orlando, S., et al. 2009, A&A, 499, 529 Stelzer, B. & Schmitt, J. H. M. M. 2004, A&A, 418, 687
Str¨uder, L., Briel, U., Dennerl, K., et al. 2001, A&A, 365, L18 Szeifert, T., Hubrig, S., Sch¨oller, M., et al. 2010, A&A, 509, L7 Timmer, J. & Koenig, M. 1995, A&A, 300, 707
Turner, M. J. L., Abbey, A., Arnaud, M., et al. 2001, A&A, 365, L27 Uttley, P., McHardy, I. M., & Papadakis, I. E. 2002, MNRAS, 332, 231 Vuong, M. H., Montmerle, T., Grosso, N., et al. 2003, A&A, 408, 581
Appendix A: Correcting OM fast-mode light curve of spurious features caused by spacecraft drifts and missing OM tracking history file
Before each OM science observation, a short-exposure image, called a Field AcQuisition (FAQ), is taken with the V-filter to identify proper field stars by comparison with the uploaded guide-star catalog. These good guide stars are then used as a reference frame to center the fast-mode window (composed of 22 × 23 pixels, each pixel having a size of ∼ 0.′′48, i.e., covering
a field-of-view of about 10.′′5 × 11′′) on the target at the start of the science exposure, and to monitor any spacecraft drifts during the OM science observation. However, owing to telemetry con-straints, no shift-and-adds of the fast-mode frames are performed on the spacecraft. Corrections of spacecraft drifts are made on the ground using the OM tracking history file (*OM*THX.FIT). When no good guide stars are found during the FAQ, the target cannot be centered on the fast-mode window, and any spacecraft drift during the exposure moves the target on the detector, which produces flux losses when aperture photometry is performed.
During our observation of EX Lup with the OM fast mode, no good guide stars were found during the FAQ; therefore, the OM tracking history file was not written to the Observation Data Files. For illustration purposes, we focused here on the S415 exposure, although several other exposures were found to exhibit similar artifacts.
Figure A.1 shows the light curves for EX Lup and the background, obtained using a 6-pixel extraction radius around EX Lup and an extraction radius of 1.2 to 2.5 times the source extraction radius for the background. These light curves were obtained with the SAS script omfchain, which assumes here zero spacecraft drifts (see dotted lines in Fig. A.1). The light curves for EX Lup and the background exhibit a dip and a peak, respectively, at about 24.31 h, lasting about 1 minute, and have identical profiles. Therefore, these features are not real, but ar-tifacts that can be explained by a decentering of the target with respect to the apertures, i.e., a motion of the target on the detec-tor caused by spacecraft drifts.
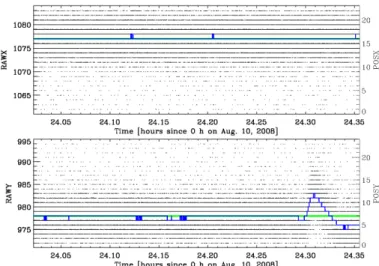
To estimate the spacecraft drifts, we propose using the OM fast-mode event list file (*OM*FAE.FIT) that provides for each event its frame number and its detector position (RAWX and RAWY coordinates). We track any motion of the target on the detector versus time by calculating the difference between the moving median and the median value of both detector coordinates versus times, with our IDL program. For the moving median, we use a set of frames containing at least 500 photons, which corresponds for EX Lup to a centered time interval with a half-width of about 6 s. The top and bottom panels of Fig.A.2show the scattered plots of RAWX and RAWY, respectively, versus time. The green and blue lines are the median position during the exposure and the moving median position versus time, respectively. A drift of 5 pixels along the detector y-axis of the target (corresponding to a motion of ∼ 2.′′5 on the sky), which occurred simultaneously with the features of Fig.A.1, is visible.
To correct the OM fast-mode event list of these spacecraft drifts, we wrote a bash script, using SAS and ftools tasks, based on the SAS thread entitled “OM data reduction with
Fig. A.1. UV light curves for EX Lup (top, with the background subtracted) and for the background (bottom) during the S415 exposure of the OM in the fast mode. The dotted lines show the light curves obtained with the SAS script omfchain and no tracking history file. The data points show the corrected light curves using our spacecraft drift estimates. The interval of the time bin is 10 s.
Fig. A.2. OM fast-mode window positions versus arrival times of UV photons detected during the S415 exposure. The top and bottom panel are the scattered plot of the positions of the UV photons detected by the optical monitor on the x and y-axis of the fast-mode window, respectively, versus the frame times cor-responding to the photon arrival times. The left and right axis give the detector and the fast window coordinates, respectively. The green line show the median position during the exposure. The blue line shows the moving median position versus time computed on a set of frames containing at least 500 photons. [See the electronic edition of A&A for a color version of this figure.]
SAS: step-by-step fast mode data processing chain”13. This SAS threads lists the 14 steps that are needed to process the fast-mode data with SAS tasks, and describes intermediate output files. In particular, the SAS task omfastshift (step 6) adds to the event list the new columns CORR X and CORR Y, but using here zero drifts (i.e., CORR X=RAWX and CORR Y=RAWY). Therefore, imme-diately after this step, we introduce ftools commands to add to 13 This SAS thread is available at : http://xmm.esac.esa.int/-sas/current/documentation/threads/omf stepbystep.shtml.
these columns our estimate of the spacecraft drifts. From these corrected positions, we produce a corrected image in the detec-tor frame from which the source detection is performed (step 8). FigureA.2shows OM fast-mode light curves obtained with this method. The spurious features due to spacecraft drifts have been corrected.
We note that the SAS task omlcbuild (step 13) restores the fraction of point spread function (PSF), which falls out of the fast-mode window on the final corrected image, and not on the individual frames. Therefore, for frames where the spacecraft drifts are so large that the target is close to the window edges, the fraction of PSF which falls out of the window cannot be totally restored. For these frames, the spurious features will be only mit-igated. This limitation exists even when the OM tracking history file is not missing.
![[PDF] Cours Utilisation de NetBeans pour les applications J2ME | Formation informatique](data:image/gif;base64,R0lGODlhAQABAIAAAP///wAAACH5BAEAAAAALAAAAAABAAEAAAICRAEAOw==)