HAL Id: hal-00299028
https://hal.archives-ouvertes.fr/hal-00299028
Submitted on 1 Jan 2003
HAL is a multi-disciplinary open access
archive for the deposit and dissemination of
sci-entific research documents, whether they are
pub-lished or not. The documents may come from
teaching and research institutions in France or
abroad, or from public or private research centers.
L’archive ouverte pluridisciplinaire HAL, est
destinée au dépôt et à la diffusion de documents
scientifiques de niveau recherche, publiés ou non,
émanant des établissements d’enseignement et de
recherche français ou étrangers, des laboratoires
publics ou privés.
Fractal analysis of the ULF geomagnetic data obtained
at Izu Peninsula, Japan in relation to the nearby
earthquake swarm of June?August 2000
K. Gotoh, M. Hayakawa, N. Smirnova
To cite this version:
K. Gotoh, M. Hayakawa, N. Smirnova. Fractal analysis of the ULF geomagnetic data obtained at Izu
Peninsula, Japan in relation to the nearby earthquake swarm of June?August 2000. Natural Hazards
and Earth System Science, Copernicus Publications on behalf of the European Geosciences Union,
2003, 3 (3/4), pp.229-236. �hal-00299028�
c
European Geosciences Union 2003
and Earth
System Sciences
Fractal analysis of the ULF geomagnetic data obtained at Izu
Peninsula, Japan in relation to the nearby earthquake swarm of
June–August 2000
K. Gotoh1, M. Hayakawa1, and N. Smirnova2
1The University of Electro-Communications, Chofu, Tokyo 182 8585, Japan 2Institute of Physics, St.Petersburg University, St. Petersburg 198504, Russia
Received: 28 June 2002 – Accepted: 23 October 2002
Abstract. In our recent papers we applied fractal methods
to extract the earthquake precursory signatures from scaling characteristics of the ULF geomagnetic data, obtained in a seismic active region of Guam Island during the large earth-quake of 8 August 1993. We found specific dynamics of their fractal characteristics (spectral exponents and fractal dimen-sions) before the earthquake: appearance of the flicker-noise signatures and increase of the time series fractal dimension. Here we analyze ULF geomagnetic data obtained in a seis-mic active region of Izu Peninsula, Japan during a swarm of the strong nearby earthquakes of June–August 2000 and compare the results obtained in both regions. We apply the same methodology of data processing using the FFT proce-dure, Higuchi method and Burlaga-Klein approach to cal-culate the spectral exponents and fractal dimensions of the ULF time series. We found the common features and spe-cific peculiarities in the behavior of fractal characteristics of the ULF time series before Izu and Guam earthquakes. As a common feature, we obtained the same increase of the ULF time series fractal dimension before the earthquakes, and as specific peculiarity – this increase appears to be sharp for Izu earthquake in comparison with gradual increase of the ULF time series fractal dimension for Guam earthquake. The re-sults obtained in both regions are discussed on the basis of the SOC (self-organized criticality) concept taking into account the differences in the depths of the earthquake focuses. On the basis of the peculiarities revealed, we advance method-ology for extraction of the earthquake precursory signatures. As an adjacent step, we suggest the combined analysis of the ULF time series in the parametric space polarization ratio – fractal dimension. We reason also upon the advantage of the multifractal approach with respect to the mono-fractal anal-ysis for study of the earthquake preparation dynamics.
Correspondence to: N. Smirnova
1 Introduction
Fractal and chaotic properties of earthquakes are now widely recognized and pointed out not only in the current scien-tific literature but also in the lecture notes in Physics and Earth Sciences (see for example, Goltz, 1998; Jensen, 1998). Since the fractal properties could characterize evolution of the earthquake system to a self-organized critical state, in which the system is extremely sensitive to any external per-turbations, the investigation of scaling characteristics of dif-ferent signals related to earthquakes could give us an infor-mation on the earthquake preparation processes. In our re-cent papers (Hayakawa et al., 1999, 2000; Smirnova et al., 1999, 2001) we applied fractal methods to extract the earth-quake precursory signatures from scaling characteristics of the ULF geomagnetic fields, registered in the seismic active region of Guam Island during the strong earthquake of 8 Au-gust 1993. We revealed some specific peculiarities in the be-havior of fractal characteristics of the ULF time series (spec-tral exponents and fractal dimensions) before the earthquake: appearance of the flicker-noise signatures and increase of the time series fractal dimension. Here we analyze another set of ULF geomagnetic data, obtained in a seismic active region of Izu Peninsula, Japan during a swarm of the strong nearby earthquakes of June–August 2000 and compare the results obtained in both regions. The paper is organized as follows: In Sect. 2, we describe shortly the ULF field experiment of 2000 in Japan, character seismic activity and the ULF data selected for analysis; in Sect. 3 we concern the methods of data processing. The results of fractal analysis of Izu Penin-sula geomagnetic data are presented in Sect. 4. In Sect. 5 we discuss the common features and specific peculiarities in the behavior of fractal characteristics of the ULF time series for the cases of the Guam and Izu earthquakes. Then we formulate the conclusions from our research, and give rec-ommendation for future investigations. Thus we advance our methodology for extraction of the earthquake precursory sig-natures.
230 K. Gotoh et al.: Fractal analysis of the ULF geomagnetic data
2 Description of the field experiment of June–August 2000 in Japan: seismic activity and the ULF experi-mental data
It is now evident that the earthquake preparation process includes not only seismic, but also electromagnetic events. Thus electromagnetic earthquake precursors can be ex-pected, and they have actually been observed, especially in the ULF (f = 0.005–1 Hz) range (see Kopytenko et al., 1993, 1994; Molchanov and Hayakawa, 1995; Smirnova, 1999). That stimulated well-directed field experiments in seismic active regions with use of the ULF electromagnetic measure-ment technique. One of such experimeasure-ments was performed in 2000 in Japan on Izu Peninsula. The advanced ULF mea-surement technique (MVC-2DS instrumentation, designed in SPbF IZMIRAN, Russia) was installed on Izu Peninsula at the three stations: Mocmicoshi, Kamo and Seikoshi. In the course of experiment, a swarm of the strong nearby earth-quakes with magnitudes up to M = 6.5 occurred in that re-gion. Epicentres of those earthquakes were situated in the sea south-east of Izu Peninsula. One can see the location of ac-tive zones in Fig. 1, where the distributions of seismic activ-ity in space and time are presented for a limited area of Japan (ϕ = [33–37]◦N, λ=[136–142]◦E) for June–August 2000.
The earthquake swam near Izu Peninsula is shown in the bounded area of Fig. 1a. In Fig. 1b, the temporal evolution of seismic activity in that bounded area is presented. The data are taken from JMA (Japanese Meteorological Agency) cat-alogue. Magnitude is represented by the Mj value: Mj = log A+ 1.73 log1−0.83, where A is the maximum amplitude of ground moving at the observation area, and 1 is the distance between the epicentre and the observation place. The loca-tion of ULF measuring staloca-tions Seikoshi (SEI), Mochikoshi (MCK) and Kamo (KMO) are pointed out by the black dots with the corresponding marks in Fig. 1a.
It is seen from Fig. 1b, that rather quiet seismic period took place during all but June, up to 27 June, when the swarm of earthquakes with the initial magnitudes M = 4–5 was started. The first massive earthquake with M > 6 occurred on 1 July (Mj = 6.5). The other strong earthquakes with Mj > 6 were registered on 8, 15, 30 July and 18 August (see Fig. 1b). All earthquakes in the swarm were shallow ones: their depths did not exceed 10 km. Here we attribute our analysis mainly to the first strong earthquake of 1 July.
The raw data used for analysis were digital records of the magnetic field components H (NS), D (EW), and Z (verti-cal) with two-second sampling rate, obtained at Mochikoshi station. So the sampling frequency of the data was 0.5 Hz. An example of daily record is presented in Fig. 2. In the insertion to Fig. 2, one can see the original 1-hour record (H -component taken from the noon sector 12:00–13:00 LT) selected for the further analysis. If we compare the ULF ge-omagnetic record of Mochikoshi station presented in Fig. 2 with corresponding ULF record of the Guam observatory presented in Fig. 1 of Smirnova et al. (2001), we can see that those records look very similar. That gives us the com-mon basis for analysis of both sets of data, and we can use
here the same analysis methodology as we used earlier for the Guam geomagnetic data. For the case of Izu Peninsula, the effective sampling rate (2 s) and selected duration of each time series (1 h) allow us to analyze the properties of ULF emissions in the frequency range from f = 0.001 Hz to f = 0.2 Hz.
3 Methods of data processing and the analysis method-ology
To develop the current methodology of ULF data process-ing, we take into account our cumulative experience of fractal analysis of the Guam geomagnetic data timed to the strong earthquake of 8 August 1993 (Hayakawa et al., 1999, 2000; Smirnova et al., 1999, 2001). In that case, we applied differ-ent methods of fractal analysis: studied the evolution of the ULF emission spectrum slope obtained by the FFT method (Feder, 1989; Turcotte, 1997), and investigated the dynam-ics of the ULF time series fractal dimensions obtained on the basis of Burlaga-Klein approach (Burlaga and Klein, 1986) and Higuchi method (Higuchi, 1988, 1990). The detailed description of those three methods in close relation to our present study, is contained in Smirnova et al. (2001) and here we concern them only briefly.
The FFT method allows us to obtain the spectral expo-nent β for a fractal time series, which is characterised by the power-law spectrum: S(f ) ∼ f−β. If we plot the spectrum of the ULF signals in the log-log form, we can obtain β from the slope of the straight line, which is best fit to the spectrum. Then we can calculate the fractal dimension of the ULF time series using the Berry’s equation: D0 =(5 − β)/2 (Berry,
1979). Burlaga and Klein suggested the method, which pro-vided a stable estimation of spectral exponents through the calculation of stable values of the fractal dimension D0.
They defined the length L of the curve B(t ), representing geophysical time series B(tk), (k= 1, 2...n) along some
inter-val 0 ≤ t ≤ T0(where T0=nτ), as LBK(τ ) = n X k=1 |B(tk+τ ) − B(tk)|/τ,
where B(tk)denotes the average value of B(t) between the
t = tkand tk+τ. For statistically self-affine (fractal) curves,
the length is expressed as LBK(τ ) ∝ τ−D0. From this
rela-tion, one can estimate fractal dimension D0, and then the
power-law index β from the Berry’s expression. Higuchi method is very similar to Burlaga-Klein approach. It gives also stable values of fractal dimensions. Higuchi modified the Burlaga-Klein method suggesting a little bit more com-plicated procedure for calculation of the length L of the curve B(t ). He constructed new time series Bτmfrom the original time series B(t ) and defined the length L of the original time series as an average value of the lengths Lm(τ )
represent-ing each time series Bτm(see Higuchi, 1988; Smirnova et al., 2001 for details).
We compared the efficiency of three methods carrying out the test calculations of the fractal dimensions D0and
spec-136˚ 136˚ 137˚ 137˚ 138˚ 138˚ 139˚ 139˚ 140˚ 140˚ 141˚ 141˚ 142˚ 142˚ 33˚ 33˚ 34˚ 34˚ 35˚ 35˚ 36˚ 36˚ 37˚ 37˚ 0 50 100 km MCK SEIKMO Tokyo Mj=3.0 Mj=4.0 Mj=5.0 Mj=6.0 (a) 2 3 4 5 6 7 Magnitude (Mj)
1-Jun 10-Jun 20-Jun 30-Jun 10-Jul 20-Jul 30-Jul 9-Aug 19-Aug 29-Aug days
(b)
Fig. 1. The distribution of seismic activity in space (a) and time (b) for Japanese earthquakes of June–August 2000. The swarm of earthquakes under question is shown in the marked bounded area. The data are taken from the JMA (Japanese Meteorological Agency) catalogue. Magnitude is represented by the Mj value (Mj = log A + 1.73 log1−0.83, where A is the maximum amplitude of ground moving at the observation area, and 1 is the distance between the epicentre and the observation place). Position of the ULF magnetic stations Seikoshi (SEI), Mochikoshi (MCK) and Kamo (KMO) at Izu Peninsula is shown by the black dots in (a).
tral exponents β for simulated noise with different Hurst exponents: Hu =0.9 (persistent noise), Hu =0.5 (random
noise) and Hu =0.1 (antipersistent noise). The values of
fractal dimension D0and spectral exponent β for simulated
noise were calculated from the relations: D0 =2 − Hu and
β =5−2D0(Turcotte, 1997). The results of the test
calcula-tions showed that the Higuchi method gave the more correct estimations of D0 and β for persistent (Hu =0.9) and
ran-dom (Hu =0.5) noise, whereas the Burlaga-Klein method
gave more correct results for antipersistent (Hu =0.1) noise.
As to FFT method, we revealed that it gave not so bad results for random and antipersistent noise. As far as the real values of β for the Guam data occupied mainly the range β =1–2, the use of FFT method for the Guam data was correct. For Izu Peninsula data we applied the same methodology, as for Guam data.
We calculated the spectral exponent β and the time series
fractal dimension D0for ULF signals (H component) in each
one-hour interval in the noon sector (12:00–13:00 LT). The investigated period was February 2000–February 2001. As in the case of the Guam data analysis, we removed trends from the observed signals and used the Hanning window before applying the FFT procedure. Then we studied variations of D0and β prior to and during the earthquakes.
4 Results of the Izu Peninsula data analysis
Variations of the ULF geomagnetic fields in the local noon interval (12:00–13:00 LT) at the Mochikoshi station are shown in Fig. 3 for June 2000. We can see a pronounced dynamics of the ULF emissions from one day to another, but there is no visible peculiarity in the ULF emission behavior before 27 June, when the earthquake swarm is started. So we
232 K. Gotoh et al.: Fractal analysis of the ULF geomagnetic data
Fig. 2. An example of the daily record of geomagnetic field variations (H (NS), D(EW), and Z(vertical) components) at the Mochikoshi station, Izu Peninsula, Japan (22 June 2000). The original ULF record (H component, sampling frequency 0.5 Hz) for the 40:00–05:00 UT interval, which corresponds to local noon sector (12:00–13:00 LT) is shown in the insertion. Points (pts) of X-axis represent two-second time intervals.
Fig. 3. Variation of the ULF geomagnetic signals in the local noon interval (12:00–13:00 LT) at the Mochikoshi station (Izu Peninsula, Japan) in June 2000. One can see a pronounced dynamics of the ULF emissions. The same signal, which is shown in the insertion to Fig. 2, is clearly seen here in the position 22 (22 June).
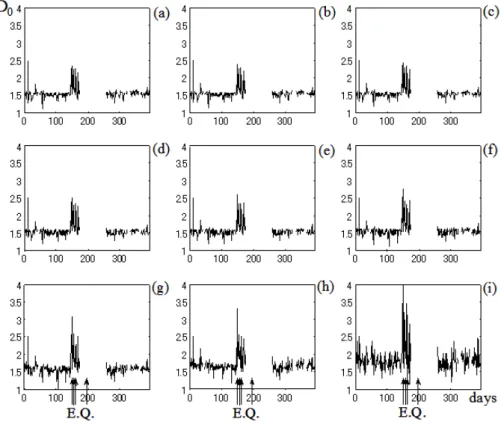
Fig. 4. Dynamics of the fractal dimensions (D0) of the ULF geomagnetic time series in different narrow (1log f = 0.25) frequency bands.
Mochikoshi station, Izu Peninsula, Japan, 3 February 2000–28 February 2001. The frequency increases from (a) to (i): (a) 3.00<log(f )<
−2.75 (0.00100< f (Hz)<0.00178), (b) 2.75<log(f )< −2.50 (0.00178< f (Hz)<0.00316), (c) 2.50<log(f )< −2.25 (0.00316< f
(Hz)<0.00562), (d) 2.25<log(f )< −2.00 (0.00562< f (Hz)<0.01000), (e) 2.00<log(f )< −1.75 (0.01000< f (Hz)<0.01778), (f) 1.75<log(f )< −1.50 (0.01778< f (Hz)<0.03162), (g) 1.50<log(f )< −1.25 (0.03162< f (Hz)<0.05623), (h) 1.25<log(f )< −1.00 (0.05623< f (Hz)<0.10000), (i) 1.00<log(f )< −0.75 (0.10000< f (Hz)<0.17778). The days of the four strongest earthquakes are marked by arrows with symbol E.Q. (A gap in the data results from some technical problems with the amplifiers).
have applied the above mentioned methodology of data pro-cessing and calculated the scaling characteristics of the sig-nals. As in the case of Guam earthquake, we have revealed the decrease of spectrum slopes and the corresponding in-crease of fractal dimensions of the ULF time series a few days before the first massive earthquake of 1 July. That ten-dency is confirmed by all three methods of data processing: by FFT procedure, Higuchi method and Burlaga-Klein ap-proach. Initially we have referred scaling to the entire ULF frequency band f =0.001–0.2 Hz, as in the case of Guam data analysis. But it is very important to reveal the optimal frequency band, where this peculiarity is more pronounced. Such a frequency band has to be connected with the char-acteristic depths of the earthquakes and the crust conductiv-ity (see Kaufman and Keller, 1981). As the first step, we divided the total frequency band 1f =0.001–0.2 Hz in the ULF emission spectrum into 9 narrow frequency bands and defined the spectrum slope in each of the nine bands, in or-der to reveal the right frequency range, where the earthquake precursory signatures would be more pronounced. The cor-responding dynamics of fractal dimension D0computed
us-ing FFT method for the noon sector (12:00–13:00 LT) is pre-sented in Fig. 4 for the period 3 February 2000–28 February
2001. The frequency ranges for each band are presented in caption to Fig. 4. The days of the four strongest earthquakes are marked by arrows with symbol E.Q. We can see that there is no precursory effect in the low frequencies (Figs. 4a– e). The precursory signature appears on the frequencies f >0.02 Hz (Figs. 4f–i) and it is the most pronounced at the highest frequency band (f =0.1–0.2 Hz). So the high frequency band of the ULF emission spectrum appears to be very important for extraction of the earthquake precursory signatures. Therefore, as the next step of our analysis, we have fixed the highest frequency range and extend gradually the analyzed frequency band in direction to the low frequen-cies. The corresponding results are presented in Fig. 5. We can see that in this case, the precursory effect appears every-where, in each analyzed frequency band including the entire ULF band f =0.001–0.2 Hz (Fig. 5a). The importance of the high frequency bands is also seen from Fig. 5: addition of the high frequency noise to the low frequency noise leads to appearance of the precursory effect, wherein there was no precursory effect before (see Fig. 4). The results obtained show that it is important to extend the analyzed frequency range toward the high frequencies. Unfortunately, the actual sampling rate (2 s) does not allow us to do that now. But in
234 K. Gotoh et al.: Fractal analysis of the ULF geomagnetic data
Fig. 5. Dynamics of the fractal dimensions (D0) of the ULF geomagnetic time series depending on the frequency bandwidth. Mochikoshi
sta-tion, Izu Peninsula, Japan, 3 February 2000–28 February 2001. The frequency bandwidth decreases from a) to i) in such a way that the highest frequency in each band remains the same (f = 0.17778 Hz): (a) 3.00<log(f )< −0.75 (0.00100< f (Hz)<0.17778), (b) 2.75<log(f )<
−0.75 (0.00178< f (Hz)<0.17778), (c) 2.50<log(f )< −0.75 (0.00316< f (Hz)<0.17778), (d) 2.25<log(f )< −0.75 (0.00562< f
(Hz)<0.17778), (e) 2.00<log(f )< −0.75 (0.01000< f (Hz)<0.17778), (f) 1.75<log(f )< −0.75 (0.01778< f (Hz)<0.17778), (g) 1.50<log(f )< −0.75 (0.03162< f (Hz)<0.17778), (h) 1.25<log(f )< −0.75 (0.05623< f (Hz)<0.17778), (i) 1.00<log(f )< −0.75 (0.10000< f (Hz)<0.17778). The days of the four strongest earthquakes are marked by arrows with symbol E.Q. (A gap in the data results from some technical problems with the amplifiers).
future, the data with sampling rate of 12.5 Hz will be avail-able for this region, and we will have a possibility to continue our analysis.
5 Discussion: comparison of the results for Guam and Izu earthquakes; suggestions for the future study
We have revealed some common features and specific pecu-liarities in the behavior of scaling characteristics of the ULF geomagnetic fields before the Guam and Izu earthquakes. In both cases, the decrease of the spectrum slope (and the cor-responding increase of the ULF time series fractal dimen-sion) took place before the strong earthquakes. It means that the higher frequency fluctuations appear in the electromag-netic noise prior to strong earthquakes, and the ULF noise changes the character of its behavior from random and per-sistent type to the more antiperper-sistent behavior. Such dynam-ics seems to be in agreement with the crack formation pro-cess and with physical model of earthquake precursors due to crack propagation and the charge dislocation motion, pro-posed by Vallianatos and Tzanis (see Vallianatos and Tzanis, 1999; Tzanis and Vallianatos, 2002). As specific peculiarity
of the Izu Peninsula case, the increase of the ULF time series fractal dimension before the massive Izu earthquake appears to be sharper in comparison with gradual increase of the ULF time series fractal dimension for the Guam earthquake. That can be connected with differences in the depths of the earth-quakes (h = 65 km for Guam earthquake and h <20 km for Izu earthquakes) and variety of geological structures of those regions. The SOC (self-organized critical) processes con-nected with crack formation and fluid dynamics, can develop more slowly at the depth of 65 km than at the depths of 10– 20 km. Also the evolution of the system to the SOC state will go on with different velocities depending on the local elastic and electric parameters of the test regions and their geologi-cal peculiarities.
So our experience of study of the ULF geomagnetic field behavior at Guam Island and Izu Peninsula shows, that in-crease of the ULF time series fractal dimension take place in both cases, and it can be considered as an precursory signa-ture of the strong earthquake. The other precursory signasigna-ture, which has been revealed on the basis of ULF geomagnetic data, is a specific variation of the polarization ratio Z/H of ULF geomagnetic fields a few days (or weeks) before the
ma-jor shock. Such a specific variation has been found for many strong earthquakes, including the Guam and Izu earthquakes (see Kopytenko et al., 1993, 2001, 2002; Hayakawa et al., 1996). So the next step in development of methodology for extraction of the earthquake precursory signatures, could be combined analysis of the ULF time series in the paramet-ric space polarization ratio fractal dimension. Construction of the phase diagram of the ULF geomagnetic field behav-ior in that parametric space could allow us to understand which of the four preparation stages (random chaos, subcrit-ical, critical or supercritical stage, as described in Troyan et al., 1999) is now the earthquake system going on, and thus to increase the probability of detection of such situations, when the earthquake system is in close approaching to the major shock . But such an analysis could be a subject of another paper. We reason also upon the advantage of the multifractal approach (see Mandelbrot, 1989) with respect to the mono-fractal analysis for extraction of the earthquake precursory signatures. The supporting argument for that is qualitative analogy between the destruction process (process of crack propagation) and multifractal structure generation, which have been established recently (see Kiyashchenko et al., 2003 for details). The multifractal spectrum of singulari-ties contains such important generalized characteristics of the time series as information entropy and the high-order fractal dimensions, which can be sensitive to the earthquake prepa-ration processes. Application of the multifractal approach for study of the evolution of the regional seismicity distribution before a number of the large earthquakes of Japan and South-ern California showed specific precursory dynamics of those parameters before the major shock. (Kiyashchenko et al., 2003). So we can expect also the corresponding precursory behavior in the multifractal characteristics of ULF geomag-netic fields in seismo-active regions.
As a summary from our research we can conclude that the fractal precursory effects revealed are real; they mani-fest some common features and also specific peculiarities in each of the test region. Thus the fractal analysis of the ULF geomagnetic data could give an important information about the earthquake preparation processes, and it can be involved (in combination with other methods) in development of the earthquake prediction methodology.
Acknowledgements. The work has been supported by Grant INTAS
99-1102, and the Russian Programme “Intergeophysica”. The ULF data were available thanks to the partnership project of NASDA and the Institude of Physical and Chemical Reserach (RIKEN). We are grateful to the project organizers for those data. Also we thank our colleague T. F. Peterson, Jr. from TFPLAB, Cleveland, Ohio, USA for fruitful discussion of possible electromagnetic effects related to earthquakes.
References
Berry, M. V.: Diffractals, J. Phys. A Math. Gentile, 12, 207–220, 1979.
Burlaga, L. F. and Klein, L. W.: Fractal structure of the interplane-tary magnetic field, J. Geophys. Res., 91, A1, 347–350, 1986.
Feder, J.: Fractals, Plenum, New York, 1989.
Goltz, C.: Fractal and chaotic properties of earthquakes (Lecture Notes in Earth Sciences, 77), Springer-Verlag, 178 p., 1998. Hayakawa, M., Kawate, R., Molchanov, O. A., and Yumoto, K.:
Re-sults of ultra-low-frequency magnetic field measurements during the Guam earthquake of 8 August 1993, Geophys. Res. Lett., 23, 241–244, 1996.
Hayakawa, M., Ito, T., and Smirnova, N.: Fractal analysis of ULF geomagnetic data associated with the Guam earthquake on Au-gust 8, 1993, Geophys. Res. Lett., 26, 18, 2797–2800, 1999. Hayakawa, M., Kopytenko, Yu. A., Smirnova, N. A., Troyan, V.
N., and Peterson, Th.: Monitoring ULF magnetic disturbances and schemes for recognizing earthquake precursors, Phys. Chem. Earth (A), 25(3), 263–269, 2000.
Hayakawa, M., Ito, T., Hattori, K, and Yumoto, K.: ULF electro-magnetic precursors for an earthquake at Biak, Indonesia on 17 February 1996, Geophys. Res. Lett., 27, 18, 1531–1534, 2000. Higuchi, T.: Approach to an irregular time series on the basis of
fractal theory, Physica D 31, 277–283, 1988.
Higuchi, T.: Relationship between the fractal dimension and the power-low index for a time series: a numerical investigation, Physica D 46, 254–264, 1990.
Jensen, H. J.: Self-Organized Criticality (Cambridge Lecture Notes in Physics, 10), Cambridge University Press, 153 p., 1998. Kaufman, A. A. and Keller, G. V.: The magnetotelluric sounding
method, Elsevier Sci. Pub. Comp., 595 p., 1981.
Kiyashchenko, D., Smirnova, N., Troyan, V., and Vallianatos, F.: Multifractal analysis of the regional seismicity dynamics before the large earthquakes, Precursory evolution of spatial and tem-poral inhomogeneity of the seismicity distribution, Nat. Hazards Earth Sys. Sci., this issue, 2003.
Kopytenko, Yu. A., Matiashvili, T. G., Voronov, P. M., Kopytenko, E. A., and Molchanov, O. A.: Detection of ultra-low-frequency emissions connected with the Spitak earthquake and its after-shock activity, based on geomagnetic pulsations data at Dusheti and Vardzia observatories, Phys. Earth Planet. Inter., 77, 85–95, 1993.
Kopytenko, Yu. A., Matiashvili, T. G., Voronov, P. M., and Kopytenko, E. A.: Observation of electromagnetic Ultra-Low-frequency Lithospheric Emissions (ULE) in the Caucasian seis-micallly active area and their connection with the earthquakes, in: Electromagnetic phenomena related to earthquake predic-tion, (Eds) Hayakawa, M. and Fujinawa, Y., Terra Sci. Pub. Co., Tokyo, 175–180, 1994.
Kopytenko, Yu., Ismagilov, V., Hayakawa, M., Smirnova, N., Troyan, V., and Peterson, Th.: Investigation of the ULF elec-tromagnetic phenomena related to earthquakes: contemporary achievements and the perspectives, Annali di Geofisica, 44, 2, 325–334, 2001.
Kopytenko, Yu. A., Ismagilov, V. S., Hattori, K., Voronov, P. M., Hayakawa, M., Molchanov, O. A., Kopytenko, E. A.,
and Zaitsev, D. B.: Monitoring of the ULF
electromag-netic disturbances at the station network before EQ in seis-mic zones of Izu and Chiba peninsulas (Japan), in:
Seismo-Electromagnetics: Lithosphere-Atmosphere-Ionosphere
Cou-pling, (Eds) Hayakawa, M. and Molchanov, O. A., Terra Sci. Pub. Co., Tokyo, 11–18, 2002.
Mandelbrot, B. B.: Multifractal measures, especially for geophysi-cist, Pure Appl. Geophys., 131, 1/2, 5–42, 1989.
Molchanov, O. A. and Hayakawa, M.: Generation of ULF electro-magnetic emissions by microfracturing, Geophys. Res. Lett., 22, 3091–3094, 1995.
236 K. Gotoh et al.: Fractal analysis of the ULF geomagnetic data
Smirnova, N. A.: The peculiarities of ground-observed
geo-magnetic pulsations as the background for detection of ULF emissions of seismic origin, in: Atmospheric and ionospheric electromagnetic phenomena associated with Earthquakes, (Ed) Hayakawa, M., Terra Sci. Publ. Co., Tokyo, 215–232, 1999. Smirnova, N. A., Hayakawa, M., and Ito, T.: Structure of the ULF
geomagnetic noise in a seismoactive zone and its relation to the earthquake, in: Noise in Physical Systems and 1/f Fluctuations (ICNF’99, Hong Kong, 23–26 August), (Ed) Surya, Ch., World Scientific, 471–474, 1999.
Smirnova, N., Hayakawa, M., Gotoh, K., and Volobuev, D.: Scaling characteristics of the ULF geomagnetic fields at the Guam seis-moactive area and their dynamics in relation to the earthquake, Nat. Haz. Earth Syst. Sci., 1, 119–126, 2001.
Troyan, V. N., Smirnova, N. A., Kopytenko, Yu. A., Peterson, Th., and Hayakawa, M.: Development of a complex approach for searching and investigation of electromagnetic precursors
of earthquakes: organization of experiments and analysis pro-cedures, in: Atmospheric and ionospheric electromagnetic phe-nomena associated with Earthquakes, (Ed) M. Hayakawa, Terra Sci. Publ. Co., Tokyo, 147–171, 1999.
Turcotte, D. L.: Fractals and Chaos in Geology and Geophysics, Cambridge University Press, Second edition, 397 p., 1997.
Tzanis, A. and Vallianatos, F.: A physical model of
elec-tric earthquake precursors due to crack propagation and
the motion of charged edge dislocatios, in:
Seismo-Electromagnetics: Lithosphere-Atmosphere-Ionosphere
Cou-pling, (Eds) Hayakawa, M. and Molchanov, O. A., Terra Sci. Pub. Co., Tokyo, 117–130, 2002.
Vallianatos, F. and Tzanis, A.: A model for the generation of precur-sory electric and magnetic fields associated with the deformation rate of the earthquake focus, in: Atmospheric and ionospheric electromagnetic phenomena associated with Earthquakes, (Ed) Hayakawa, M., Terra Sci. Publ. Co., Tokyo, 287–306, 1999.