HAL Id: hal-01386365
https://hal.archives-ouvertes.fr/hal-01386365
Submitted on 23 Oct 2016
HAL is a multi-disciplinary open access
archive for the deposit and dissemination of
sci-entific research documents, whether they are
pub-lished or not. The documents may come from
teaching and research institutions in France or
abroad, or from public or private research centers.
L’archive ouverte pluridisciplinaire HAL, est
destinée au dépôt et à la diffusion de documents
scientifiques de niveau recherche, publiés ou non,
émanant des établissements d’enseignement et de
recherche français ou étrangers, des laboratoires
publics ou privés.
Distributed under a Creative Commons Attribution| 4.0 International License
Singular-value demodulation of phase-shifted holograms
Fernando Lopes, Michael Atlan
To cite this version:
Fernando Lopes, Michael Atlan. Singular-value demodulation of phase-shifted holograms. Optics
Let-ters, Optical Society of America - OSA Publishing, 2015, 40, pp.2541 - 2541. �10.1364/OL.40.002541�.
�hal-01386365�
Fernando Lopes1 and Michael Atlan2
1
Institut de Physique du Globe de Paris - Pal´eomagn´etisme, Universit´e Paris Diderot, Sorbonne Paris Cit´e, 1 rue Jussieu, Paris, France
2
Centre National de la Recherche Scientifique (CNRS) UMR 7587, Institut Langevin. Fondation Pierre-Gilles de Gennes,
Institut National de la Sant´e et de la Recherche M´edicale (INSERM) U 979, Universit´e Pierre et Marie Curie (UPMC), Universit´e Paris 7. ´Ecole Sup´erieure de Physique et de Chimie Industrielles ESPCI ParisTech - 1 rue Jussieu. 75005 Paris. France
(Dated: October 23, 2016)
We report on phase-shifted holographic interferogram demodulation by singular value decomposi-tion. Numerical processing of optically-acquired interferograms over several modulation periods was performed in two steps : 1- rendering of off-axis complex-valued holograms by Fresnel transformation of the interferograms; 2- eigenvalue spectrum assessment of the lag-covariance matrix of hologram pixels. Experimental results in low-light recording conditions were compared with demodulation by Fourier analysis, in the presence of random phase drifts.
OCIS codes: 090.1995, 040.2840, 120.2880, 040.3780
Recording optical holograms by time-modulated interferometry was proposed and demonstrated in early studies [1–3]. It pioneered the development of phase-shifting [4] holographic interferometry. Time-modulated phase-shifting interferometry involves recording of a sequence of interferograms over at least one modulation cycle of the intensity. Temporal demodulation consists in a linear combination of a sequence of recorded interferograms, whose coefficients are the ones of a discrete Fourier transform [5–7]. An important feature of holographic interferometry is to allow spatial signal modulation in off-axis recording conditions [8], which permits the discrimination of self-beating and cross-beating interferometric contributions of the object field and the reference field. In this configuration, spurious interferometric contributions can be filtered-off [9]. It was demonstrated that the combination of spatial and temporal signal modulation enables low-light imaging
at shot noise levels [10, 11]. Important features and
applications include optical phase imaging [12–15] and detection tunability in the radiofrequency range for optical heterodyne detection [16], frequency-resolved narrowband sensing of scattered optical radiation [17–
19]. Sensitivity is compatible with photon-counting
recording conditions [20–22]. In standard phase-shifting interferometry, a sequence of interferograms with known phase shifts between probed and reference optical waves is recorded. When the modulation is not known, principal component analysis [23] can be used for
non-parametric, non-iterative demodulation. It identifies
uncorrelated variables in the structure of the data (the principal components) from the analysis of its correla-tions. Non-parametric approaches were also applied to image formation concepts [24], speckle reduction [25–29], and laser speckle contrast analysis of flows [30].
In this letter, we demonstrate experimentally that the sensitivity of low-light optical signal retrieval in time-modulated holographic interferometry can be
im-proved with respect to Fourier transform demodulation in practical conditions, when random signal fluctuations
are present. For that purpose, a data-driven,
non-parametric signal processing method is used. It consists of calculating the spectrum of eigenvalues in a singular value decomposition (SVD) of the lag-covariance matrix of recorded temporal fluctuations of the hologram’s pix-els, after spatial Fresnel transformation. The proposed processing scheme is less affected by random optical phase drifts occurring during the sampling process than signal demodulation by discrete Fourier transformation.
In optical heterodyne detection, a field of interest
E(t) = E exp (iωLt), oscillating at the optical frequency
ωL, is non-linearly mixed with a local oscillator field
ELO(t) = ELOexp (i∆ωt) exp (iωLt) that is set at a
close-by intermediate frequency ωL + ∆ω. In this notation,
E and ELO are complex constants and i is the imaginary
unit. The amplitude and phase of the original signal E(t) can be retrieved in the desired outcome oscillating at the difference frequency ∆ω, which can be set within the re-ceiver’s temporal bandwidth. The frequency conversion process is ensured by non-linear detection of the optical field E by the array of square-law sensors of a camera, which respond quadratically with the impinging electric field’s magnitude. The squared magnitude of the total
field received, I(t) = |E(t) + ELO(t)|2, has cross-terms
oscillating at the difference frequency ∆ω of the fields E
and ELO, causing modulation of the optical energy flux
I(t) = |E|2+ |ELO|2+ EELO∗ e−i∆ωt+ E∗ELOei∆ωt, where∗
denotes the complex conjugate. This equation describes the temporal fluctuation of the recorded intensity at a given pixel. Holographic image rendering, referred to as spatial demodulation, is then performed onto each recorded interferogram I by a discrete Fresnel transform. This transformation involves the free-space propagation impulse response of the optical field [7, 31]. In off-axis recording configuration, the Fresnel transform separates spatially the four interferometric terms of I(t) [8, 9] and
2 forms a reconstructed hologram. In the absence of
ran-dom fluctuations, the pixels of the off-axis part of the hologram carry the signal
X(t) = EE∗
LOexp(−i∆ωt) (1)
The purpose of signal demodulation is to retrieve the magnitude of the oscillating signal at the frequency ∆ω at each pixel. In ideal conditions, Eq. 1 holds and signal demodulation by discrete Fourier analysis of the recorded interferograms [6, 7] enables shot-noise limited detection in dim light [10]; yet in actual experiments, random amplitude and phase fluctuations limit the detection sensitivity.
We recorded phase-shifted interferograms over several modulation periods in low-light and studied signal retrieval procedures. Optical recording of interferograms was performed with a frequency-shifted, off-axis Mach-Zehnder interferometer [32] used for optical heterodyne detection of the object field E, backscattered from a res-olution target, beating against a separate local oscillator
field ELO, on a sensor array. The main optical field was
provided by a 150 mW, single-mode laser (wavelength
λ = 532 nm, optical frequency ωL/(2π) = 5.6 × 10¹⁴Hz,
Cobolt Samba-TFB-150). The optical frequency of the local oscillator beam was shifted by a tunable quantity ∆ω by two acousto-optic modulators (AA-electronics, MT200-BG9-FIO) driven by phase-locked
continuous-wave radiofrequency signals around 200 MHz. The
observed reflective resolution target was illuminated over a ∼ 10 mm-diameter disk. Interferograms were measured with a Ximea MQ042MG-CM camera (2048×2048 pixels CMOSIS CMV4000 sensor array, pixel size d = 5.5 µm,
full well charge : 13500 e− (photo-electrons), conversion
gain : 1/G = 0, 075 counts/e−, quantum efficiency at 532 nm η ∼ 0.5), running at an externally-triggered
frame rate of ωS/(2π) = 20 Hz, at 8 bit/pixel
quanti-zation. In the reported experiment, a reflective USAF target printed on white paper was illuminated in re-flection, and the recorded intensity of the light in the object channel accounted for 11.56 counts × G ≃ 154 photo-electrons per pixel per frame, on average. The average intensity of the light in the LO channel ac-counted for 63.89 counts × G ≃ 852 photo-electrons
per pixel per recorded frame. In these conditions, a
sequence of 128 consecutive raw interferograms was recorded for a detuning frequency of the local oscillator
of ∆ω/(2π) = 5 Hz, creating 4-phase (ωS/∆ω = 4)
modulation conditions [32]. Twelve more sequences of images were acquired after decreasing the optical power
in the object channel by 100.5 from one measurement to
the next, by combining optical densities (O.D., Thorlabs NE absorptive neutral density filters). The transmitted
power to the target scaled as 10−O.D., from 100to 10−6;
hence the average number of recorded photo-electrons per pixel and per frame in the object channel ranged
from 154 to 1.54 × 10⁻⁴. The LO-to-object optical
power ratio (heterodyne gain) ranged from GH ≃ 5.5
FFT demodulation SVD demodulation O .D . = 0 O .D . = 1 O .D . = 2 O .D . = 3 O .D . = 4 O .D . = 5 O .D . = 6 no signal demodulation
FIG. 1: Amplitude holographic images from 4-phase modu-lated interferograms acquired over 128 frames. No time de-modulation (first column). Dede-modulation by Fourier trans-form (second column). Demodulation by singular value de-composition (third column).
to GH ≃ 5.5 × 10⁶, because the LO power was kept
constant throughout the experiment. The holographic images of these two datasets were then demodulated spatially [31], to yield 661 × 661 complex-valued time traces X(t) of 128 elements each, cropped from the 2048 × 2048 calculation array, over an off-axis spatial region of interest where the image was expected. We then compared two types of signal demodulation proce-dures to assess the magnitude of the oscillating signal at the frequency ∆ω in X(t) at each pixel : Fourier anal-ysis, and singular value analysis of temporal fluctuations.
0 1 2 3 4 5 6 −30 −25 −20 −15 −10 −5 0 5
Optical density (O.D.)
o p tic al s ig nal (d B ) RAW FFT SVD 10 lo g( 10 àO :D : )
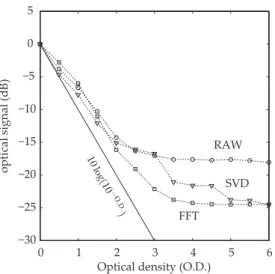
FIG. 2: Signal magnitude versus optical density (O.D.) in the object channel from a sequence of N = 128 frames of 4-phase interferograms. No time demodulation (circles). Demodula-tion by discrete Fourier transform (squares). DemodulaDemodula-tion by singular value decomposition (triangles).
First, holographic images were rendered without de-modulation. The squared magnitude of the object field was averaged over N = 128 frame sequences, and re-ported in the first column of Fig. 1. The image is not visible for optical power transmission factors lower or
equal to 10−3 (i.e. O.D. = 3), which corresponds to
19.7 photo-electrons per pixel recorded on average dur-ing 128 frames. Then, the recorded optical fluctuations were projected on the expected oscillation to retrieve the modulated component to improve the detection sensitiv-ity. The modulation depth of the signal was assessed by
a fast Fourier transform (FFT) ˜X of the sequence xk at
the modulation frequency ωS/4 (5 Hz), calculated on 128
time points. Results are reported in the second column of Fig. 1. The image is not visible for a power transmission
factor lower or equal to 10−5 (i.e. O.D. = 5), which
cor-responds to 1.97×10⁻¹photo-electron per pixel recorded
on average during 128 frames. Finally, we performed sin-gular value analysis of temporal fluctuations. In this
ap-proach, we embedded the time series X = {x1, ..., xN} of
the signal at each pixel in a Hankel matrix of dimension K × (N − K + 1), where K is the number of principal components to seek, and N = 128 is the total number of acquired interferograms. The Hankel matrix D, com-posed of N − K + 1 lag-shifted copies of truncated values of X(t) has the form
D = x1 x2 . . . xN −K+1 x2 x3 . .. ... .. . ... . .. xN −1 xK xK+1 . . . xN (2)
We proceeded by diagonalizing the lag-covariance
matrix of X(t), CX = DDt∗, where Dt∗ is the adjoint
matrix (Hermitian conjugate) of D. The K eigenvalues
λk, k = 1, ..., K of CX, numbered by decreasing order
of magnitude, were calculated by SVD [33] of CX. The
length of the analysis window K was chosen to be an integer number of expected periods of the modulated
signal [34] K = p ωS/∆ω. We used a window length
of p = 5 modulation periods (K = 20). Images were rendered by calculating the amplitude of the second eigenvalue at each pixel. They are displayed in Fig. 1 in the third column, as a function of the optical density in the object channel. With this approach, the image is visible down to an optical power transmission factor of
10−6 (i.e. O.D. = 6), for which the signal wave intensity
accounted for a total of 1.97 × 10⁻² recorded
photo-electron per pixel during 128 frames, on average. The algorithm used for the SVD is based on the orthogonal triangular decomposition (QR factorization) [35]. SVD and FFT were performed by the functions svd() and fft() in Matlab 2012a, run on a CentOS 6 Linux 64-bit operating system. The response curve of singular value demodulation was assessed by plotting the quantity
10 log10(hSi / hS0i) (in dB) against the value of the
optical density in the object channel (Fig.2). The
braces h i indicate spatial averaging of S, and S0 within
and outside the reconstructed image, respectively. The expected ideal detection behavior is plotted as a continuous black line (-10 dB of optical power per
unit of optical density). The demodulation by SVD
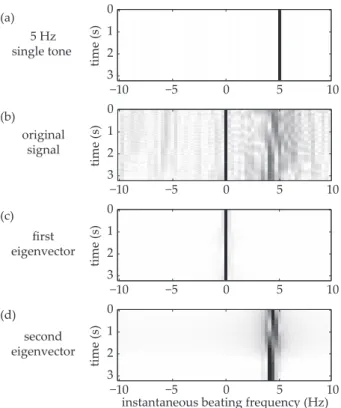
is qualitative [36]; yet it enables to retrieve images at much lower signal levels than FFT demodulation. The singular value demodulation procedure is illustrated by the spectrograms of four signals, reported in Fig. 3 : (a) the complex wave oscillating at ∆ω/(2π) = 5 Hz, which would be expected in perfect modulation conditions, in the absence of random phase fluctuation (Eq. 1); (b) the actual signal X(t) from a pixel at O.D. = 2, which exhibits a DC contribution and jitter - deviation from the modulation frequency; and the signal reconstructed from the first (c) and second (d) eigenvectors and eigenvalues of the SVD of D. In this example, the DC term is found in the first component, and the modulated component at 5 Hz undergoing a phase drift is retrieved in the second component of the SVD.
In conclusion, we used heuristically a singular value decomposition procedure to retrieve time-modulated
optical signals in holographic interferometry. In the
reported experiment, over long acquisition times, singu-lar value demodulation of phase-shifted interferograms enabled qualitative image visualization at much lower signal levels than demodulation by discrete Fourier transformation. This method will be investigated for signal retrieval in strong phase fluctuations conditions, phase microscopy, and singular spectrum analysis of pseudoperiodic modulations.
This work was supported by Agence Nationale de la Recherche (ANR-09-JCJC-0113, ANR-11-EMMA-046), Fondation Pierre-Gilles de Gennes (FPGG014), r´egion
4 tim e (s ) 0 1 2 3 tim e (s ) 0 1 2 3
instantaneous beating frequency (Hz)
−10 −5 0 5 10 −10 −5 0 5 10 tim e (s ) 0 1 2 3 −10 −5 0 5 10 original signal second eigenvector first eigenvector tim e (s ) 0 1 2 3 −10 −5 0 5 10 5 Hz single tone (a) (b) (c) (d)
FIG. 3: Spectrograms of a complex wave oscillating at 5 Hz (a), a hologram’s pixel signal X(t) (b), reconstructed signals from the first (c) and second (d) elements of the SVD of D.
Ile-de-France (C’Nano, AIMA), the Investments for the Future program (LabEx WIFI: 10-LABX-24, ANR-10-IDEX-0001-02 PSL*), and European Research Coun-cil (ERC Synergy HELMHOLTZ).
[1] A. Macovski, Applied Physics Letters 14, 166 (1969). [2] C. C. Aleksoff, Appl. Phys. Lett 14, 23 (1969).
[3] R. D¨andliker, in In: Progress in optics. Volume
17.(A81-13109 03-74) Amsterdam, North-Holland Publishing Co., 1980, p. 1-84., vol. 17 (1980), vol. 17, pp. 1–84.
[4] I. Yamaguchi and T. Zhang, Optics letters 22, 1268 (1997).
[5] K. Creath, Applied Optics 24, 3053 (1985).
[6] K. Freischlad and C. Koliopoulos, Journal of the Optical Society of America A: Optics and Image Science, and Vision 7, 542 (1990).
[7] U. Schnars and W. P. O. Juptner, Meas. Sci. Technol. 13, R85 (2002).
[8] E. Leith and J. Upatnieks, JOSA 52, 1123 (1962). [9] E. Cuche, P. Marquet, and C. Depeursinge, Applied
Op-tics 39, 4070 (2000).
[10] M. Gross and M. Atlan, Optics Letters 32, 909 (2007). [11] M. Lesaffre, N. Verrier, and M. Gross, Applied optics 52,
A81 (2013).
[12] E. Cuche, P. Marquet, and C. Depeursinge, Applied Op-tics 38, 6994 (1999).
[13] F. Charri`ere, T. Colomb, F. Montfort, E. Cuche, P. Mar-quet, and C. Depeursinge, Applied optics 45, 7667 (2006).
[14] N. Pandey and B. Hennelly, 3D Research 2, 1 (2011). [15] Y. Cotte, F. Toy, P. Jourdain, N. Pavillon, D. Boss,
P. Magistretti, P. Marquet, and C. Depeursinge, Nature Photonics 7, 113 (2013).
[16] F. Bruno, J. Laurent, D. Royer, and M. Atlan, Applied Physics Letters 104, 083504 (2014).
[17] M. Gross, P. Goy, B. Forget, M. Atlan, F. Ramaz, A. Boc-cara, and A. Dunn, Opt. Lett. 30, 1357 (2005).
[18] M. Atlan, P. Desbiolles, M. Gross, and M. Coppey-Moisan, Opt. Lett. 35, 787 (2010).
[19] H. Ruan, M. L. Mather, and S. P. Morgan, JOSA A 30, 1409 (2013).
[20] M. Yamamoto, H. Yamamoto, and Y. Hayasaki, Optics letters 34, 1081 (2009).
[21] P. Latorre Carmona, B. Javidi, F. Pla Ba˜n´on, and E. Ta-jahuerce (2013).
[22] N. Demoli, H. Skenderovi´c, and M. Stipˇcevi´c, Optics Let-ters 39, 5010 (2014).
[23] J. Vargas, J. A. Quiroga, and T. Belenguer, Optics letters 36, 1326 (2011).
[24] M. Bertero and E. Pike, Opt. Acta. 29, 727 (1982). [25] F. A. M. Rodriguez, A. Federico, and G. H. Kaufmann,
Optics Communications 275, 38 (2007).
[26] M. B. Bernini, G. E. Galizzi, A. Federico, and G. H. Kauf-mann, Optics and lasers in engineering 45, 723 (2007). [27] S. Equis and P. Jacquot, Opt. Express 17, 611 (2009). [28] W.-H. Su, C.-K. Lee, and C.-W. Lee, Optics and Lasers
in Engineering 48, 212 (2010). Fringe Projection Tech-niques.
[29] M. Leo, R. Piccolo, C. Distante, P. Memmolo, M. Paturzo, and P. Ferraro, Optical Engineering 53, 112314 (2014).
[30] A. Humeau-Heurtier, P. Abraham, and G. Mahe, Medical Imaging, IEEE Transactions on PP, 1 (2014).
[31] M. K. Kim, L. Yu, and C. J. Mann, Journal of Optics A: Pure and Applied Optics 8, S518 (2006).
[32] M. Atlan, M. Gross, and E. Absil, Optics Letters 32, 1456 (2007).
[33] G. H. Golub and C. Reinsch, Numerische Mathematik 14, 403 (1970).
[34] R. Vautard and M. Ghil, Physica D: Nonlinear Phenom-ena 35, 395 (1989).
[35] G. H. Golub and C. F. Van Loan, Matrix computations, vol. 3 (JHU Press, 2012).