HAL Id: hal-02961996
https://hal.archives-ouvertes.fr/hal-02961996
Submitted on 8 Oct 2020
HAL is a multi-disciplinary open access
archive for the deposit and dissemination of sci-entific research documents, whether they are pub-lished or not. The documents may come from teaching and research institutions in France or abroad, or from public or private research centers.
L’archive ouverte pluridisciplinaire HAL, est destinée au dépôt et à la diffusion de documents scientifiques de niveau recherche, publiés ou non, émanant des établissements d’enseignement et de recherche français ou étrangers, des laboratoires publics ou privés.
POROUS NETWORK STRUCTURE AND TOTAL
POROSITY OF ROCKS USED IN HISTORICAL
MONUMENT CHELLAH
A Samaouali, Y. El Rhaffari, M Hraita, L Laanab, H Oudrhiri, Yves Géraud
To cite this version:
A Samaouali, Y. El Rhaffari, M Hraita, L Laanab, H Oudrhiri, et al.. POROUS NETWORK STRUC-TURE AND TOTAL POROSITY OF ROCKS USED IN HISTORICAL MONUMENT CHELLAH. Romanian Journal of Materials, Procema, 2017, 47 (2), pp.222-229. �hal-02961996�
POROUS NETWORK STRUCTURE AND TOTAL POROSITY
OF ROCKS USED IN HISTORICAL MONUMENT CHELLAH
A. SAMAOUALI11, Y. EL RHAFFARI1, M. HRAITA1, L. LAANAB1, H. OUDRHIRI1, Y. GERAUD2
1Université Mohammed V, Faculté des Sciences, Laboratoire de Thermodynamique, B. P. 1014, Rabat. Maroc
2University of Lorraine, ENSG, UMR 7359-Géo Ressources, rue du Doyen Marcel Roubault TSA 70605,54518 Vandoeuvre Les Nancy Cedex, France
The aim of this work is to determine the physical and mineralogical characteristics of the building stones used in the archeological Roman site named Chellah in the Rabat city (Morocco). For that, many experimental measurements, based on the mercury intrusion porosimetry and Scanning Eelectron Microscopy were carried out on samples extracted from different areas of the building. The SEM analysis shows a net change in the internal structure of the altered stone according to the depth. The porosity is essentially localized between the primary particles and can be completely sealed by secondary precipitations. The mercury porosimetry measurements allow obtaining several parameters and show the presence of three types of porosity domains :i) a macroporosity domain in which the access ray is greater than 2 µm), ii) a microporosity domain in which the access ray is smaller than 0.2 µm and iii) no porosity variation (0.2 < access ray < 2 µm), which evolves to a class of mesoporosity during the alteration of the material. The increase in the microporosity and macroporosity is caused by a partial dissolution of cements. The analysis of altered and unaltered samples of various orientations shows a difference between the pore volumes for samples perpendicular and parallel to the bedding plane. This result confirms that Calcarenite stones are anisotropic materials in which the porous network connectivity is characteristic of the petrophysical properties anisotropy.
Keywords:Chellah monument, Calcarenites, mercury intrusion porosimetry, porous network, anisotropic connectivity
1. Introduction
The lifetime of stone monuments is often related to the rock ability to prevent the penetration of aggressive agents (water, humidity, acid rain, salt) in its porous structure [1, 2]. The capacity of the rock surface to resist to the degradation is determined by the petrophysical properties (porosity, permeability, thermal conductivity, diffusivity, pore shape, distribution of access rays and transfer processes [1-4]. Consequently, the characterization of pore space in the sedimentary rocks is an important step to understand and predict fluid flow in porous network.
Several studies have shown that the porosity and morphology of the porous network has an influence on the degradation kinetics [4,5]. Interconnected micropores network facilitate fluid transfer by capillarity and make rock more sensitive to salt crystallization. The porosity varies as a function of the area or the rock nature [6,15].
The calcarenite stones used in the construction and restoration of Chellah monument, have been the subject of many research works [6,7,8,10,11]. They correspond to PlioceneQuaternary coastal calcarenite located between Casablanca and Larache [9, 10]. Chemical analysis [8,9,12,13] showed that the calcarenites is constituted mainly of calcium carbonate (CaCO3) (between 50 and
57%) and a low percentage of Silica (SiO2) in the form of
quartz grains (25%). This material [9.13] presents:
• an important macroporosity (30-200 µm) representing 90% of the pore area resulting from the arrangement and organization of the grains
• a significant microporosity (0.001 to 0.2 µm) representing 10% of
porous networks.
This work aims to study the decay process of calcarenite blocs taken from the second shop wall of the Roman part of the Chellah monument. Samples are cored then analyzed by Mercury porosimetry and Scaning Electron Microscopy in order to determine the porous network structure, the content and the nature of clays formed during the deterioration process. The analysis of the fluid distribution in the porous network by the mercury injection method under vacuum show several parameters characterizing unaltered and altered rocks (macroporosity, mesoporosity, microporosity).
2. Location and Materials
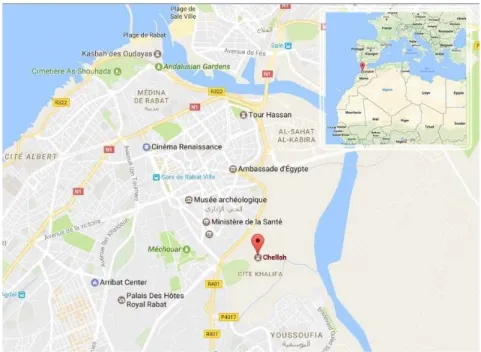
The historical site Chellah is located in west of the city centre of Rabat (Figure 1). It is the oldest known human settlement at the mouth of the Oued Bouregreg, as evidenced by many Palaeolithic and Neolithic deposits [10]. It also keeps the remains of ancient civilizations Phoenician, Carthaginian and Roman. These old buildings are now in an aggressive environment (pollution, acid rain ...), different from that reigned for centuries.
In the Chellah monument, we can distinguish the walls and gates constructed with different materials and techniques. The walls that are different architecturally (height, thickness, decoration) are all built by ramming technique. This technique, whose origins date back to the Phoenicians, is to press the clay in a wooden form [12], In the Phoenician method, we conclude that they used only pressed clay in the form of wood, they did not use calcarenites. The Roman method used only calcarenite without clay. Alteration of rammed earth is under studying in laboratory. The gates of the ancient Roman city are constructed of calcarenites stones. The investigative strategy is based on an experimental study which consists of making measurements in the laboratory.These
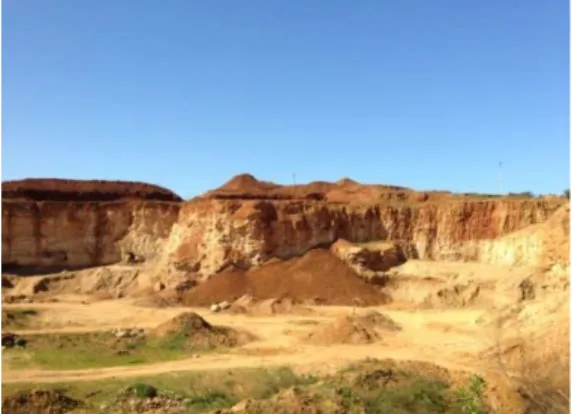
measures may be useful in a digital study to simulate the evolution of the structural damage of the material in time and space (ongoing PhD thesis). Samples altered have been extracted on the vestiges of a wall in the Roman city, these samples with or without black crusts (Figure 2), The crust is formed from the clay content on the surface, it is an effect of a clay precipitation enhanced by the modification of the pH conditions (weather). It can also be attributed to the accumulation of ‘‘detritic’’ clays by dust and wind.The unaltered samples have been taken from a quarry near Rabat [10] (Figure 3). 3. Characterization techniques
Samples were observed, after a metallization step, using a JEOL JSM 840. This technique, based on electron beam interaction with sample’s atoms, leads to X-ray, secondary and backscattered electrons emission. Each signal is processed to extract more information about the analyzed sample. To perform reliable EDX analysis an environ-mental scanning electron microscopy (ESEM) Quanta 200, coupled to an energy
Fig. 2 - Archaeological roman site
Fig. 3 - The quarry is to the altitude of 56 m (latitude: 33,944499, longitude: -6, 729126)Zone of quarry here the calcarenite rock has been taken.
dispersive X-ray spectrometer (EDX) was used. In the low vacuum mode, samples were analyzed without a metallization step.
Samples were also analyzed by Mercury Intrusion Porosimetry (MIP), which is an indirect destructive method to obtain the distribution of the pore size entries of porous media. Mercury is a nonwetting fluid, the contact angle between mercury and the surface of the sample is greater than 90 °. It is therefore necessary to apply a pressure on mercury to penetrate it inside the porous network. According to the law of Laplace and
Young, the relationship between the capillary radius and the pressure applied is:
2scosq
P
c=
(1)R
cwhere Pc is the mercury pressure,
Rc is the radius of the capillary tube, θ is the Hg-solid contact
Usually θ is set at 130° which is an average value for most stones (Good and Mikhail 1981).
The principle is to put a small sample (up to 10cm) under vacuum, then progressively inject mercury at increasing pressures. The measure of the volume of injected mercury is taken at each pressure step. This pressure is associated with a radius thanks as presented in the Washburn equation (1). So, the bigger pores are the first to be filled with mercury, then the smaller ones. Nevertheless, a big pore with a smaller entry will be filled at the pressure corresponding to its entry size, and thus be seen on the spectrum as a smaller size.
These porosimetry measurements are performed using a Micromeritics Pore Sizer 9320 device which allows injecting mercury at pressures ranging from 0.001 to 300 MPa. The data analysis leads to plot the saturation curves as a function of the injection pressure [9,10,14,16 - 19].
4. Results and discussion
4.1 Structural analysis (SEM)
4.1.1. Unaltered samples
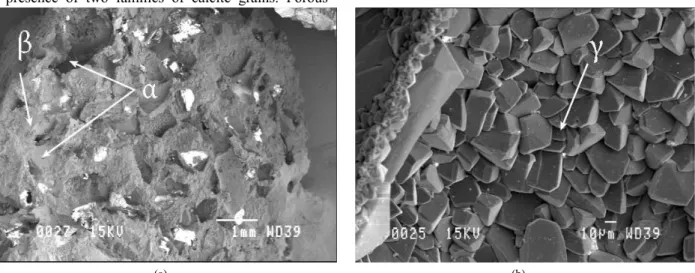
Unaltered samples were placed in a desiccator (HR = 0%) for 24 hours, then covered with gold by evaporation. We represent in Figure 4 the analysis of three fragments taken from different areas of the unaltered sample surface. The image (a) shows the presence of two families of calcite grains. Porous
primary particles (α) of ovoid shapes and plurimetric sizes which are covered with a layer of sparitic calcite precipitates (β) of about 20 µm thick. This image shows also that the inside of the primary grains is either empty or consists of a material formed of smaller crystals (1 to 2 µm). The image (b) shows the primary grains of unaltered calcite. The porosity is relatively elongated, and is essentially located between the primary particles and can be completely sealed by the secondary precipitation. 4.1.2. Altered sample with metallization
Two important areas were selected for observation by scanning electron microscope: area on the surface and that located at a depth of 8cm from the surface. We present SEM images of two fragments taken from the surface of the altered block (Figure 5). Several forms of alterations are visible on the micrographs. The image (a) shows the presence of altered calcite grains. Dissolution has preferentially affected the secondary calcite grains, essentially on their borders. Altered primary grains keep their initial shapes. Secondary sparites grains corroded with development of dissolution walls are visible at higher magnification micrograph (a). This phenomenon leads to the local development of high porosity. On the other hand, the images (a) and (b) show the presence of a clay deposit β in surface, which tends to reduce the pore space; this decrease of porosity in the surface was also be observed by mercury injection (Figure 11).
(a) (b)
Fig. 4 - Images acquired by Scanning Electron Microscopy of two fragments of unaltered calcarenite. (a) primary grains of calcite (α), surrounded by a sparitic layer (β); (b) grain of unaltered calcite (γ). 60 × 175 mm (96 × 96dpi).
(a) (b)
Fig. 5 –SEM images of two altered fragments taken from the surface; (a) altered calcite grains with the presence of a clay deposit in surface (β), which seals the intergranular porosity. The image (b) shows secondary calcite grains with development of
dissolution walls (γ). 129 × 122 mm (96 x 96 DPI).
(a) (b)
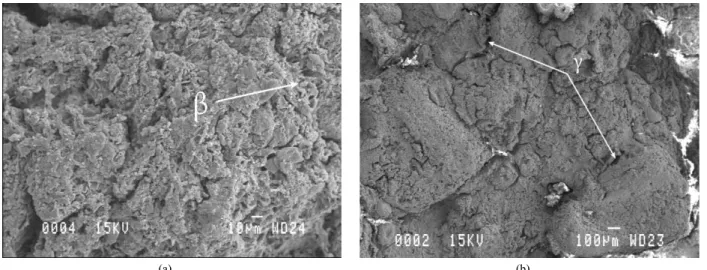
Fig. 6 –SEM images of two fragments taken in depth of thealtered block; Image (a) shows a zone consisting of micrite (α) surrounded by an area of high precipitation of sparitic calcite (β); Image (b) shows the presence of the intragranular porosity and also primary grains slightly altered (γ), protected by a sparitic gangue (δ). 64 × 185 mm (96 x 96 DPI).
4.1.3. Internal structure of the altered sample Figure 6 shows micrographs of two fragments taken at 8 cm of depth of the altered block. The image (a) shows an area constituted of micrite (α) surrounded by a strong sparitic calcite precipitation area (β).The image (b) shows the primary grains (γ) unweathered protected by sparitic gangue (δ). In depth, side cements seem less abundant, although this may be due to sampling. However, alteration of some primary elements walls connects the internal pore volume of these elements to intergranular pore network.
4.2 Mercury intrusion porosimetry
Mercury intrusion porosimetry is considered as the basis of all microstructural characterization to evaluate the material durability. It gives an overall idea on the total porosity and the pore access ray. These characteristics can be correlated with physical
properties (capillarity, evaporation, sorption-desorption, electrical resistivity and thermal conductivity).
4.2.1. Unaltered and altered samples undirected
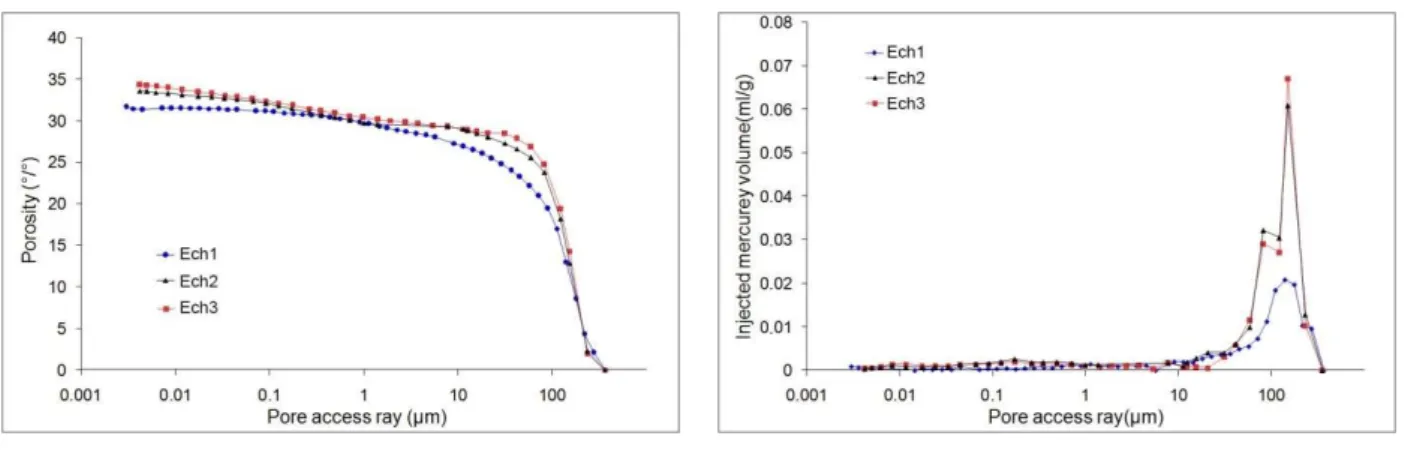
Total porosity measurements are performed by mercury injection on unoriented cylindrical samples of 20 mm diameter and 25 mm long. The sample Ech1 was cored from an unaltered block (taken from the quarry). Samples named Ech2 and Ech3 were to gather taken from an altered block with black crust and without black crust respectively. The analyses of mercury porosimetry are shown in Figures 7(a) and (b).
The curves show the existence of a bimodal porous network. A macroporosity domain represents about 90% of the total porous volume. The access threshold to this porous network is ranged between 200 and 10 µm (Figures 7(b)). These curves also show a microporous domain that constitutes about 10% of the pore volume, the access thresholds varying between 10 and 0.005μm. Total porosity of samples Ech1, Ech2 and
Ech3 are 32.63%, 34.14% and 35.07% respectively. In the microporosity and macroporosity interval, Ech1 sample has low porosity compared to samples Ech2 and Ech3. For the access rays between 0.2 and 2 µm and the access rays upper 200 µm, porosity is constant.
For the altered sample without crust (Ech3) we observe a strong increase in porosity in the intervals (0.005 µm, 0.2µm) and (30 µm,150µm) and a reduced porosity in the interval (2µm, 30µm).
However, the altered sample with crust presents a slight decrease in porosity in the microporous area (0.005µm, 0.2µm) and in the macroporous area (30µm,100µm).This can be attributed to a partial cementation of the intergranular space. The same phenomenon was observed by K. Beck on white limestone taken from a site in the Paris region [20]. These curves show an increase of 1% in the volume of the macropores (between 150 and 2 µm) and micropores (less than 0.2 μm).
The variation of porosity is same for samples covered and not covered by the black crust. The increase of the porosity is related to a broadening of the cavities and also to the increase of the number of cavities with the alteration. No porosity variation was observed for the access radius located between 0.2 and 2 µm. This may be due to the absence of accessible porosity in this class (unaltered zone). Consequently, the mercury porosity analysis shows several porosity classes which present different behaviors according to the access radius. This result is perfectly correlated with the SEM observations [9,14].
Macroporosity is induced by partial dissolution of cements, while microporosity (<0.2 µm) tend to be intragranular and is developed in primary and secondary grains. Although the difference between the curves of the samples with and without crust, is small, it could be attributed to a partial cementation of the porous network of secondary products. This phenomenon has been
observed by K. Beck and al. [20] on the Touraine tufa (France).
4.2.2. Orientation effect in the unaltered sample
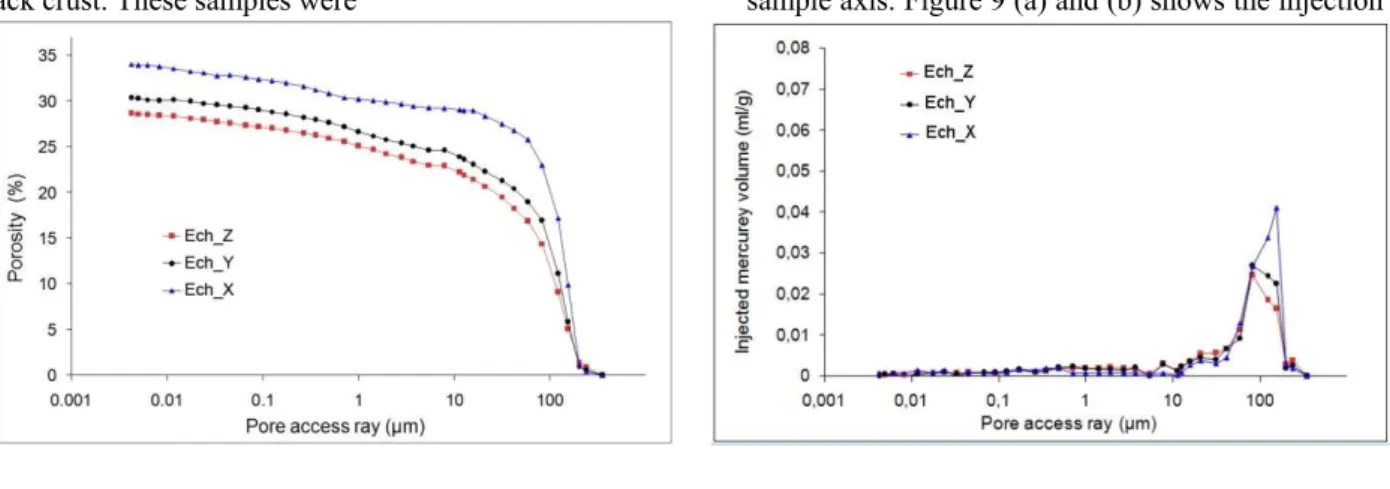
To test connectivity of the pore network according to the direction of injection, we consider three cylindrical samples (20 mm of diameter and 25 mm of high) named as Ech_X, Ech_Y and Ech_Z. Ech_Z is taken in a direction perpendicular to the stratification plane, while the others samples (Ech_X, Ech_Y) are cored in two perpendicularly directions lactated in the stratification plane. Subsequently, the three cylindrical samples are covered with the resin only on their lateral surfaces; in order inject mercury in direction parallel to the cylinder axis.
Figures 8 (a) and (b) present the results of mercury porosimetry analysis performed on the three unaltered samples. The allure of the injection curves is almost the same when the access radius is lower than 59 μm. Whereas, Figure 8(b) shows that the samples have relatively similar pore volumes. However, when the access radius becomes higher than 59 µm, the injected volume of mercury depends strongly on the sample direction. This difference is due to the fact that the proportion of macropores is the highest in the sample parallel to the stratification axis (Ech_X).
In addition, these curves show the presence of two different porosity domains. A macroporosity domain, in which the threshold access ray is between 59 µm and 200 µm, and a microporosity domain that corresponds to access rays ranged between 0.004 µm and 59 µm. The total porosities of these samples (Ech_X, Ech_Y, Ech_Z) are respectively 34.04%, 30.34% and 28.63%. It is clear that the unaltered sample (Ech_X) cored parallel to stratification has the highest porosity essentially in the macroporosity domain. However, the three samples present the same porosity in the microporosity domain and when access ray is higher than 200 µm.
4.2.3. Altered samples without crust and covered with resin
(a) (b)
Fig. - 7: Mercury porosimetry curves performed on unoriented and altered or unaltered samples (a) porosity spectrum depending on access diameter, (b) curves of volume increment depending on the access radius pores of samples.
Mercury porosimetry tests were performed on three test tubes of altered calcarenite after having cut their black crust. These samples were
cored perpendicularly to three faces (F2, F3, F4), arbitrarily chosen, from a large altered cubic block, taken from Chellah Roman monument. The samples
were then, covered with resin on their lateral faces, in order to have the direction of injection parallel to the sample axis. Figure 9 (a) and (b) shows the injection
curves obtained for these oriented samples, named respectively Ech_F2, Ech_F3 and Ech_F4.
Figure 9 (a) shows that injections curves are bimodal (two inflection points used to determine two
(a) (b)
Fig. - 8:Porosimetry curves representative the unaltered samples oriented and covered with resin (a) porosity spectrum depending on access diameter, (b) curves of volume increment depending on the access radius pores of samples.
(a) (b)
Fig. – 9: Porosities obtained on altered test tubes covered with resin and without black crust (a) porosity spectrum depending on access diameter, (b) curves of volume increment depending on the access radius pores of samples.
(a) (b)
Fig. – 10: porosities obtained for altered test tubes covered with resin and contain a black crust. (a) porosity spectrum depending on access diameter, (b) curves of volume increment depending on the access radius pores of samples.
thresholds of pores (59 µm and 0.4 µm). The curve (b) shows that the predominant access rays are located in the macroporous area with a much dispersed distribution. These curves indicate that the total porosity of the three samples Ech_F2, Ech_F3 and Ech_F4 are respectively 32.84%, 32.47% and 30.75%. The altered simple Ech_F4 has a lower porosity than the two other samples Ech_F2 and Ech_F3 that have very similar porosities. From this analysis we suggest that only Ech_F4 is perpendicular to the stratification plan.
4.2.4. Altered samples with crust and covered with resin Cylindrical test tubes of 2 cm in diameter and 2.5 cm of length were taken from three faces (F2, F3, and F4) of the altered block with black crust. These samples were covered with resin on their lateral surfaces. Then, the mercury is injected through the top surface which has the black crusting. This technique allows obtaining the distribution of thresholds access in the direction of injection [21]. These three altered samples with crust are called Ech_F2_Cr, Ech_F3_Cr and Ech_F4_Cr. The curves are shown in Figure 10 (a) and (b).
Figure 10 shows that the total porosity of the samples Ech_F2_Cr, Ech_F3_Cr and Ech_F4_Cr, are respectively 32.08%, 29.31% and 27.01%. We find that these threshold distribution curves show two different parts. For lower access rays 59 µm, the curves are approximately similar and their pore volumes are almost comparable. In the interval (59µm, 200µm) the pore volume distribution are relatively different.
A difference between the porosity spectra of the samples with or without crust is clearly visible in Figures 9 and 10; this means that the black crusting influences the fluid flow in porous media. Altered samples without crust have two pore thresholds in the macroporous area (59 µm) and in microporous area (0.4 µm); samples with black crust have a single pore threshold in the macroporous area (59 µm). Altered samples with or without crusts always retain mesoporosity area in the range (0.5µm, 10µm). Samples without crusts have very low porositiescompared to samples with crust; this decrease of connected porosity is produced by partial cementation of the intergranular space. The cementation prevents fluid flow inwardly of the material.
4.2.5. Evolution of porosity according to the sample alteration process
In the altered sample from the ancient city Romaine, three samples were cored at the surface, a depth of 2 cm and a depth of 8 cm. These samples are named respectively Ech_surf, Ech_2cm and Ech_8cm. The sample Ech_8cm is considered unaltered, will be compared to the unaltered sample Ech1. This characterization method examines evolution porosity from the surface to the inside of altered stone. Mercury injection curves of three samples are shown in Figure 11 (a) and (b). The curves show that total porosity of samples Ech_surf, Ech_2cm and Ech_8cm are respectively 34.36%, 34.90% and 32.87%.
We find that the sample taken at the depth of 8cm has the lowest porosity. It presents a mercury intrusion almost similar to that of the unaltered sample (Ech1). Porous media morphology of the sample near the surface (Ech_2cm) has been considerably modified. In fact, the curves show an increase in the macroporosity and the microporosity of 1% for access thresholds between 200 and 2 µm, and the access thresholds lower to 0.2 µm. The same phenomenon has been observed for Ech_surf sample with a slight decrease in porosity. This porous decrease is produced by partial cementation of the intergranular space. This has the effect of limiting the penetration of water into the stone. In addition, the presence of larger pores in the remainder of the sample facilitates the movement of water which may progress more rapidly, in accordance with the effect of the capillary pore size provided by the model of Washburn [22].
Fig. – 11: Porosity spectrum obtained using mercury injection porosimetry for three core samples: to the surface (Ech_surf), near the surface to 2cm (Ech_2cm) and a depth of 8 cm from the surface (Ech_8cm).
5. Conclusions
The observation by Scanning Electron Microscope (SEM) shows that the microstructure is characterized by inter and intragranular spaces with size and shape irregularities communicating by more or less wide connections. There is a compact arrangement of grains generating empty spaces, which are not occupied by minerals inducing a high porosity in the material. Porosity, relatively elongated, essentially locates between the primary particles and can be completely clogged by secondary precipitation.
The results of porosimetry analysis show that the process of alteration in monument Chellah Roman, has modified the porous structure. The porous media of altered calcarenite sample is bimodal, where two families of pores access ray coexist. Porosity changes are reflected in a different pore volume distribution depending on the access pore. Access to macropore volume (90%) is
controlled by thresholds between 200 and 10 µm, while micropore volume (10%) is controlled by thresholds between 10 and 0.005 μm. The low porosity of the unaltered sample is attributed to the presence of sparitic cement participating in partial
blockage of the intergranular porosity. The highest porosity of altered faces without crust is due to the increase of the intergranular space. The
development of the alteration in the samples with
and without crust results in increased intragranular microporosity and macroporosity induced by partial dissolution of cements. Decrease of porosity for the sample with crust compared to the sample without crust is due in particular to clay precipitation. Connected pore volumes are different for parallel and perpendicular samples to the bedding plane, which highlights a connectivity-dependent effect of the injection direction. This anisotropy of connectivity in porous network may be characteristic anisotropy of transfer properties (capillarity, evaporation, electrical resistivity, thermal conductivity ...). Indeed, different measurements make it possible to demonstrate an anisotropy of the material controlled by structures inherited from the sedimentary history of the material. They have provided additional information on the geometry of the porous network. These characteristics are decisive in the salt crystallization degradation process.
Experimental analysis and numerical modeling of the precipitation effects of salts on calcarenite specimens are currently being studied in the laboratory.
Acknowledgements
This work was supported by the French Moroccan cooperation within the project named: Toubkal/15/18 – Camus France:
32427VH.
REFERENCES
1. V. Cnudde, A. Cwirzen, B. Masschaele, P.J.s. Jacobs, “Porosity and microstructure characterization of building stones and concretes”. Engineering Geology, 2009, 103(3-4), 76.
2. D. Benavente, N. Cueto, J. Martinez-Martinez, M.A. Garcia del Cura, J.C. Canaveras “The influence of petrophysical properties on the salt weathering of porous building rocks” Environ Geology 2007, 52, 215 DOI 10. 1007/s00254-0475-y.
3. G. Andriani, N. Walsh., “Fabric, porosity and water permeability of calcarenites from Apulia (SE Italy) used as building and ornamental stone “ Bulletin of Engineering Geology and the Environment 2003, 62 (1), 77.
4. D. Benavente, M.A. Garcia Del Cura, R. Fort, S. Ordonez, “Durability estimation of porous building stones from pore structure and strength”, Engineering Geology, 2004, 74, 113.
5. B. Fitzner, K. Heinrichs, D. La Bouchadiere, “Damage index for stone monuments, Proceedings of the 5th International Symposium on the Conservation of Monuments in the Mediterranean Bassin, Sevilla, Spain”, 2000, 315.
6. Y. EL Rhaffari , M. Hraita, A. Samaouali, M. Boukalouch, Y. Geraud, “Thermal and petrophycal characteristics of Calcarenite Rocks used in the construction of Historical Monuments of Rabat”. Romanian Journal of materials 2014, 44(2), 153.
7. N. Zaouia,, M. EL wartiti , B. Baghdad, Superficial alteration and soluble salts in the calcarénite weathering. Case study of Almohade monuments in Rabat: Morocco. Environ Geol, 2005, 48, 742-747.
8. A. Samaouali, L. Laanab, M. Boukalouch, and Y. Géraud, “Porosity and mineralogy evolution during the decay process involved in the Chellah monument stones”, Environ Earth Sci, 2010, 59, 1171 DOI 10.1007/s 12665-009-0106-5.
9. H. Azouaoui, N. El Hatimi, N. EL YaminePlio-Quaternary formations of the Casablanca area (Morocco): sedimentological and geotechnical aspects. Bull Eng Geol Environ, 2000, 59, 59. 10. M. Akil, PhD Thesis, “Littoral quaternary deposits between
Casablanca and Beddouza: geomorphological and sedimentological studies” University Mohammed V Rabat (Morocco), p 419, (1990). 11. A. Rahmouni , A. Boulanouar, M. Boukalouch, A. Samaouali,
Y.Geraud, J. Sebbani, “Porosity, Permeability bulk density of rocks dans their relationships based on laboratory measuremants” RevistaPomana de Materiale/Romanian
Journal of Materials 2014, 44 (2), 147.
12. L. Asebry, C. Bucci, IZ. EL Amrani, R. franchi, F. Guerrera, M. Martin, C. Patamai,G. Raffaelli, P. Robles Marin, J. Tejera DE Leon, L. Tentoni. Etude intégrée de la dégradation des monuments historiques Romains et Islamiques de la ville de Rabat (Maroc) :Proposition de solutions durables de prévention et de restoration . Science and Technology for Cultural Heritage 2007, 16, 45. 13. A. Samaouali, L. Laânab, Y. Géraud, A. Nounah, M. Boukalouch ,
Expérimental study of chemical deterioration of Chellah monument stones. Phys. Chem. News 2008, 44, 103.
14. A. Samaouali, Phd Thesis, Processus d’altération et de transfert de fluide dans les Pierres calcarénites du monument Chellah- Rabat. University Mohammed V of RabatMorocco , 2011.
15. AFPC-AFREM, Detemination of apparent density and water porosity. Methodsrecommended for the sustainabilitymeasurements. Compte rendu des Journées techniques 1997, 11-12 décembre Toulouse France, pp 121124.
16. Y. Géraud, PhD Thesis, Déformation Thermomécanique et Porosité des Roches Granitiques: Evolution des Espaces Poreux, , Université de Marseille, Marseille, 1991.
17. F. Surma, PhD Thesis, Détermination de la Porosité de la Zone Endommagée autour d’une Faille. Rôle des Caractéristiques du Matériau (Minéralogie, Structure de Porosité, Caractéristiques Physiques) sur les Propriétés d’Echange Fluides Roche, Université Luis Pasteur, Strasbourg, 2003.
18. M. Rosener, PhD Thesis, Etude Pétrophysique et Modélisation des Effets des Transferts Thermiques entre Roche et Fluide dans le Contexte Géothermique de Soultz-Sous-Forêts, Université Luis Pasteur, Strasbourg, 2007.
19. P. Bousquie, PhD Thesis, Texture et Porosité des Roches Calcaires, Université Paris VI et Ecole des Mines de Paris, Paris, 1979. 20. K. Beck, PhD Thesis, Studies of hydrous properties and the
mechanisms of porous limestones deterioration, 2006 University of Orléans, Paris france.
21. Y. Géraud, P. Gavilio, Reconstitution du réseau poreux d’un échantillon décomprimé. Mise en évidence d’une anisotropie de connectivité, C.R. Acad. Sci. Paris, 2001, 331, pp.339-344. 22. E.W Washburn, Note on method of determining the distribution of
pores sizes in a porous material. Proc Nat AcadSci, 1921, 7, 115.