HAL Id: insu-02157141
https://hal-insu.archives-ouvertes.fr/insu-02157141
Submitted on 2 Dec 2020
HAL is a multi-disciplinary open access archive for the deposit and dissemination of sci-entific research documents, whether they are pub-lished or not. The documents may come from teaching and research institutions in France or abroad, or from public or private research centers.
L’archive ouverte pluridisciplinaire HAL, est destinée au dépôt et à la diffusion de documents scientifiques de niveau recherche, publiés ou non, émanant des établissements d’enseignement et de recherche français ou étrangers, des laboratoires publics ou privés.
Anezina Solomonidou, Alice Le Gall, M. J. Malaska, S. P. D. Birch, R. M. C.
Lopes, A. Coustenis, S. Rodriguez, S. D. Wall, R. J. Michaelides, M. R. Nasr,
et al.
To cite this version:
Anezina Solomonidou, Alice Le Gall, M. J. Malaska, S. P. D. Birch, R. M. C. Lopes, et al.. Spectral and emissivity analysis of the raised ramparts around Titan’s northern lakes. Icarus, Elsevier, 2020, 344 (July), pp.113338. �10.1016/j.icarus.2019.05.040�. �insu-02157141�
Spectral and emissivity analysis of the raised ramparts around Titan's northern lakes
A. Solomonidou, A. Le Gall, M.J. Malaska, S.P.D. Birch, R.M.C. Lopes, A. Coustenis, S. Rodriguez, S.D. Wall, R.J. Michaelides, M.R. Nasr, C. Elachi, A.G. Hayes, J.M. Soderblom, A.M. Schoenfeld, C. Matsoukas, P. Drossart, M.A. Janssen, K.J. Lawrence, O. Witasse, J. Yates, J. Radebaugh
PII: S0019-1035(18)30784-X
DOI: https://doi.org/10.1016/j.icarus.2019.05.040
Reference: YICAR 13338 To appear in: Icarus
Received date: 18 December 2018 Revised date: 9 April 2019 Accepted date: 29 May 2019
Please cite this article as: A. Solomonidou, A. Le Gall, M.J. Malaska, et al., Spectral and emissivity analysis of the raised ramparts around Titan's northern lakes, Icarus,
https://doi.org/10.1016/j.icarus.2019.05.040
This is a PDF file of an unedited manuscript that has been accepted for publication. As a service to our customers we are providing this early version of the manuscript. The manuscript will undergo copyediting, typesetting, and review of the resulting proof before it is published in its final form. Please note that during the production process errors may be discovered which could affect the content, and all legal disclaimers that apply to the journal pertain.
ACCEPTED MANUSCRIPT
Spectral and emissivity analysis of the raised ramparts around Titan’s
northern lakes
A. Solomonidou1,2,3*, A. Le Gall4, M.J. Malaska5, S.P.D. Birch6, R.M.C. Lopes5, A. Coustenis3, S. Rodriguez7, S.D. Wall5, R.J. Michaelides8, M.R. Nasr9, C. Elachi2, A.G. Hayes6, J.M. Soderblom9, A.M.Schoenfeld10, C. Matsoukas11, P. Drossart3, M.A. Janssen5, K.J. Lawrence5, O. Witasse12, J. Yates1, J. Radebaugh13
1
European Space Agency (ESA), European Space Astronomy Centre (ESAC), Villanueva de la Canada, Madrid, Spain;
2California Institute of Technology (Caltech), Pasadena, California, USA;
3LESIA - Observatoire de Paris, CNRS, UPMC Univ. Paris 06, Univ. Paris-Diderot, Meudon, France; 4LATMOS/IPSL, UVSQ Université Paris-Saclay, Sorbonne Université, CNRS, Guyancourt, France; 5Jet Propulsion Laboratory, California Institute of Technology, California, USA;
6
Cornell University, Ithaca NY, USA;
7Institut de Physique du Globe de Paris (IPGP), CNRS-UMR 7154, Université Paris-Diderot, Paris,
France;
8Department of Geophysics, Stanford University, Stanford, California, USA;
9Department of Earth, Atmospheric and Planetary Sciences, MIT, Cambridge, MA 02139-4307, USA; 10
Department of Earth, Planetary, and Space Sciences, University of Calilfornia, Los Angeles, California, USA;
11KTH-Royal Institute of Technology, Stockholm, Sweden;
12European Space Agency (ESA), European Space Research and Technology Centre (ESTEC), Noordwijk,
Netherlands;
13Department of Geological Sciences, Brigham Young University, Utah, USA.
Corresponding author: A. Solomonidou, European Space Agency, Madrid, Spain (Anezina.Solomonidou@esa.int)
Key points: Titan surface, Titan hydrology, Radar observations, Spectroscopy, Radiative transfer
Abstract
Some of Titan’s small northern hemisphere lakes show raised rampart features (which are distinct from raised rims), and appear as SAR-bright mound-like annuli extending away from the lake for up to tens of kilometers from the shoreline. We investigate the infrared and microwave characteristics of these features using Cassini Visual and Infrared Mapping Spectrometer (VIMS) and RADAR data. A spectral comparative analysis is performed among the lakes, their ramparts, and the surrounding regions. We overcome the profound difference in spatial resolution between VIMS and SAR data by using a method that provides overlays between the spectral images and SAR, thus enabling the correct selection of VIMS pixels. The surface properties of the selected areas are obtained using a radiative transfer analysis on the selected VIMS pixels, in addition to emissivity obtained from the RADAR in radiometry mode. Analysis of these combined and
co-ACCEPTED MANUSCRIPT
registered data provides constraints for the formation mechanism(s) of raised ramparts. The results show that the emissivity of the raised ramparts is close to that of Titan’s labyrinthic terrains and to that of empty lake floors in the northern polar regions. This is confirmed by the VIMS analysis that also shows that the infrared spectral response of the raised ramparts is very similar to that of some empty lake floors. This suggests that both areas are made from or are covered by a similar material. In addition, two out of the eight lakes with raised ramparts show spectral differences at three specific wavelengths, 1.6, 2.0, and 5.0 μm, between the ramparts and the surrounding terrain. We hypothesize that this could be due to some component, or mixture of components in the ramparts that is less absorbent at these specific wavelengths, or it could be an effect of different grain sizes. These observations provide first insights into the possible mechanisms leading to the formation of the raised ramparts that are discussed here.
1. Context and observations
Cassini observations of Titan have revealed ~650 polar lakes (lacus) and seas (mare), with more than 200 being empty and more than 300 filled or partially filled (e.g., Stofan et al., 2007; Hayes et al., 2008; Hayes, 2016; Birch et al., 2017). Modeling, supported by Cassini data, suggest the liquid composition to be a mixture of methane/ethane with the contribution of dissolved nitrogen (e.g., Sagan and Dermott, 1982; Lunine et al., 1983; Brown et al., 2008; Mastroguiseppe et al., 2014; 2018). The northern seas, Ligeia Mare, Kraken Mare, and Punga Mare, form the largest liquid-filled bodies on Titan, along with the largest lakes Jingpo, Hammar, and Ontario Lacus. These largest liquid bodies are all characterized as liquid-filled broad depressions (Hayes et al., 2018).
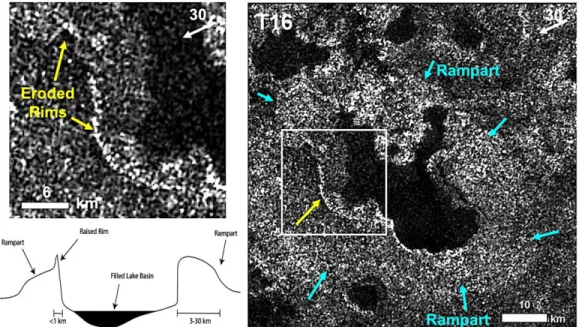
Most of Titan’s smaller lakes are characterized as sharp-edged depressions (SEDs), which appear either empty or filled, and have been extensively discussed in Hayes (2016), Hayes et al. (2018), and Birch et al. (2018). These studies showed that the SEDs have relatively flat floors, significant depths (up to 600 m), and are partly or wholly encircled by narrow (typically ~1 km or less extending from the lake edge), hundred-meter-high, rims. SEDs also show no evidence of inflow or outflow channels at the resolution of the Cassini RADAR (Elachi et al., 2004) in SAR mode (Hayes et al., 2008; 2016; Hayes, 2016; Michaelides et al., 2016; Birch et al.; 2018), which varies but is always >300 m. A small subset of the north polar SEDs (<10) also show raised rampart features (Fig. 1; 2). Rampart features are defined as SAR-bright mound-like annuli extending away from the lake for up to tens of kilometers from the shoreline (see Fig. 1). Unlike the narrow, steep, raised rims, these broad SAR-bright ramparts completely encompass their host lake. As discussed extensively in previous work (Hayes, 2016; Hayes et al., 2017; Birch et al., 2018), lake formation, in general, remains an open problem. The formation of the ramparts around a subset of the lakes is similarly unconstrained. As these lakes are unique among Titan’s many polar lakes, these ramparts may yield important clues to the formation of Titan’s lakes more generally.
ACCEPTED MANUSCRIPT
Figure 1. Right: T16 SAR image of Viedma Lacus. Cyan arrows denote portions of the perimeter of the rampart feature, a SAR-bright apron that encloses nearly the entire lake. Yellow arrows denote portions of the raised rim. Top Left: Zoom into the raised rim portion of the lake perimeter, denoted by the white box in the right image. The rim appears eroded in multiple sections; Bottom Left: Conceptual model of a lake with a rampart and rim (not to scale). Rims are confined to within a few kms of the lake, and form higher slopes, while ramparts enclose the lake and form broader (up to 10’s of kms) mounds.
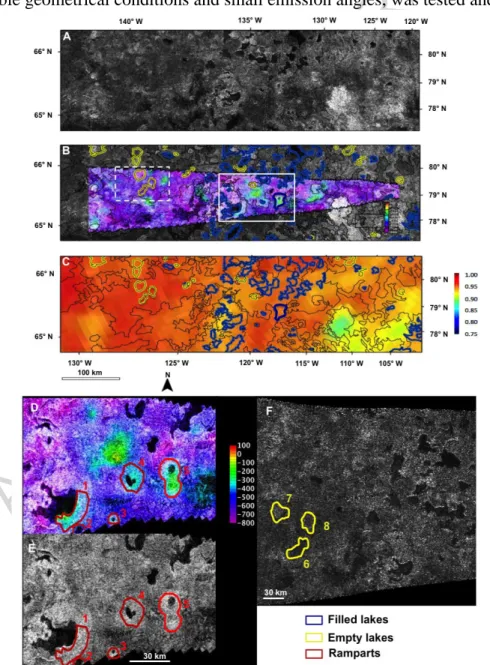
The Cassini flybys T16 (July, 2006), T19 (October, 2006), T91 (May, 2013), and T92 (July, 2013) made RADAR observations in SAR mode of portions of the region where five of Titan’s northern lakes feature raised ramparts. Figure 2A shows SAR data of a number of those filled and empty lakes with raised ramparts; Fig. 2B shows their topography overlain on SAR, annotated with mapped terrain contacts; and Fig. 2C shows their emissivity overlain on SAR. The digital terrain model (DTM) was generated from the overlap of the T16 and T19 SAR observations (Kirk et al., 2007; Malaska et al., 2014).
In this study, we focus on eight lakes. Five filled lakes with raised ramparts are shown in Figs. 2D and 2E for which we have detailed views of their topography, multiple SAR and radiometry images, and high resolution Visual and Infrared Mapping Spectrometer (VIMS) observations (Brown et al., 2004). Their ramparts surround the lakes, and are 200–300 m above the surrounding terrain. Depending on the lake, they extend outward from 3 to 30 km away from the lake perimeter. The ramparts are not equidistant from entire shorelines, but are coincident with radar-brighter areas surrounding the lakes. The vertical resolution (~150 m; Corlies et al., 2017) of the DTM, however, is such that the high backscatter areas surrounding some lakes do not always appear elevated. We also study three empty lakes for comparison (Fig. 2F).
The selection of these five lakes was made based on the availability of high-resolution VIMS data for which quality SAR data exist; VIMS cube 1764550739 was acquired above the five selected lakes during flyby T96 in December 2013.
ACCEPTED MANUSCRIPT
For the analysis of the three empty lakes, we use VIMS cube #1767299935 (T97, January 2014). The selected VIMS cubes were compatible with our plane-parallel radiative transfer (RT) approximation (Hirtzig et al., 2013; Solomonidou et al., 2014; 2016; 2018) used for the analysis of VIMS data, as they have adequate resolution for the selection of separate pixels for the lakes, ramparts, and surroundings (Table 1); and also have both incidence (i) and emission (e) angles lower than 60°.
Furthermore, this analysis and application of the RT code on Cassini VIMS data has been performed in several previous publications (e.g. Solomonidou et al., 2016; Brossier et al., 2018; Lopes et al., 2018) while in Solomonidou et al. (2018) the code was successfully applied to higher latitudes compared to previous studies. Hence, in Solomonidou et al. (2018) the proper application of the plane-parellel code for high latitude areas (for example North Afekan area at ~ 60°N and Poritrin Planitia at ~50°N), with favorable geometrical conditions and small emission angles, was tested and verified.
ACCEPTED MANUSCRIPT
DTM overlain on SAR, annotated with mapped terrain contacts. White solid (for filled lake) and white dashed (for empty lakes) rectangules correspond to zoomed areas shown in D, E, & F; (C) Emissivity overlain on SAR, annotated with mapped terrain contacts (for B and C, blue and yellow outlines indicate filled and empty lakes respectively); (D, E) Detailed view of topography and SAR, ramparts marked with red lines; (F) SAR image of empty lakes (marked with yellow).
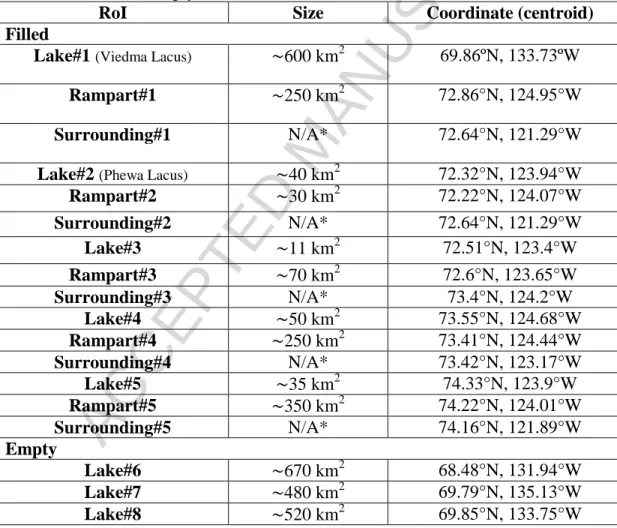
Table 1. Regions of Interest (RoI) for the lakes (filled and empty; including names when available), their ramparts, and surrounding areas, size of areas, and coordinates. The VIMS cube used to study the filled lakes (1764550739) was acquired on flyby T96 (December 2013), with i: 59º, e: 16º, α (phase angle): 53º and spatial scale of 4.9 km/pixel. The VIMS cube for the empty lakes (1767299935) was acquired on flyby T97 (January 2014), with i: 55º, e: 6º, α: 56º and spatial scale of 21 km/pixel. The SAR image in use is from flyby T19 (October 2006). In our VIMS analysis we used one pixel for every region of interest which corresponds to a surface area of 24 km2 for the filled lakes and 462 km2 for the empty lakes.
RoI Size Coordinate (centroid)
Filled
Lake#1 (Viedma Lacus) ~600 km2 69.86ºN, 133.73ºW
Rampart#1 ~250 km2 72.86°N, 124.95°W
Surrounding#1 N/A* 72.64°N, 121.29°W
Lake#2 (Phewa Lacus) ~40 km2 72.32°N, 123.94°W
Rampart#2 ~30 km2 72.22°N, 124.07°W Surrounding#2 N/A* 72.64°N, 121.29°W Lake#3 ~11 km2 72.51°N, 123.4°W Rampart#3 ~70 km2 72.6°N, 123.65°W Surrounding#3 N/A* 73.4°N, 124.2°W Lake#4 ~50 km2 73.55°N, 124.68°W Rampart#4 ~250 km2 73.41°N, 124.44°W Surrounding#4 N/A* 73.42°N, 123.17°W Lake#5 ~35 km2 74.33°N, 123.9°W Rampart#5 ~350 km2 74.22°N, 124.01°W Surrounding#5 N/A* 74.16°N, 121.89°W Empty Lake#6 ~670 km2 68.48°N, 131.94°W Lake#7 ~480 km2 69.79°N, 135.13°W Lake#8 ~520 km2 69.85°N, 133.75°W
ACCEPTED MANUSCRIPT
2. Process and method of analysis
2.1 VIMS and SAR overlapping
To maximize the information we can obtain from the Cassini VIMS and SAR data, we overlayed the SAR and VIMS images. This allows us to extract the morphological information from SAR images and the spectral information from VIMS data. These data, however, have very different resolutions. To address this we used the SAR images to determine the fraction of an individual VIMS pixel that contains each unit type (lake, rampart, surrounding), and assume linear spectral mixing. More details of this method are described in Solomonidou et al. (2018). The same technique was used by Bonnefoy et al. (2016) to isolate VIMS spectra of Titan’s equatorial dunes.
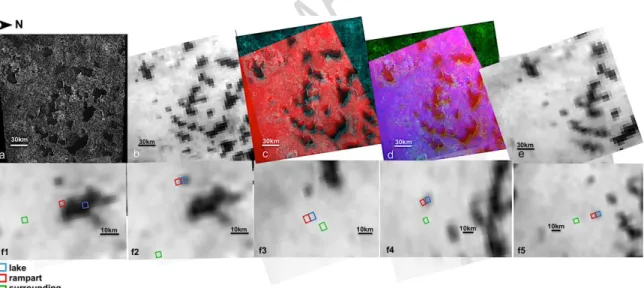
Figure 3a shows the portion of the SAR image that corresponds to the VIMS cube (Fig. 3b). Figures 3c and 3d show the SAR and VIMS overlay on RGB (R: 2.03 μm, G: SAR, B: SAR for 3c; R: 1.28 μm, G: SAR, B: 2.03 μm for 3d) and Fig. 3e shows the map projection and resolution matching of VIMS at 2.03 μm over the original SAR resolution. The map and resolution matching were done by upsampling the original VIMS at 2.03 μm image and moving its pixels, using cubic convolution interpolation, to match the SAR resolution and map projection. Figures 3f1–f5 show the pixel selections of the RoIs described in Table 1 (lakes, ramparts, surroundings). We used the same method for the selection of pixels for the empty lakes.
Figure 3. Steps of selection of pixels for the regions of interest for the 5 filled lakes: SAR portion (a) based on the full VIMS cube (b); combination of (a) and (b) using VIMS map projection and resolution matching with cubic convolution at 2.03 μm (c: R: 2.03 μm, G: SAR, B: SAR; and d: 1.28 μm, G: SAR, B: 2.03 μm), over the original VIMS cube (e). Pixel selection for lakes (blue), ramparts (red), and surroundings (green) #1-5 (Table 1).
In the following discussion, one should always keep in mind the penetration depths of VIMS and RADAR. VIMS observations sense only the top surface layer, on the order of tens of microns, whereas RADAR can penetrate on the order of 10s of cms into the surface, depending upon the material properties of the surface and close sub-surface.
ACCEPTED MANUSCRIPT
2.2 VIMS analysis
To derive spectral information for the lakes of interest, we analyzed the VIMS data using specific tools. VIMS has 256 IR bands, but there are ‘methane windows’, where the methane absorption is minimal, and thus the surface can be observed. Windows are centered at 0.93, 1.08, 1.27, 1.59, 2.03, 2.69–2.79, and 5.00 μm (e.g., Soderblom et al., 2007). For our analysis, we use a radiative transfer (RT) code. To reproduce a VIMS spectrum, we estimate the atmospheric contribution to the VIMS data, and extract meaningful surface information through radiative transfer calculations, in which we use Huygens’s inputs and other parameters that simulate Titan’s conditions. Full descriptions of the Huygens’s and Titan’s inputs, in addition to details on the methodology and several applications on Titan’s surface regions, can be found in Solomonidou et al. (2014; 2016; 2018). In brief, our RT code, before extracting the surface albedo from the aforementioned methane windows, first isolates the atmospheric contributions from the deep wings and bands of methane absorption. We then adjust the single scattering albedo and phase function as derived by the Huygens Descent Imager/Spectral Radiometer (DISR) (aerosol model by Tomasko et al., 2008, adapted as in Hirtzig et al., 2013) and derive the associated extinction by shifting the vertical profile used as a reference, so that the code fits the methane bands, wings, and windows. Thereafter, we can estimate the haze contribution to the data and derive the surface albedos in the windows for the various regions of interest (Fig. 3f1–f5) in order to compare them. Caution is exercised, however, when using this model (or similar models) for times or locations that are significantly offset from the Huygens’s landing site and time. For that reason, our current analysis is focused in the intercomparison of pixels from one datacube which has very similar observational geometries thoughout its pixels and the atmospheric conditions are expected to be somehow homogeneous. The same applies for the datacube that includes the empty lakes which has very similar observational geometries as the one with the filled lakes, as shown in Table 1. In addition, we are taking into account a number of uncertainties at the 3σ level including the aerosol phase function, the aerosol vertical distribution, the aerosol forced single scattering albedo, the error due to the CH4 vertical
concentration profile, the CH4 linelist, and the CH4 far wing profile. Finally, we average
multiple spectra in order to enhance the signal-to-noise ratio without affecting radically the average gain in signal.
2.3 Emissivity analysis
In its passive mode, the Cassini RADAR operated as a radiometer at 2.2-cm wavelength (Janssen et al., 2009; 2016). It measured the thermal emission from the surface, which depends on the surface’s physical temperature (and is well known in the case of Titan, e.g., Jennings et al., 2016) and emissivity at 2.2 cm. Passive radiometry observations were always acquired concurrently to active radar measurements (the opposite is not true), thus where there is a SAR image there are also radiometry data.
However, the spatial resolution of the radiometry observations is much coarser than that of SAR images; it is limited by the real aperture of the radar antenna, which typically has ~10 km footprints during Titan flybys. The selected ramparts are at most a few tens
ACCEPTED MANUSCRIPT
of km wide, therefore the estimate of their emissivity is not straightforward and we rely on a method already used for estimating the emissivity of Titan’s crater rims (Werynski et al., 2019). This method accounts for the filling factor of the radiometry footprint by the feature of interest for each observation. A 100% filling factor means that the entire radiometry footprint is filled with the feature. However, such a factor is not often reached for small features. Therefore, for each observation, we have computed the percentage of areal coverage of the radiometry footprint by the raised rampart and the emissivity of the rampart is extrapolated for a filling factor of 100%, assuming a linear mixture of two types of terrain.
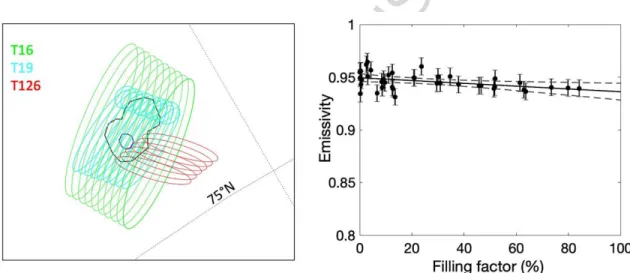
Figure 4 illustrates this approach as applied to the raised rampart #5. The estimated emissivity of this rampart is 0.936 0.008, ~1.5% lower than the surrounding terrain (0.949 0.004). The error bar is computed using Monte Carlo simulations with 1000 iterations and assuming errors are Gaussian and centered, and given with 2-sigma times the relative error on the datapoints (0.85%). The calibration of the radiometry observations is described in detail by Janssen et al. (2016); the net uncertainty in the absolute emissivity is, including the relative error of 0.85%, estimated to be 1.2%.
Figure 4. Left: Outlines of the raised rampart #5 (black) and of the lake it surrounds (blue) and radiometry footprints overlapping the rampart. Radiometry observations are from Titan flybys T16, T19, and T126 (April 22, 2017). Right: Emissivity of the raised rampart area as a function of the areal filling factor by the rampart of each radiometry footprint and associated linear fit (solid line) with its 95% confidence interval (dashed grey lines).The estimated emissivity value of the raised rampart #5 corresponds to the value given by the linear fit for a filling factor of 100%.
3. Results
Surface albedo RoI comparisons for the filled lakes
Using our radiative transfer code, we simulate the VIMS observations, varying the haze opacity (scaled to the DISR value inferred at the Huygens landing site (HLS)) to minimize the difference. From these simulations, we derive the haze opacity for each
ACCEPTED MANUSCRIPT
observation, with typical uncertainties of ±15%. This ±15% uncertainty in the haze opacity simulation for each observation is based on systematic uncertainties that dominate the error budget due to the far-wing profiles, the CH4 linelists, the haze
extinction fit and the vertical concentration, as well as the calibration and the data intrinsic noise. The nominal haze contributions to the VIMS spectra we study here are constantly +50% of the DISR haze value at HLS for all RoIs. This is consistent with observations and already indicated in the analysis of other Cassini datasets (i.e. CIRS data) during the 2006-2014 period which have shown persisting increased haze opacity at higher northern latitudes during the winter and spring season as compared to the equator (Jennings et al., 2012; Coustenis et al., 2013; 2016; Vinatier et al., 2015).
ACCEPTED MANUSCRIPT
Figure 5. Surface albedo absolute differences (i.e., subtracted values) between the filled lakes, the ramparts, and the surroundings (#1–5 as in Table 1) and the surface albedo extracted from the Huygens landing site that is used as ‘ground truth’.
We find that two of the five filled lakes have surface albedo differences among the three RoIs (lake, rampart, surrounding) (Table 1) (Fig. 5). The other three lakes (#3– 5), however, show no significant difference between the observed albedos of the different RoIs, which was expected as their size or location in the VIMS image made it difficult to accurately select the correct VIMS pixel. The ‘blue box’ selection shown in Figs. 3f4–f5 corresponds to the lake, which possibly includes terrain from the adjacent area of rampart (red box). In figure 3f3, it is obvious that the blue rectangle that marks the selection of the lake area does not correspond to a dark feature as one would expect and as appears to occur in the rest of the tested areas. Lake #3 is the smallest in size among our analyzed lakes (Table 1). This, in addition to the pixel grid of the datacube in use, seems to provide a ‘lake’ pixel that includes a large portion of the adjacent brighter rampart area, making the average spectra of the pixel increase in brightness. This problem was overcome thanks to the high resolution of the datacube in use, the size, and the location of lakes #1 and #2, which enabled the accurate selection of RoIs.
As expected for both lakes #1 and #2, the albedo of the ‘lake’ pixel is lower at every wavelength compared to the other two RoIs. The ‘rampart’ surface albedo has significantly lower albedo than the ‘surrounding’ albedo at 1.6, 2, and 5 μm for lake #1 and marginally lower albedo at 2 μm and 5 μm for lake #2.
Surface albedo RoI Comparison with the empty lakes
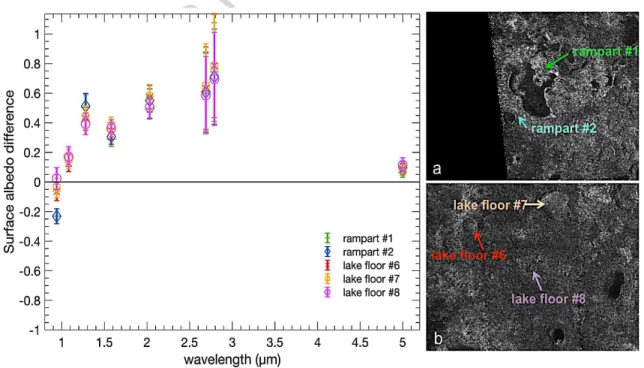
Following the comparative surface albedo analysis from the filled lakes’ RoIs, we performed an equivalent analysis between the ramparts of the filled lakes (lakes #1 and #2, Fig. 6a) and the lake floors of nearby empty lakes (#6–8, Table 1, Fig. 6b).
ACCEPTED MANUSCRIPT
Figure 6. Surface albedo absolute differences (with respect to the HLS albedo) for the ramparts of the filled lakes (a) and the floors of the empty lakes (b).
The results (Fig. 6) show that the spectral response of the raised ramparts is very similar to that of the bottom of the empty lakes. This is consistent with both areas being made of, or covered by, similar material. The nominal haze contribution to the data ranges from +65% to +80% of the DISR haze value at the HLS for the empty lakes, and is within the ±15% expected uncertainty. A rational next step would be to compare these albedos from the lake and empty lake RoIs with the results of our recent study (Solomonidou et al., 2018), where we extracted the surface albedos of the major geomorphological units of Titan’s mid-latitudes, such as mountains, labyrinths, different types of plains, dunes, and more. However, the difference in the atmospheric conditions (and haze opacity, particularly in the lower atmosphere) between the equator and the polar regions renders such a comparison extremely difficult and the associated errors would be considerable (Coustenis et al., 2010). We prefer to offer an inter-comparison between topical regions studied within the same geometry and atmospheric conditions, so as to avoid having to take into account systematic errors and focusing only on relative errors.
Microwave emissivity
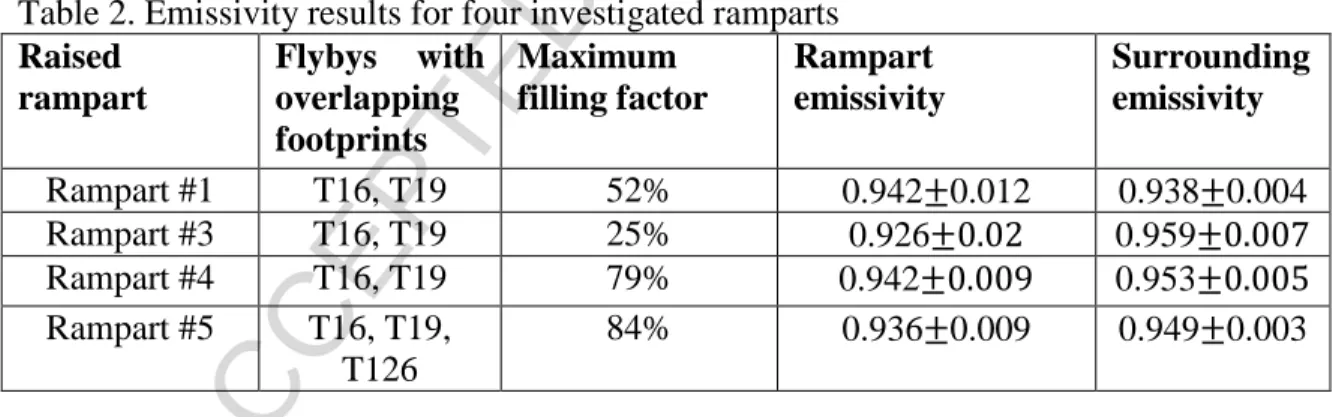
Table 2 summarizes the results of the emissivity analysis for the four investigated ramparts (the raised rampart #2 was too small to be characterized). The four features display very similar emissivities with an average value of ~0.94.
Table 2. Emissivity results for four investigated ramparts
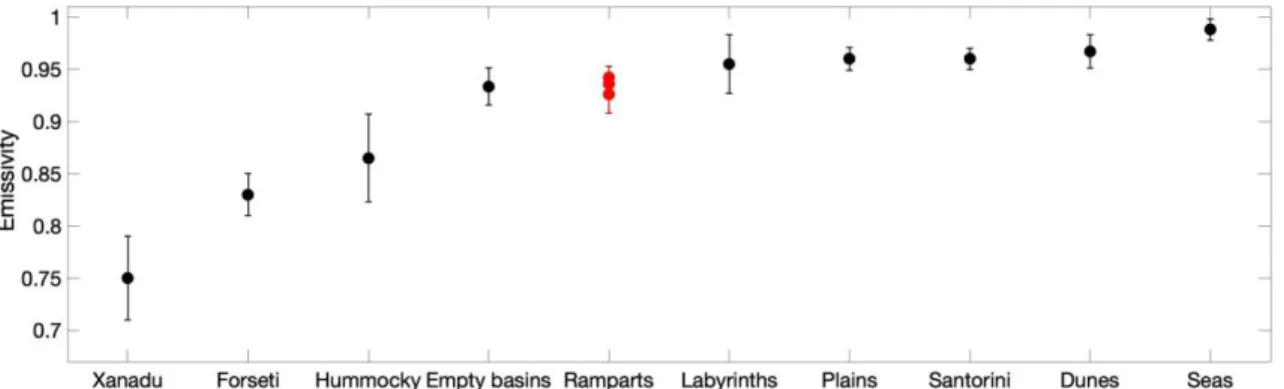
Raised rampart Flybys with overlapping footprints Maximum filling factor Rampart emissivity Surrounding emissivity Rampart #1 T16, T19 52% 0.942 0.012 0.938 0.004 Rampart #3 T16, T19 25% 0.926 0.959 Rampart #4 T16, T19 79% 0.942 0.953 Rampart #5 T16, T19, T126 84% 0.936 0.009 0.949 0.003 Figure 7 compares these values to the emissivity of the main geological units on Titan. The emissivity of raised ramparts is relatively high, consistent with a high degree of contamination of the surface/subsurface by organic materials. Low emissivity values suggest a higher abundance of water ice in the near-surface (Janssen et al., 2016). The emissivity of the raised ramparts falls between those of labyrinthic terrains and of empty basins, both of which may have formed via karstic dissolution (e.g., Malaska et al., 2010; Cornet et al., 2015; Birch et al., 2017; Hayes et al., 2017).
ACCEPTED MANUSCRIPT
Figure 7: Scale of emissivities on Titan. The emissivity of the raised ramparts (this work) is compared to that of Titan’s seas (Le Gall et al., 2016), dune fields (Lopes et al., 2016), plains (Lopes et al., 2016), labyrinthic terrains (Lopes et al., 2016), hummocky terrains (Lopes et al., 2016), Xanadu (Janssen et al., 2009), empty basins (this work) and of two crater rims: the rims of the fresh crater Forseti and that of the old Santorini (Werynski et al., 2019).
4. Implications and interpretations
We have investigated five northern filled lake regions with raised ramparts and three empty lakes from a nearby region, extracting spectral and emissivity information from Cassini VIMS and RADAR data.
After radiative transfer analysis of VIMS data, two out of five tested filled lake regions showed spectral differences at specific wavelengths (1.6, 2, and 5μm) between the lakes, their raised ramparts, and their surroundings. This suggests either a compositional or grain size difference between the raised ramparts and their surroundings. This result is consistent with the findings in Michaelides et al. (2016) who noted relative differences in dielectric constant and volumetric scattering behavior between empty lake basin floors and their surroundings. Relative differences in dielectric constant were attributed to differences in bulk material composition of the empty lake basin floors and their surroundings, while relative differences in volumetric scattering behavior were attributed to relative differences in porosity or surface saturation fraction. Furthermore, our analysis of the empty lakes showed that their floors present very similar spectral responses to those of the raised ramparts of the filled lakes, suggesting that both types of feature (empty lake floors and ramparts) are made of or coated by similar material.
The emissivity of the raised ramparts is relatively high for the standards on Titan and is similar to that of the empty basins. This, combined with the VIMS results, suggests that the ramparts and the empty lake floors may have the same composition. The emissivity of the ramparts is also close to that of the labyrinth terrains and plains which points to a composition enriched in organics rather than water ice, and thus to a photochemical origin of the material the ramparts are made of (rather than derived from the primordial water ice crust). Additionally, the radar brightness of the raised rampart also point to a moderate to high contamination by organics.
However, the lakes we examined in this work are just a small subset of all Titan’s lakes that, unlike the majority of lakes, show the unique feature of ramparts. Currently, a number of plausible theories for the formation of the ramparts have been suggested
ACCEPTED MANUSCRIPT
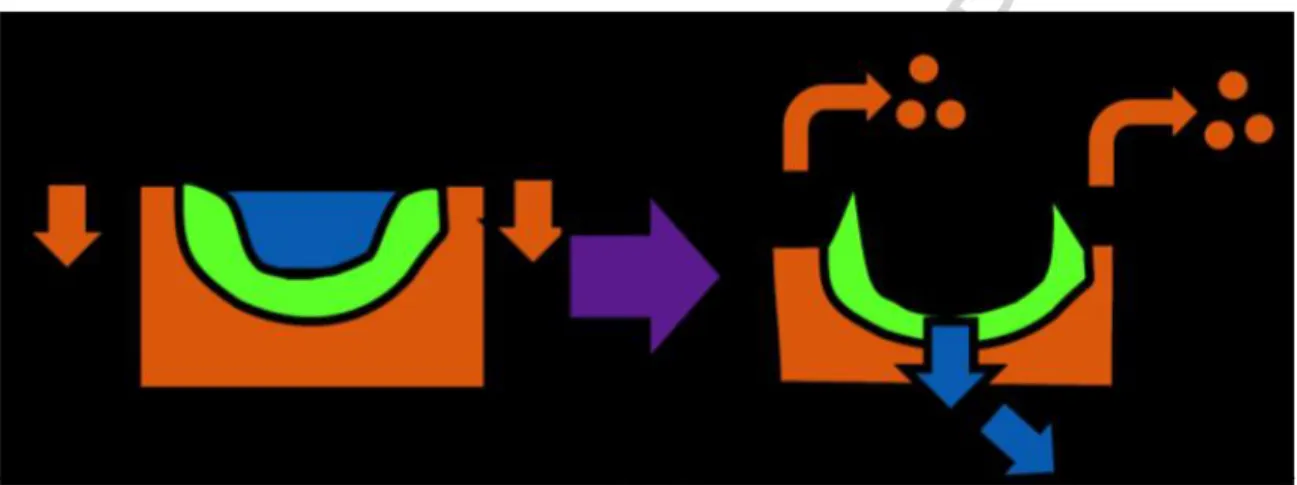
(Wood et al., 2007; 2010, Malaska et al., 2014; Hayes, 2016; Birch et al., 2018; Hayes et al., 2018) including: ‘Eroded diapirs’, ‘Eroded spring mounds’, ‘Maars (calderas)’, ‘Cryovolcanism’, ‘Impact Cratering’, ‘Evaporitive rim stone deposits’, and ‘Karst-hardened post-deflation remnants’ (descriptions in Hayes, 2016; Birch et al., 2017). Two aforementioned hypotheses that might fit the rampart formation include the ‘Eroded spring mound’ mechanism (Hayes et al., 2017) in which the difference in elevation between the empty lake floors and the filled lakes is suggestive of a subsurface phreatic surface; and the karst-hardening post-deflation remnant hypothesis, where temporal variation of this phreatic surface would be consistent with the results of this current work (Fig. 8).
Figure 8. Scheme showing the three different phases of the ‘karst-hardened post-deflation remnant’ theory: accumulation, case hardening, and deflation that form the raised ramparts (green), on top of the crust (orange) after the lake liquid (blue) percolates into the subsurface.
Further, the ramparts appear to always completely surround their host lakes. This is different from the raised rims, which in many cases, are eroded away in many places, with only a few remnant highs remaining (Birch et al., 2018). The consistent “completeness” of the ramparts suggest that they may be less degraded than the raised rims.
This observation, combined with VIMS and radiometry analyses, provides an additional constraint on the formation mechanism of the rampart features that may help distinguish the many above hypotheses. Though the exact formation of either feature is not known, our results suggest two possible end-member formation scenarios. If the rims are made of weaker materials than the ramparts, we would conclude that the ramparts are comparatively old. Following the formation of the lake, a mechanism emplaces the rampart around the lake’s perimeter. Subsequently, the rim is emplaced on top of the rampart, though, being of weaker material, is not able to maintain its relief. The ramparts meanwhile, retain their morphology. This would be consistent with previous studies of Titan’s lakes, that suggest that rim formation is tied to the retreat of the lake perimeters via scarp retreat, and that the process may still be ongoing (Hayes et al., 2017).
If the rims and ramparts are the same material, which is the same material as the floors of empty lakes, then the rims may be comparatively old. In this scenario, if the lake floors are representative of the bulk plains materials into which Titan’s lakes form (Birch et al.,
ACCEPTED MANUSCRIPT
2017), then after (or during) the formation and growth of the lake basin, residual material is also ‘constructed’ first into rim feature, and then later into the larger rampart features. This would also imply that the lakes with ramparts are among the youngest on Titan, where they have not yet had their rampart removed. For either scenario, however, the exact mechanism remains ambiguous, though the similar compositions of lake floors and the ramparts is consistent with formation via karst-hardening (Fig. 8). In this hypothesis, an evaporitic mineral may percolate in and cement the lakes immediate surroundings (sides and bottoms) and cause induration of these surrounding sediments. This hypothesis requires regional landscape deflation with removal of less resistant materials. After landscape deflation, the indurated sediments stand proud above the deflated terrain. Thus the ramparts could have a similar compositional makeup of the lake bottoms. Additionally, empty lake formation mechanisms could have both physical and chemical effects and the current dataset is not sufficient to differentiate the two effects. It is also possible that a combination of the two effects is occurring, with both chemical and physical manifestations during lake drying, as is seen in many salt pans on Earth.
Even though several theories have been suggested, it is difficult to distinguish among the plausible mechanisms and provide a preferred model for the formation of the ramparts with the current data. The absence of full compositional interpretations and the limited resolution of the VIMS and RADAR data limits the detailed geological interpretation of these unique features and thus a specific material mixture for the regions cannot be defined neither can a complete interpretation on a formation mechanism be provided. Nevertheless, our analysis will eventually lead to the comparison and match of the extracted surface albedos with a number of materials expected to be present on the surface of Titan in a similar fashion as in Solomonidou et al. (2018) where we provided insights on the possible major constituents for various Titan geomorphological units around latitudes 60°S-60°N. We have not applied this analysis yet on Titan’s polar regions and specifically on the lakes in this study because the lakes involve a set of very different materials from the ones found in the mid-latitudes or dry land. We are working currently on such database enhancement and future interpretations and aim to present in a forthcoming publication the results.
Our work provides new results that show that the raised ramparts exhibit spectral and emmisivity characteritics that are generally distinct from the surrounding terrain. The unit also presents many similarities to those of the floors of empty lakes. Both units are probably made or covered by the same material indicating a connection in their formation. Current and future work on the lakes and ramparts aim to interpret compositionally these areas and comprehend their different stages of formation and the interactions with the surroundings.
Acknowledgements
All Cassini data used in this article can be accessed in the Planetary Data Systems (PDS). This research was partly supported by the NASA Astrobiology Institute through its JPL-led project entitJPL-led Habitability of Hydrocarbon Worlds: Titan and Beyond. This research was partly supported by the Cassini Data Analysis and Participating Scientists Program (CDAPS) grant #NH16ZDA001N to RL. AS is supported by a European Space Agency (ESA) Research Fellowship at the European Space Astronomy Centre (ESAC), in
ACCEPTED MANUSCRIPT
Madrid, Spain. ALG and SR are supported by IUF (Institut Universitaire de France). This work was partly conducted at Jet Propulsion Laboratory (JPL) and the California Institute of Technology (Caltech) under contract with NASA. © 2018 California Institute of Technology. Government sponsorship acknowledged.
References
Birch, S.P.D., A. G. Hayes, W. E. Dietrich, A. D. Howard, C. S. Bristow, M. J. Malaska, J. M. Moore, M. Mastrogiuseppe, J. D. Hofgartner, D. A. Williams, O. L. White, J. M. Soderblom, J. W. Barnes, E. P. Turtle, J. I. Lunine, C. A. Wood, C. D. Neish, R. L. Kirk, E. R. Stofan, R. D. Lorenz, and R. M. C. Lopes (2017). Geomorphologic mapping of titan’s polar terrains: Constraining surface processes and landscape evolution. Icarus, 282, 214-236.
Birch, S.P.D., Hayes, A.G., Poggiali, V., Hofgartner, J.D., Lunine, J.I., Malaska, M.J., Wall, S., Lopes, R.M.C., White, O. (2018). Raised Rims around Titan’s Sharp-Edged Depressions. Geophysical Research Letters.
Bonnefoy, L.E., Hayes, A.G., Hayne, P.O., Malaska, M.J., Le Gall, A., Solomonidou, A., Lucas, A. (2016). Compositional and spatial variations in Titan dune and interdune regions from Cassini VIMS and RADAR. Icarus, 270, 222-237.
Brown, R.H., et al. (2004). The Cassini Visual and Infrared Mapping Spectrometer (VIMS) investigation. Space Sci. Rev. 115, 111–168.
Brown, R.H., Soderblom, L.A., Soderblom, J.M., Clark, R.N., Jaumann, R., Barnes, J.W., Sotin, C., Buratti, B., Baines, K.H., Nicholson, P.D. (2008). The identification of liquid ethane in Titan’s Ontario Lacus. Nature, 454, 7204, 607-610.
Corlies, P., Hayes, A. G., Birch, S. P. D., Lorenz, R., Stiles, B. W., Kirk, R., Poggiali, V., Zebker, H., Iess, L. (2017). Titan's Topography and Shape at the End of the Cassini Mission. Geophysical Research Letters, 44, 23, 11,754-11,761.
Cornet, T., . Cordier, T. L. Bahers, O. Bourgeois, C. Fleurant, S. L. Mou elic, and N. Altobelli (2015). issolution on Titan and on Earth: Toward the age of Titan’s karstic landscapes. Journal of Geophysical Research (Planets), 120, 1044-1074.
Coustenis, A., Jennings, D.E., Nixon, C. A., Achterberg, R.K., Lavvas, P., Vinatier, S., Teanby, N.A., Bjoraker, G.L., Carlson, R.C., Piani, L., Bampasidis, G., Flasar, F.M., Romani, P.N. (2010). Titan trace gaseous composition from CIRS at the end of the Cassini-Huygens prime mission. Icarus, 207, 461-476.
Coustenis, A., Bampasidis, G., Achterberg, R.K., Lavvas, P., Jennings, D.E., Nixon, C. A., Teanby, N.A., Vinatier, S., Flasar, F.M., Carlson, R. C., Orton, G., Romani, P. N., Guandique, E. A., Stamogiorgos, S (2013). Evolution of the Stratospheric
ACCEPTED MANUSCRIPT
Temperature and Chemical Composition over One Titanian Year. Astrophysical Journal, 779, 177.
Coustenis, A., Jennings, D.E., Achterberg, R.K., Bampasidis, G., Lavvas, P., Nixon, C. A., Teanby, N.A., Anderson, C., Cottini, V., Flasar, F.M (2016). Titan's temporal evolution in stratospheric trace gases near the poles. Icarus, 270, 409-420.
Elachi, C., Allison, M. D., Borganelli, L., Encrenaz, P., Im, E., Janssen, M. A., et al. (2004). Radar: The Cassini Titan Radar Mapper. Space Science Reviews, 115, 71–110.
Hayes, A. G., O. Aharonson, P. Callahan, C. Elachi, Y. Gim, R. Kirk, K. Lewis, R. Lopes, R. Lorenz, J. Lunine, K. Mitchell, G. Mitri, E. Stofan, and S. Wall. (2008). Hydrocarbon lakes on Titan: Distribution and interaction with a porous regolith. Geophysical Research Letters, 35, L09204.
Hayes, A. G. (2016). The Lakes and Seas of Titan. Annual Review of Earth and Planetary Sciences, 44, 57-83.
Hayes, A. G., Birch, S. P. D., Dietrich, W. E., Howard, A. D., Kirk, R. L., Poggiali, V., Wood, C. A. (2017). Topographic constraints on the evolution and connectivity of Titan’s lacustrine basins. Geophysical Research Letters, 44, 11,745–11,753.
Hayes, A.G., R.D. Lorenz, and J.I. Lunine (2018). A post-Cassini view of Titan’s methane-based hydrologic cycle. Nature Geoscience, 11, 306-313.
Hirtzig, M., et al. (2013), Titan’s surface and atmosphere from Cassini/VIMS data with updated methane opacity, Icarus, 226, 470–486.
Kirk, R.L., Howington-Kraus, E., Stiles, B. W., Hensley, S., Mitchell, K. L. (2007). Titan's Topography from Stereoscopic Radar Images. American Astronomical Society, DPS meeting #39, id.57.04; Bulletin of the American Astronomical Society, 39, 532.
Janssen, M. A., Le Gall, A., Lopes, R. M., Lorenz, R. D., Malaska, M. J., Hayes, A. G., et al. (2016). Titan’s surface at 2.18-cm wavelength imaged by the Cassini RADAR radiometer: Results and interpretations through the first ten years of observation. Icarus, 270, 443–459.
Janssen, M. A., Lorenz, R. D., West, R., Paganelli, F., Lopes, R., Kirk, R., et al. (2009). Titan’s surface at 2.2-cm wavelength imaged by the Cassini RADAR radiometer: Calibration and first results. Icarus, 200, 222–239.
Jennings, D. E., Anderson, C. M., Samuelson, R. E., Flasar, F. M., Nixon, C. A., Kunde, V. G., Achterberg, R. K., Cottini, V., de Kok, R., Coustenis, A., Vinatier, S., Calcutt, S. B (2012). Seasonal Disappearance of Far-infrared Haze in Titan's Stratosphere. Astrophysical Journal Letters, 754, L3.
ACCEPTED MANUSCRIPT
Jennings, D. E., V. Cottini, C. A. Nixon, R. K. Acterberg, F. M. Flaser, V. G. Kunde, P. N. Romani, R. E. Smauelson, A. Mamoutkine, N. J. P. Gorius, A. Coustenis, and T. Tokano (2016). Surface temperatures on Titan during northern winter and spring. Astrophysical Journal Letters, 816, L17.
Le Gall, A.; Malaska, M. J.; Lorenz, R. D.; Janssen, M. A.; Tokano, T.; Hayes, A. G.; Mastrogiuseppe, M.; Lunine, J. I.; Veyssière, G.; Encrenaz, P.; Karatekin, O. (2016). Composition, seasonal change, and bathymetry of Ligeia Mare, Titan, derived from its microwave thermal emission. Journal of Geophysical Research (Planets), 121, 233-251.
Lopes, R. M. C., Malaska, M. J., Solomonidou, A., LeGall, A., Janssen, M. A., Neish, C., et al. (2016). Nature, distribution, and origin of Titan’s undifferentiated plains (“Blandlands”). Icarus, 270, 162–182.
Lunine, J.I., Stevenson, D.J., Yung, Y.L. 1983. Ethane ocean on Titan. Science 222(4629), 1229–1230.
Malaska, M. et al., (2010). Identification of karst-like terrain on Titan from valley analysis. Lunar Planet. Sci. XLI. Abstract #1544.
Malaska, M.J., Mitchell, K., Hayes, A., Kirk, R., Ford, D. (2014). Possible mechanisms for creating raised ramparts around Titan's lakes. Oral presentation at the 3rd Titan Through Time workshop. John Hopkins University – Applied Physics Laboratory, Laurel, Maryland
Mastrogiuseppe, M., V. Poggiali, A. Hayes, R. Lorenz, J. Lunine, G. Picardi, R. Seu, E. Flamini, G. Mitri, C. Notarnicola, P. Paillou, and H. Zebker (2014). The bathymetry of a Titan sea. Geophysical Research Letters, 41, 1432-1437.
Mastrogiuseppe, M.; Hayes, A. G.; Poggiali, V.; Lunine, J. I.; Lorenz, R. D.; Seu, R.; Le Gall, A.; Notarnicola, C.; Mitchell, K. L.; Malaska, M.; Birch, S. P. D. (2018). Bathymetry and composition of Titan's Ontario Lacus derived from Monte Carlo-based waveform inversion of Cassini RADAR altimetry data. Icarus, 300, 203-209.
Michaelides, R.J., A. G. Hayes, M. Mastrogiuseppe, H. A. Zebker, T. G. Farr, M. J. Malaska, V. Poggiali, and J. P. Mullen (2016). Constraining the physical properties of Titan’s empty lake basins using nadir and off-nadir Cassini RADAR backscatter. Icarus, 270, 57-66.
Sagan, C., Dermott, S.T. (1982). The tide in the seas of Titan. Nature 300, 731–733.
Soderblom, L. A., Tomasko, M. G., Archinal, B. A., Becker, T. L., Bushroe, M. W., Cook, D. A., et al. (2007). Topography and geomorphology of the Huygens landing site on Titan. Planetary and Space Science, 55, 2015–2024.
ACCEPTED MANUSCRIPT
Solomonidou, A., Hirtzig, M., Coustenis, A., Bratsolis, E., Le Mouélic, S., Rodriguez, S., et al. (2014). Surface albedo spectral properties of geologically interesting areas on Titan. Journal of Geophysical Research: Planets, 119, 1729–1747. https://doi.org/10.1002/2014JE004634.
Solomonidou, A., Coustenis, A., Hirtzig, M., Rodriguez, S., Stephan, K., Lopes, R. M. C., et al. (2016). Temporal variations of Titan’s surface with Cassini/VIMS. Icarus, 270, 85–99.
Solomonidou, A., A. Coustenis, R. Lopes, M. Malaska, S. Rodriguez, P. Drossart, C. Elachi, B. Schmitt, M. Janssen, M. Hirtzig, S. Wall, C. Sotin, K. Lawrence, N. Altobelli, N. Bratsolis, J. Radebaugh, K. Stephan, R. Brown, S. Le Mouélic, A. Le Gall, E.V. Villanueva, J.F. Brossier, A.A. Bloom, O. Witasse, C. Matsoukas and A., Schoenfeld (2018). The Spectral Nature of Titan's Major Geomorphological Units: Constraints on Surface Composition, J. Geophys. Res, 123, 2, 489-507, doi: 10.1002/2017JE005477, 2018.
Sotin, C., et al. (2005). Release of volatiles from a possible cryovolcano from near-infrared imaging of Titan. Naturem 435, 786-789.
Stofan, E. R., et al. (2007). The lakes of Titan, Nature, 445, 61–64.
Vinatier, S., Bezard, B., Lebonnois, S., Teanby, N. A., Achterberg, R. K., Gorius, N., Mamoutkine, A., Guandique, E., Jolly, A., Jennings, D. E., Flasar, F. M (2015). Seasonal variations in Titan's middle atmosphere during the northern spring derived from Cassini/CIRS observations. Icarus, 250, 95-115.
Werynski, A., C. Neish, A. Le Gall, M. Janssen, (2019). Compositional Variations of Titan’s Impact Craters Indicates Active Surface Erosion. Icarus, 321, 508-521.
Wood, C. A.; Mitchell, K. L.; Lopes, R. M. C.; Radebaugh, J.; Stoffan, E.; Lunine, J. (2007). Volcanic Calderas in the North Polar Region of Titan. 38th Lunar and Planetary Science Conference, (Lunar and Planetary Science XXXVIII), held March 12-16, 2007 in League City, Texas. LPI Contribution, 1338, 1454.
Wood, C. A., Lorenz, R., Kirk, R., Lopes, R., Mitchell, K., Stofan, E., & The Cassini RADAR Team (2010). Impact craters on Titan. Icarus, 206, 334–344.
ACCEPTED MANUSCRIPT
Highlights
Study regions of interest (RoIs) of Titan: north polar lakes with raised ramparts
Combine VIMS and RADAR data to infer albedo and emissivity of RoIs
Compare raised ramparts to other geological units of Titan