HAL Id: hal-00111146
https://hal.archives-ouvertes.fr/hal-00111146
Submitted on 26 Jun 2012
HAL is a multi-disciplinary open access archive for the deposit and dissemination of sci-entific research documents, whether they are pub-lished or not. The documents may come from teaching and research institutions in France or abroad, or from public or private research centers.
L’archive ouverte pluridisciplinaire HAL, est destinée au dépôt et à la diffusion de documents scientifiques de niveau recherche, publiés ou non, émanant des établissements d’enseignement et de recherche français ou étrangers, des laboratoires publics ou privés.
thermo-kinematical modelling: Implication for the
meaning of the lower crustal bodies
Laurent Gernigon, Francis Lucazeau, Frederic Brigaud, Jean-Claude
Ringenbach, Sverre Plankee, Bernard Le Gall
To cite this version:
Laurent Gernigon, Francis Lucazeau, Frederic Brigaud, Jean-Claude Ringenbach, Sverre Plankee, et al.. A moderate melting model for the Vøring margin (Norway) based on structural observations and a thermo-kinematical modelling: Implication for the meaning of the lower crustal bodies. Tectono-physics, Elsevier, 2006, 412, Issues 3-4, pp.255-278. �10.1016/j.tecto.2005.10.038�. �hal-00111146�
Implication for the meaning of the lower crustal bodies
Laurent Gernigona*, Francis Lucazeaub, Frederic Brigaudc, Jean-Claude Ringenbachd, Sverre Plankee& Bernard Le Galla
a
Institut Universitaire Européen de la Mer, Place Nicolas Copernic, 29280 Plouzané, France
b
Institut de Physique du Globe/CNRS, 4 place Jussieu, F-75252 Paris cedex 05, France
c
Total Pau, Centre Scientifique et Technique Jean Feger, Avenue Larribau 64018, Pau, France
d
Total GSR/PN, place de la Coupole-La Défense, 92078 Paris, La Défense Cedex, France
e
Physics of Geological Processes (PGP)/Volcanic Basin Petroleum Research (VBPR), Forskningsparken, Gaustadalléen 21, N-0349 Oslo, Norway
*: Corresponding author : [email protected]
Abstract :
High P-wave velocities (7.1–7.8 km/s) lower crustal bodies (LCBs) imaged along volcanic margins are commonly interpreted as plume and breakup-related thick mafic underplating. This interpretation is partly challenged in this paper based on new seismic observations and modelling of the outer Vøring Basin (Norway). An exceptional strong amplitude reflection, the T Reflection, is particularly well defined below the North Gjallar Ridge (NGR) between 7and 8 s TWT. The T Reflection is located near the volcanic lava flows emplaced during the NE Atlantic breakup (not, vert, similar 55–54 Ma ago) and coincides with the top of the LCB, forming a mid-crustal dome. Based on structural and temporal relationships, we show that the dome clearly influences the structural development of the NGR and predates the continental breakup at least by 10–15 Ma. Using a thermokinematica model, we tried also to investigate and quantify the relationships between the extension, LCB and the magmatic production. Modelling suggests that significant Paleocene–Early Eocene magmatism can be produced without any temperature anomaly in the mantle if differential stretching occurs during the breakup initiation. The conclusion of 2D thermo-kinematical parametric analysis is that the magmatic model predicts, either little extension (β < 2) with no melting or high extension (β > 5) with significant melting along the outer Vøring Basin. We suggest that the continental part of the LCB could not necessarily be breakup-related and so magmatic, as has often been stated previously. It is concluded here that the continental part of the LCB observed beneath the outer Vøring Basin may be partly (or fully) attributed to inherited, high-pressure granulite/eclogite lower crustal rocks. The real amount of mafic material emplaced along the outer Vøring Basin could be 20–40% less than thought.
1. Introduction: volcanic margin and the meaning of the Lower crustal
Body (LCB)
1.1. Volcanic margins and LCBs: general concepts
Volcanic rifted margins are characterised by massive occurrences of mafic extrusives and intrusive rocks formed during the rupture on the lithosphere (Mutter et al., 1984; White and McKenzie, 1989; Planke et al., 1991; Planke and Eldhom, 1994; Holbrook and Kelemen, 1993; Mjelde et al., 1997, 2005). Recent reviews illustrate the importance and the wide distribution of such “atypical margins” that may represent 75-90 % of the global continental passive margins (Eldholm et al., 2000; Menzies et al., 2002).
Volcanic rifted margins are known to differ from non-volcanic passive margins by a number of main characteristics as follows (Fig. 1):
• a huge volume of magma formed during the early stages of crustal accretion along the future spreading axis, typically as seaward dipping reflector sequences (SDRS),
• the presence of numerous sills/dike and volcanic vent complexes intruding into the sedimentary basin (Berndt et al., 2000; Svensen et al., 2004),
• a lack of strong passive margin subsidence during and after the breakup (Skogseid et al., 1994), and
• geophysical evidences of a lower crust with anomalous high seismic P-wave velocities (7.1-7.8 km/s) so-called lower crustal bodies (LCBs) (Mutter et al., 1984; Planke et al., 1991 Holbrook and Keleman, 1993; Eldholm et al., 2000) (Fig. 1).
The most popular model is, to interpret the LCBs as magmatic underplating that represents both ponded magmatic material trapped beneath the Moho and magmatic sills injected into the lower crust (White and McKenzie, 1989; Cox, 1993; Rutter et al., 1993; Thybo et al., 2000). Strong evidences of underplating occurring during the rifting comes from petrological indications of both fractionation at lower crustal pressures, temperatures, and crustal contamination occurring during the melt migration into shallow or deep magma chambers (Cox, 1993). Dynamic evidences of underplating are often proposed to explain surface uplift, massive sand influx and sea level variations and the low subsidence rate that occurs during and after the breakup along the volcanic margins and their adjacent areas (Maclennan and Lovell, 2002).
The high velocities (Vp >7 kms) and the thickness of the LCBs are often used to support a mantle plume implication, leading to the formation of huge amount of magmatic rocks (White & McKenzie, 1989; Eldholm & Grue, 1994). The potential temperature of the mantle is obviously one factor that may explain the geophysical characteristics of the LCBs but alternative models involving high extension rates, small-scale convection or fertiles patches in the upper mantle may however explain significant melt production (McKenzie and Bickle, 1988; Wilson, 1993; Boutillier and Keen, 1999; Korenaga, 2004; Buck, 1986, Pedersen and van der Beek, 1994; Van Wijk et al., 2001; Nilsen and Hopper, 2002; Foulger and Anderson, 2005).
LCBs are often located along the continental-ocean transition but can extend beneath the continental part of the crust (Fig. 1). Although the underplating hypothese sounds reasonable along the transitional and oceanic domain, there are not so many constrains on its petrophysical nature and its chronology in the continental domain. Better constraining of the timing of the LCB emplacement; velocities, size and the geological meaning of this LCB, appear to be pertinent for
several scientific and industrial reasons, including our understanding of the dynamic, crustal and magmatic processes.
1.2. The North Gjallar Ridge (NGR): a lower crustal window to investigate the LCB
LCBs and overlying SDRS have been recognized for a long time along the NE Atlantic basins and particularly in the outer Vøring Basin (Planke et al., 1991; Skogseid et al., 1994; Eldholm and Grue, 1994; Digranes et al., 1998; Mjelde et al., 1997, 2005) (Fig. 2, 3). This area is relevant due to a huge amount of geophysical data (refraction, 2D/3D seismic). As a result, the relationships between magmatism, LCB and the sedimentary basin can easily be investigated with confidence.
The outer Vøring Basin is defined as a complex system of faulted ridges mostly defined at the base Tertiary unconformity level (Skogseid and Eldholm, 1989; Lundin and Doré, 1997; Walker et al., 1997; Ren et al., 1998; Brekke, 2000; Færseth and Lien, 2002; Gernigon et al., 2003, 2004). It is located between a deep Cretaceous basin to the east and the Vøring Marginal High, straddling the ocean-continent transition (Fig. 2, 3a). As part of the polyrifted system, the outer Vøring Basin was particularly affected by a Late Cretaceous-Paleocene rifting, leading to the breakup and SDRS emplacement at ~54-55 Ma (Figs. 2, 3).
In this paper, we propose to have a closer look at the north Gjallar Ridge (NGR) (Fig. 3b). Particularly, the most interesting feature of the NGR concerns a mid-crustal dome-shaped reflection, underlying the ridge. This exceptional reflection (Fig. 3) has been regionally mapped and named the T Reflection (Gernigon et al., 2003, 2004). Recent investigations suggest that the T
Reflection coincides with the top of the continental part of LCB (Walker et al., 1997; Ren et al., 1998; Mosar, 2002; Gernigon et al. 2003, 2004; Corfield et al., 2004). The long believed interpretation was to directly assign the LCB beneath the outer Vøring Basin to magmatic underplating (Eldholm & Grue, 1994; Mjelde et al., 1997, 2005), or a mid-Cretaceous to Paleocene metamorphic core complex, which was triggered by underlying magma chambers (Lundin and Doré, 1997; Doré et al., 1999). Based on both structural and modelling approaches, we present, discuss, and challenge, in this paper, the following aspects of the LCB:
• the 3D geometry and geophysical properties of the crustal structure underlying the NGR, • the relationships between the T Reflection, LCB and NGR structures,
• the tectonic and temporal evolution of the NGR with regard to lithospheric rupture and LCB emplacements, and
• the controversial nature of the continental LCBs and the implications for the understanding of the tectonics of volcanic margins and asthenospheric processes in general.
2. Magmatism, LCB and Basin deformation: A structural approach
2.1. The north Gjallar Ridge (NGR) and the T Reflection
The T Reflection is observed in a large part of the NGR, defined at the base Tertiary level (e.g Lundin & Doré, 1997; Ren et al, 1998) (Fig. 3). Gernigon et al., (2003) have shown that the T Reflection extends over a large part of the outer Vøring Basin and is limited to the East by the Fles Fault Complex interpreted as a major crustal boundary (Fig. 3). The 3D geometry of the T Reflection is fully constrained on the NGR (by 2D/3D seismic surveys) where it is clearly expressed as a round-shape feature, 20 km in diameter between 7 and 8 s twt (Fig. 4). The T
Reflection is shallower than the present-day Moho which is estimated from wide-angle modelling at 20 km in depth by Raum, (2000) and Mjelde et al. (2005).
The top of the T Reflection is located at 13-14 ±2 km (Fig 3b). Ren et al. (1998) and Skogseid et al. (2000) also suggest that the top of the T Reflection lies between 10-15 km, matching with the top of the continental part of the LCB. Mjelde et al. (1997, 2005) and Raum (2000) indicates that the T Reflection marks the top of the interval with Vp>7.1 km/s, interpreting the last one as top of mafic/ultramafic underplated material emplaced during the breakup (underplating hypothesis). Based on other geophysical observations, Gernigon et al. (2004) have shown that the T Reflection represents a high impedance boundary associated with a high-density body (high-velocity contrast) with no magnetic susceptibility, which does not favour, a priori, a mafic/ultramafic origin. Gernigon et al., (2003) also state that the T Reflection merges with the top faulted basement beneath Rån Ridge in the southwestern part of the Vøring Basin. In this area, the T Refelction is disrupted by faults already active in Early Mesozoic time.
2.2. Structural and tectonic evolution of the NGR
The NGR represents a Mesozoic structure defined at the base Tertiary level (Gernigon et al., 2003) (Fig. 4a). Above the NGR, the Cenozoic lithologic successions mostly consist of claystone and biogenic oozes affected by mud remobilisation and polygonal faulting commented upon by Hansen et al. (2005). Different structural levels have recorded stretching in different manners during the NGR evolution from rifting to breakup (Figs. 4, 5 and table 1).
• The upper level of the NGR represents syn-tectonic wedges and tilted blocks mostly formed during early Campanian-Early Paleocene time (Fig. 4c). These faulted structures are accommodated at depth by a decollement layer interpreted to represent Albian-Cenomanian? Shales (Fig. 3b).
• The middle level shows poorly imaged block structures, affected by sill intrusions. They are interpreted to be decoupled from the upper blocks.
• The deepest level caracterises the updomed T Reflection (Fig. 3).
A large structure, which evolves from low-angle ductile shear zone at depth and to normal faults upwards, controls the rollover structure of the NGR. A normal displacement along this low-angle shear zone is expected during the pre-breakup rifting in order to accommodate the extension of the overlying tilted blocks. The shape of the domes defined by the T Reflection apparently controls the main faults, mostly as they focus above and around the dome. The dome coincides also with a prominent positif gravity anomaly (Fig. 4b).
The dome itself may have accentuated block rotation and low-angle faulting, in a similar way as the isostatic denudation and rolling-hinge process (Koyi and Skelton, 2001). Extension on low-angle faults is known to accommodate high-magnitudes of crustal stretching in rifted basins. Therefore, the interpretation of low-angle shear zones in the deeper part of the NGR is not surprising, considering that extension on the shallower part of the Cretaceous basin is unable to accommodate the expected large magnitude of crustal thinning prior to the lithospheric rupture.
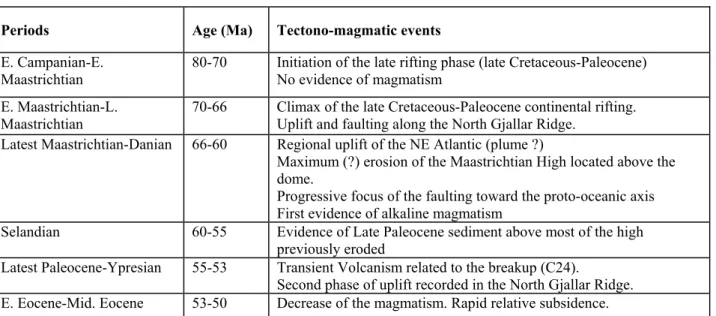
Faults in the NGR, are cut but the base Tertiary unconformity (BTU), which is onlaped by Paleocene sediments of the Rogaland Formation (Fig. 4c). This pre-breakup regional unconformity, which is observed all along the NE Atlantic, likely, coincides with the Icelandic plume-lithosphere
impingement hypothesis (regional uplift) proposed by Skogseid et al. (2000) and Jones and White (2003) during the late Maastrichtian-Early Paleocene (Table 1).
Our major argument is that the continental part of the LCB, which is highlighted by the T Reflection, is a pre-breakup feature (eg. Gernigon et al., 2004). Before the late Maastrichtian-Early Paleocene uplift, the NGR was already a structural high above the crustal dome, itself already in place before the breakup, as suggested by the pinchouts in the Upper Cretaceous section, observed on the eastern part of the ridge (Fig. 3b). Another important point is that blocks rotation and faulting in the NGR, stop before the Early Eocene breakup (Fig. 4c). This reflects a progressive or sudden focus of the deformation towards the future breakup zone. The migration of the deformation occurs, from late Paleocene to early Eocene time (Table 1).
3. Magmatism, LCB and Basin deformation: A quantitative approach
3.1. A regional Transect along the Vøring margin
The LCB beneath NGR is likely a pre-breakup feature but it is still unclear if it represents a magmatic feature or not. The main volcanic event is Early Tertiary in age but Mesozoic or older magmatic event could not be excluded at this stage. In order to quantify the current temperature, its magnetic implication and the melt production formed during the tectonic evolution of NGR, a thermo-kinematical modelling of the Vøring margin has been carried out along a 1300 km long cross-section (Fig. 5). The transect runs NW-SE, from the Norwegian mainland to the Mohns oceanic spreading ridge and crosscuts the NGR and its 3D seismic survey (Figs. 2a).
To built our initial model, a set of depth-converted regional 2D multichannel seismic profiles displaying the basin and crustal configuration across the Vøring margin have been used for the offshore basinal part of the transect. Wells data (including the NGR well 6704/12-1) provided by Total Norge were used to constrain sediment velocities, heat flow and horizons calibrations. Global sea-floor topography from satellite altimetry (Smith and Sandwell, 1997), ETOPO 2 data and the digital sediment grid compiled by Laske and Masters (1997), have been used to extend the geological cross-section both in the oceanic and continental domain. It has been carried out in order to include the oceanic spreading influence and to reduce the edge effects on both sides of the NGR.
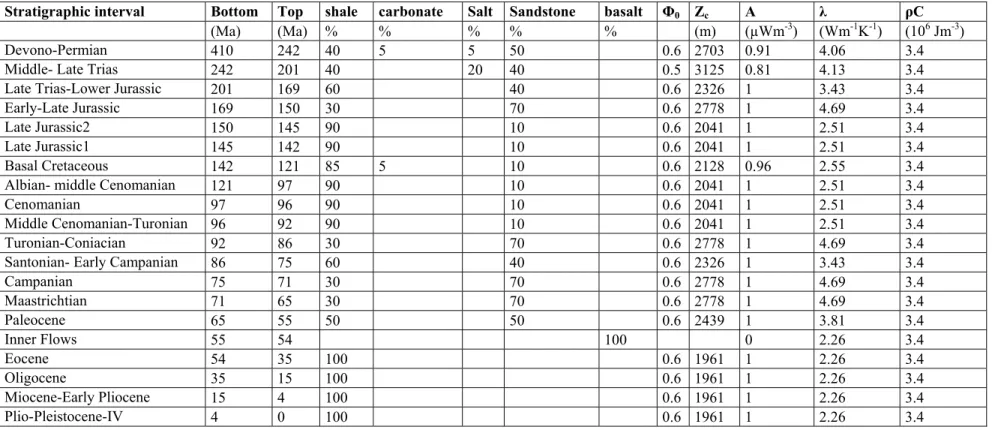
Calibrations defining the geological transect includes: 1) Lateral and vertical variations of the lithology, 2) porosity for each lithologies, 3) conductivities computed for the different lithologies based on methodologies developed by Brigaud et al. (1990), 4) density variations of the different lithotypes including later thermal contraction. Heat flow values available along the transect, paleowaters depths inferred through time and current seismic Moho depth (Vp >8km/s) were used to constrain both directly and indirectly the numerical inversion. The inversion is used to estimate the stretching factors evolution from the subsidence rate and other calibrations are used as a final check. Initial parameters that define thickness and physical properties of the sedimentary basin, the pre-rifted crust and the lithosphere are summarised in Tables 2 and 3.
3.2. Principles of the thermo-kinematical modelling
The basin and lithosphere evolution are investigated with a 2D finite elements model (Latil-Brun and Lucazeau, 1988; Lucazeau et al., 2003). This numerical code is designed to study the
evolution of rift basins and passive margins at both lithospheric and basin scales. The model uses a purely implicit scheme that provides unconditionally stable solutions.
It takes into account several lines of importance in the thermal evolution of such areas. These are: • thinning of the continental crust and the consequent reduction of radiogenic heat sources • thinning of upper mantle that can be different from that in the crust (Royden and Keen,
1980)
• multiple stretching episodes of finite duration (Jarvis and McKenzie, 1980) • thermal interaction with the surface (sediment blanketing, erosion)
• oceanic accretion and magmatic underplating • control on regional isostasy (level of necking)
3.2.1. Heat transfers and lithosphere properties
The model resolves the two dimension heat equation within a lithospheric mesh when continental thinning, oceanic accretion, surface processes (sedimentation or erosion) exist. A kinematical field derived from the hypothesis of pure shear stretching (McKenzie, 1978) describes continental thinning. To account for more complex aspects of the thermal evolution, the model includes crust and sediment heat production, finite duration for one or several stages of rifting, sediment compaction and porosity, thermal dependence of density and conductivity, regional isostasy and level of necking, oceanic accretion and/or magma underplating. The basic equation to solve the temperature field T is:
0 ) , , ( ) ) , , , ( ( ) ) , , , ( ( + +A x y t = y T T t y x y x T T t y x x x y ∂ ∂ λ ∂ ∂ ∂ ∂ λ ∂ ∂ [ 1]
Because a Lagrangian formulation is used, there is no advection term in this equation, which is fully accounted for by the nodal displacements. λ represents thermal conductivity (Wm-1°K-1), A heat production (µWm-3), ρ density (Kgm-3) and C heat capacity (J°C-1Kg-1). x and y are spatial coordinates, defined along the lithospheric section; t is time.
In order to account for the petrologic layering, the continental lithosphere is divided into four layers with intrinsic properties (Table 3). In earth materials, conductivity usually decreases when temperature increases (Birch and Clark, 1940), but rock type can also affect this dependence (see references in Clauser and Huenges, 1994). Different relationships between thermal conductivity λ(T) and temperature T have been proposed, but we have retained a general form for the crust:
(
1 ( ))
) ( ) ( Lab Lab T T T T − + = α λ λ [ 2]λ(TLab) is conductivity at laboratory temperature conditions and α is a coefficient of the order of 5
10-4 °K-1 (Wells, 1980).
In the mantle, radiative heat transfer can counterbalance decrease of phonon conductivity (Schatz and Simmons, 1972; Shankland et al., 1979; Hofmeister, 1999), but its magnitude in the upper mantle is still a matter for debate (van den Berg et al., 2001). In the present calculations, we have used the Schatz and Simmons (1972) model that provides a higher radiative contribution in the uppermost mantle with respect to the Hofmeister (1999) model. The apparent thermal conductivity value of the mantle λmantle is given as the sum of a lattice (phonon) conductivity
ABS T * .2 + 31. 418 = L λ [ 3] 500.) -.0023(TABS = R λ for TABS> 500°K [ 4] R L mantle λ λ λ = + [ 5]
Thermal expansion or contraction related to temperature variation is also included in the model as a variation of density ρ at constant volume:
) 1 )( 0 ( ) (T ρ T C αT ρ = = ° − [ 6]
where α is a coefficient of thermal expansion (3 10-5 °C-1).
3.2.2. Mesh and boundary conditions
The mesh is modified during each stage of evolution:
• nodes are displaced according to a kinematical field of deformation during rifting
• new elements are added (or removed) on (from) the top layer to account for sedimentation (erosion)
• new elements are added on a vertical boundary to account for oceanic accretion; at the same time, the boundary condition switches from no horizontal flux to a fixed temperature condition
• lower boundary condition can be changed to simulate the effect of small scale convection
The mesh is formed by 4 nodes isoparametric elements and includes typically 15 layers in the lithosphere, 5 to 15 layers in the sediments, 50 to 200 columns in the horizontal direction. An example of mesh evolution for this study is given in Figure 6. The vertical resolution increases by the addition of horizontal layers at the base of the lithosphere during (or immediately after) rifting, or by addition of sediments at its top. The horizontal resolution increases by addition of oceanic columns on the edge of the box. Boundary conditions are fixed temperatures at the top and bottom of the box, and zero flux on vertical limits. During oceanic accretion, one vertical boundary condition has been switched to a fixed temperature condition (T=TL).
During the rifting stage, two end-members lower boundary conditions can be applied: one corresponds to a plate model with a fixed temperature at a constant level as described by Jarvis and McKenzie (1980); the other corresponds to a fixed temperature at the base of the extended lithosphere. This latter alternative will be referred to as “the convection model” in the sense that such a boundary condition increases the heat flux at the base of the lithosphere as small-scale convection would do (Buck, 1986; Boutillier and Keen, 1999).
3.2.3. Sediment properties
In the sediment layers, the compaction process and its physical effect on thermal conductivity and density are included in the model (Table 2). This is especially important as sediments represent
an insulating blanket on the lithosphere that delays conductive cooling and subsidence. Here, compaction follows a simple law in that porosity Ф decreases exponentially with depth (Athy, 1930; Sclater and Christie, 1980):
) exp( ) ( 0 c z z z =Φ − Φ [ 7]
where Ф0 is the surface porosity and zc the compaction depth depending both on lithology.
Sediment conductivity varies with porosity and sediment matrix conductivity, which can be predicted by mineralogy (Brigaud and Vasseur, 1989; Brigaud et al., 1990). Sediment thermal conductivity is noticeably lower than that of the basement, because of the high porosity and the low conductivity of water or air filling the pores. An empirical geometric model provides a good approximation of the bulk conductivity:
) 1 ( φ λ λ λ = Φ − matrix water bulk [ 8]
Thermal conductivity of matrix and water are determined in a way similar as explained by Chapman et al (1984), which also includes a geometric or resistance model (depending on the proportion of shales), the relationship between bulk matrix conductivity and thermal conductivity of each mineral phase is also considered.
3.2.4. Subsidence and isostasy
In the initial model of McKenzie (1978), subsidence evolution is estimated assuming a local equilibrium of loads. Because the lithosphere has some strength, even if it is moderate, loads can
act at on a regional rather than a local scale. This affects the way lithosphere subsides under sediment loads or reacts to its internal structure change during rifting.
In the case of local isostasy (Airy), lithostatic pressure at a certain depth below the lithosphere bottom is same as that of a reference lithosphere (initial lithosphere). In case of density variations between the two states, subsidence or uplift accommodates the differences between the weight. Changes in elevation SAiry with respect to the initial state is given by:
) ( ) 0 , ( ) , ( 0 0 w a z z z z Airy L L z z z t z S ρ ρ ρ ρ − ∂ − ∂ =
∫
∫
[ 9]z0 and zL are elevation of sea and compensation levels; ρa and ρw are density of asthenosphere and
water respectively.
Regional isostasy is modelled by a thin plate elastic model, which relates the deflection w(x) of the lithosphere under a given load P(x) to its flexural rigidity D(x):
(
( ))
( ) ( ) 4 2 2 x P gw x w x D fill a − = + ρ ρ ∂ ∂ ∂ [ 10]The flexural rigidity is also related to the apparent or equivalent elastic thickness (EET) h by:
) 1 ( 12 ) ( ) ( 2 3 ν − = Eh x x D [ 11]
where E is the Young modulus (5 1010 Pa) and ν the Poisson coefficient (0.3). The flexural strength of the lithosphere is controlled by the 450°C isotherm compatible with reviews of Burov and Diament (1995) and Reemst and Cloething (2000).
Thermo-mechanical models including elasto-plasticity rheology (Braun and Beaumont, 1989) have revealed the importance of internal loads in the evolution of surface topography. This led to the concept of depth of necking, a virtual level in the lithosphere that guides plastic necking and induces restoring forces to recover isostatic equilibrium. Kooi et al (1992) proposed a kinematical model of necking, which is used in our modelling. Subsidence related to necking is given by:
neck neck z S (1 1) β − = [ 12]
where β is the local extension factor of the crust and Zneck is the depth of necking. The restoring
force is proportional to the difference between Sneck and its corresponding Airy-type value Sairy. A
neutral value around 7 km can be defined where both subsidences are equal (Watts and Steward, 1998), and the forces are directed upward, for higher values of Zneck or downward for lower values.
Zneck is usually determined by a combined analysis of bathymetry and gravity (Keen and Dehler,
1997; Watts and Steward, 1998; Lucazeau et al., 2003). Here, Zneck is assumed to be constant
during the margin evolution, and is estimated to be around 25 km in order to fit most of the geological and geophysical observations. However, a limit of the modelling is the reliability of a constant level of necking. As a matter of fact, multi-episodes of lithospheric stretching and the
geological meaning of this level would probably induce a more complex relationship between the lithospheric strength and the pre-rift rheology.
3.2.5. Determination of the deformation field during rifting stages
Deformation of continental lithosphere associated with rifting corresponds to pure shear as defined formerly in the McKenzie (1978) stretching model; β(x) is the stretching parameter defined for each column of the mesh: it is obtained by an iterative process fitting the present-day or past bathymetry with a maximum RMS less than 100 m. As rifting has a finite duration ∆t, it is better to define the strain ε& as:
t ∆ = ln(β) ε& [ 13]
In our model, the distribution of βs(x) is determined by an iterative procedure in order to obtain the best fit with the bathymetric information (well data, seismic facies, backstripping). A cumulative RMS of less than 0.1 km was used for the present stage:
∑
−= N bathyobs bathycalcul RMS 1 2 ) ( [ 14]
(
)
crust calcul obs E bathy bathy − + = 0 1 1 1 β β [ 15]where Ecrust represents the crustal thickness.
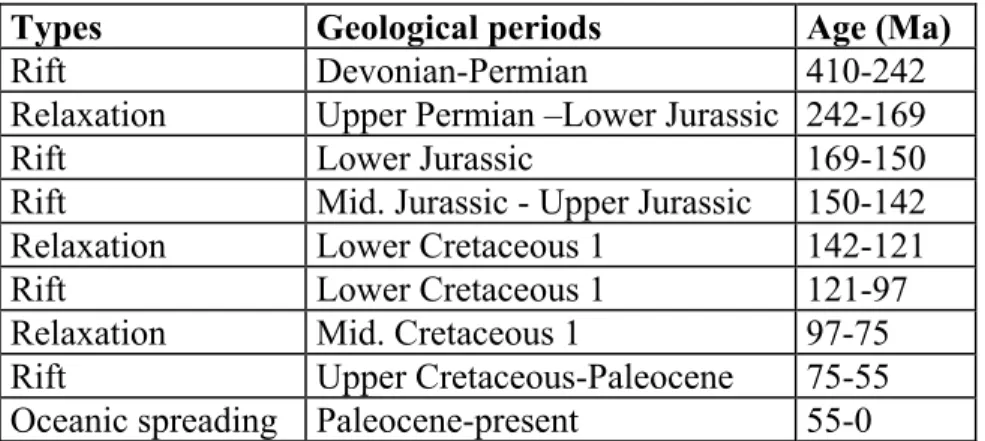
When one stage of rifting only is considered, the present-day bathymetry constrains the determination of the βs distribution. Based on recent regional interpretation works (Doré et al., 1999; Brekke, 2000; Gernigon et al., 2003), five periods of rifting episodes recorded in the sedimentary section and three periods of thermal relaxation have been defined (Table 4). Therefore, we defined as many bathymetric constraints as stages of rifting. Each paleo-bathymetry was estimated at a time just before the beginning of the next rifting stage, in order to account for each thermal subsidence phase. Another assumption is that the crustal thickness was more or less the same throughout the region at the beginning of the modelling process, i.e. at the end of the post-orogenic relaxation process.
3.2.6. Underplating and thermal effect
The modelling presented in this paper does not include at this stage, a sudden mantle plume involvement in Late Cretaceous-Early Tertiary time, as it is still a matter for debate (van Wijk et al., 2001; Nilsen and Hopper, 2002). One of our work hypotheses is to examine the relative role of an initial “moderate” and constant mantle temperature of 1333°C influenced or not by an active upwelling rate along the Vøring margin. Magmatic production with regard to the pre-breakup rifting events and the meaning of the LCB was tested using different sub-lithospheric mechanisms.
In a volcanic margin and rift setting in general, if stretching and upwelling are rapid enough, it is commonly assumed that the pressure within the lithosphere may drop below the melt solidus,
resulting in the partial melting of the mantle (McKenzie and Bickle; 1988, Wilson, 1993). Melt generated in this way can rise through the lithosphere and is trapped below the Moho because of the low density of crustal rocks. We included the possibility in the model to determine what quantity of magma can be generated and trapped using such a mechanism, and what the resulting thermal effects could be. For most of the models a basic anhydrous solidus and liquidus of a normal and homogeneous pyrolitic mantle was used. We used the same parameterization as McKenzie and Bickle (1988). The local melting rate (f) was then determined by:
) ' 988 . 2 4256 . 0 )( 25 . 0 ' ( ' 5 . 0 T T 2 T f − = + − + [ 16] with S L L S T T T T T T − + − = ( ( )/2) ' [ 17]
TS is the solidus temperature inverted from the following expression;
(
1.2 10 ( 1100))
exp 10 968 . 4 136 / ) 1100 ( − + 4 2 − = − − S S x x T T P [ 18]and TL is the liquidus temperature given by:
− + + = − 2.169 2 tan 180 343 . 4 2 . 1736 P 1 P TL [ 19]
Magmatism may be enhanced by mantle made unusually fertile by eclogitised crustal fragments that may contribute to the formation of volcanic margins (Yaxley, 2000; Foulger and Anderson, 2005). An alternative based on a pure eclogitic solidus (Yasuda et al., 1994) which probably represents an extreme end-member, has been tested also. The differents solidus and liquidus have then been approximated by the following polynomial fits:
1009.4 z 3.1052 z -0.0023 2 + + = S T [ 20] 1168.6 z 3.0346 z -0.0023 2 + + = L T [ 21]
In all cases, the melting fraction has been corrected for the absorption of latent heat of fusion. We used the parameterisation method proposed by Bown and White (1995). The total accretion rate U(x) is then obtained by integration in the upper mantle of all liquids produced:
∫
∆ = moho L fdz t U 1 [ 22]where L is the base of the lithosphere and ∆t the time interval considered. This is of course an oversimplification of the problem since we consider that all liquids produced are extracted and accreted at the base of the crust, but in turn, the production of liquids at each time step is limited by the previous extraction. In other words, the total fraction of melt from a given rock is limited to the fraction defined by the maximum temperature attained by this rock. The mesh geometry can change
accordingly when a certain quantity of magma is generated: a “reservoir” at the base of the crust (formed by two additional layers in the mesh) is then filled up with this magma, which is accreted vertically. In the modelling, it is not possible to estimate the relative part and the age of both real underplating and intrusions. We assume therefore that the part of the intrusions within the pre-existing crust can be neglected and that most of the simulated melts are stacked beneath the Moho.
The resulting thermal effect is then obtained by introducing a transient variation of heat production in the underplated body. The heat produced in this body is related to the advection of heat from mantle on the one hand and from the release of latent heat when the magma is cooling below the solidus on the other hand. The heat lost by the magma during its rise is therefore neglected. The heat given up by the cooling magma (Lachenbruch et al., 1985) is:
t T T C E melt rock p ng underplati ∆ − = ρ ( ) [ 23]
Tmelt corresponds to the temperature of intruding magma adjusted for latent heat of crystallization L
released (Lachenbruch et al., 1985) :
t C X L T T p rusion melt ∆ ∆ + = int [ 24]
Cp is specific heat, Trock is temperature of the surrounding rocks, L is latent heat of crystallisation, ρ
is density and ∆X is the melt fraction solidified during the time interval ∆t.
Oceanic accretion is the ultimate evolution of this melt model. It is taken into account as a vertical boundary condition (T=TL) like in the Parsons and Sclater (1977) model and “accretion” of new
by the melt generation model. The accretion rates are constrained by the age of the oceanic crust (Müller et al., 1997) along the section and the crust thickness is determined by the total amount of melting.
4. Results and discussion of the modelling
4.1. Magmatic production: results of the modelling
The generation of magma in the model can depend on several parameters that affect the initial geotherm, the amount of thinning and the melt generation model. Several numerical experiments have been carried out in order to test the sensitivity of the model. One of them can be set as a reference (GJ1): parameters used in this experiment and in the eleven others are presented in Table 3. The maximum thickness of underplating and the cumulative extension, which integrates thinning factors all over the section in a pure shear assumption, have been considered in the continental domain as the most discriminating factors (Table 4). Assuming that the whole LCB represent underplating, stricto-sensu, the actual volume per unit length of underplated magma should be estimated between 1000-1500 km2 (Eldholm and Grue, 1994).
In the case of homogeneous stretching, partial melting with a dry solidus model could not occurred (GJ1) during pre-breakup rifting events. This agrees with the predictions of Bown and White (1995) for such long duration of rifting. The extreme eclogite solidus model (Yasuda et al., 1994) does not lead either to significant melting with homogeneous stretching only (GJ2).
At this stage, the only way to produce partial melting before the breakup is the activation of the small-scale convection option (GJ4, GJ8 or GJ9) (Table 5). However, this option does not allow the formation of significant pre-breakup underplating with a dry solidus. Using the eclogite solidus,
significant pre-breakup underplating is possible but consequently, the melt production increases too much during the breakup (oceanic crust thickness up to 60 km). This provides an appropriate and unstable solution unless lateral solidus variation is involved.
Effects of the internal lithospheric properties have been also tested. An increase of mantle heat flow (corresponding to a thinner lithosphere in GJ5) or an increase of crustal heat flow (corresponding to a higher heat production in GJ11) does not provide enough heat for melting. A decrease of mantle conductivity (by suppression of the radiative component in GJ8) does not succeed as well. A shallower level of necking (GJ12) leads to more extension for a similar subsidence, but this is not sufficient to provide a large amount of melting during rifting. We also tried a non-constant (increasing) deformation rate (GJ6), but this was not enough to produce larger amounts of melt as well.
In all our experiments, large onset of partial melting culminates at the onset of drifting (54 Ma). Melting production starts during the breakup, except when small-scale convection (moving boundary condition) and differential stretching (maximum extension of 9 in the upper mantle) are involved. For the last scenarios, melt production can start earlier in the Palaeocene (65 Ma). In that case, additional melt provides a buoyant layer that needs to be compensated by a higher extension, and in turn more melting. This explains why such difference exists between experiments, where melting has begun during rifting.
In our model, the distribution of extension is directly inverted from the subsidence history: those models that produce melting during the last rift stage (GJ4, GJ8 and GJ9) correspond to an average horizontal extension velocity of the order of cm (2-3 cm/year at maximum). The final volume of magma for models GJ4, GJ8 and GJ9 is about the same order as the LCB (Table 5).
For both models, the underplating lies mostly in the western part of the transect between 800-500 km (Figure 7). It is consistent with the location of the LCB deduced from the more recent interpretation of the refraction data in this part of the Vøring margin (Raum, 2000; Mjelde et al., 2005). The location of the modelled underplating also coincides with the lateral repartition of the sill and vents complexes observed in the Vøring Basin (Berndt et al., 2001; Svensen et al. 2004).
If the LCB fully represents breakup-related underplating, then, no mantle plume is required to explain huge amount of magmatism formed along the margin. This results agrees with those of Van Wijk (2001) for the Vøring margin. However, despite significant thickness of melt generated (maximum is 11 km, Table 5), all the models fail to explain higher thickness, of igneous crust (up to 20±5 km) that defined the oceanic LCB in the transitional-oceanic domain. This discrepancy could be due to poor imaging control and uncertainties in the basin geometry below the lava flows and SDRS. It may be also interpreted as a sudden and punctual effect due to a local increase in the temperature situated along the proto-breakup axis during Paleocene-Early Eocene time (plume effect?). It also can be attributed to local fertile patches in the shallow mantle, which is capable of producing more than average amount of basaltic melt through a given range of pressures and low to moderates temperatures (Foulger and Anderson, 2005).
The conclusion of the parametric analysis shows that the magmatic model predicts, for this part of the Vøring margin, either little extension (β < 2) with no melting or high extension (β > 5) with large melting. At this stage, it is clear that the geological interpretation of the LCB (in terms of mafic bodies or not) is a critical factor, to clear up the various options.
4.2. Thermal evolution
Including underplating, the lithospheric thermal fields from the onset of the last rifting phase to the present stage, are illustrated for two end-members in Figure 7. Before the late Campanian-Paleocene rifting, the main stretching factors and thermal anomalies were located in the central part of the Vøring Basin. Compared to the amount of lithospheric stretching (Figure 5) the upper crustal deformation documented by the seismic data is located more to the west along the NGR. The differences between upper crustal deformations describe a decoupling within the lithosphere.
The modelling also suggests a progressive increase of the crustal temperature during the Upper Cretaceous-Paleocene rifting with highest temperatures occurring in Paleocene along the breakup axis. At the same time, progressive cooling occurs in the central part of the Vøring Basin due to the sudden westward migration of the lithospheric stretching (Fig. 7). During Breakup, temperatures strongly increase towards the spreading axis and progressively decreases after Eocene times.
From a geological point of view, the temperature during Upper Cretaceous-Paleocene can reach the green schist facies metamorphic conditions (T°>300-400°C). On the contrary, granulite facies and crustal melting require higher temperatures (T°>600-700°C), only observed beneath the Vøring Marginal High in Late Paleocene-Early Eocene time.
The modelling shows that the present temperatures near the T Reflection according range between 250-400°C to different options (Fig. 7). Current temperature is too low compared to the Curie isotherm ( >550°C) located 15-20 km below the T Reflection. If the dome is of magmatic and
mafic origin, it makes it difficult to explain its low magnetic character triggered by the current Curie temperature effect, as suggested by Fichler et al. (1999). The modelling shows however that the Curie isotherm may have touched the T Reflection level during the Late Paleocene (Table 5).
4.3. Stretching factor, breakup and focus of deformation and breakup: a model of volcanic margin development
Stretching factors derived from subsidence (ßs) distributions calculated for the different rifting phases show maximum stretching factors of ßs1=1.4-1.75 (Devono-Permian), ßs2=1.1-1.2 (Jurassic), ßs3=1.02-1.09 (Lower Cretaceous) and ßs4=1.4-2.7 (Upper Cretaceous-Paleocene)(Fig. 5). It appears that the modelled stretching distribution reflects a slight westward migration of the stretching axis through time; at least from the Lower Cretaceous to the Palaeocene, which is quite in agreement with other previous modelling (Skogseid, 1994; Roberts et al., 1997; Reemst and Cloetingh, 2000). The stretching distribution for the pre-breakup rifting phase (ßs4) is quite similar to the flexural model previously proposed by Roberts et al. (1997) assuming constant elastic thickness of 1.5 km. They also suggest ßs4 of 2.75 for the NGR. On the other hand, our values are lower than the Reemst and Cloething (2000)'s model, which also used a flexural strength controlled by the 400°C isotherm with same initial crustal thickness (35 km). For the Late Cretaceous-Paleocene, their model suggests maximum ßs4 of 3.8 for NGR.
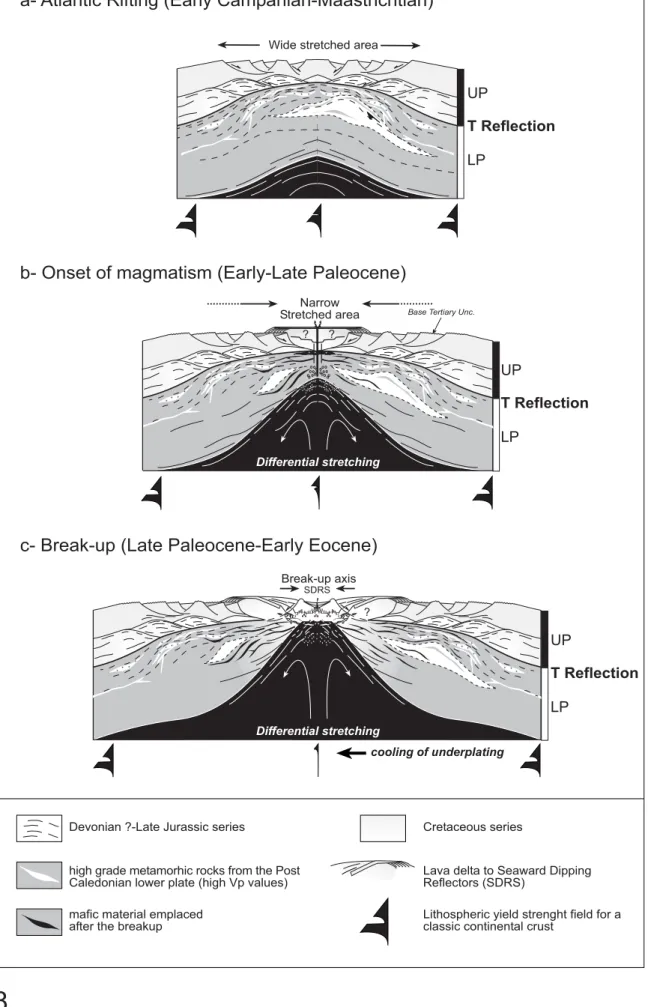
The modelling and the structural observations suggest that the continental lithosphere was weakly and widely stretched before the breakup, with no evidence of shallow mantle exhumation along the sedimentary basin (Fig. 8). The thermal model and stretching factors distribution within the lithosphere suggest however that decoupling and strong depth-dependent stretching mechanism
should occur in order for the lithosphere to reach the breakup. The requisite process as been suggested on many other passive margins (Davis and Kuznir, 2004).
As the strain rates are likely to be quite high during the rifting evolution of the Vøring margin, increase of the coupling and consequent widening of the extending zone may be expected if temperature and underplating are not involved in the system ( Brun, 1999). Such widening is not observed in the Vøring margin but instead, it results in a focus of the deformation and depth-dependant stretching increasing during the Latest Cretaceous-Paleocene time (Fig. 8). The early Paleocene coincides also with the onset of magmatism (NE Atlantic magmatic phase 1 of Saunders et al., 1997). This coinciding chronology strongly suggests that early magmatic melts are most likely involved in the breakup process (Table 1).
The main thermal, magmatic and stretching events occur during breakup when SDRS emplacement and the onset of the oceanic spreading occur (Fig. 8, 9). Surprisingly, few faults affect the SDRS wedges, observed all along the mid-Norwegian margin (Fig. 2, 9), whereas consequent lithospheric stretching factors are expected (Table 5). Riftward migration of the faults towards the proto-oceanic ridge may be explained in terms of weakening of the lithosphere triggered by magmatism and high thermal gradient. As the lateral temperature gradient becomes more pronounced (Fig. 7), highest strain rate and active faulting occur where the lithosphere is thinnest. Several modellings illustrate this effect and effectively prove that melted zones within the lithosphere can strongly control the localization of stretching and necking (Geoffroy et al. 1998; Callot et al., 2002; Gac and Geoffroy, submitted). Ebinger and Casey (2001) draw the same conclusions, for the nascent volcanic margin observed in the northern part of the Ethiopian rift, that represent an excellent modern analogue of the outer Vøring Basin.
5. DISCUSSION: The origin of the T Reflection and the LCB: break-up
magmatic-related features?
The nature of the continental crust below the T Reflection between 7-8 s twt and its implications are now discussed in light of the previous interpretation and modelling. In contrast to the SDRS, the LCB has never been directly sampled and both velocities and structures may be interpreted in different ways. Taking into account the modelling results (and its uncertainties), some geological interpretations can be discussed.
5.1. The “ Mafic-ultramafic“ model triggered by a mantle plume
According to White and McKenzie (1989) and Eldholm et al. (2000), LCBs represent gabbroic to olivine cumulates derived from picritic melts that underplated the lower crust, during the breakup volcanic event. These large volume of picritic melts are generally explained by the influence of a mantle plume during the breakup (White and McKenzie (1989) even if a genetic relationship is still contreversial (Anderson and Natland, 2005). Our thermo-kinematical approach suggests that high potential temperature is not necessarily a pre-requisite to generate, moderate to significant amount of underplating during the breakup. Therefore, we believe that minor to significant part of the LCB may represent underplating formed without any influence of a mantle plume (eg. Van Vijk et al., 2002). This questions the relative importance of both the Icelandic mantle plume and lithospheric processes during Paleocene time.
One of the questions about the underplating hypothesis that remain, is the real timing of the magmatism. The first part of this paper proposed that the T Reflection is unlikely to have originated
from the top of the Tertiary magmatic underplated unit since it is previously demonstrated to have existed before the Paleocene. All the models suggest that underplating formed mainly during the breakup in Early Eocene time. With some limitations (mostly the lateral nature of the solidus), modelling demonstrates that moderate underplating can be produced during the Paleocene, if mantle convection and/or differential stretching are simulated in the upper mantle.
There are few evidences of magmatism older than Paleocene in the Vøring basin to this day. Magmatic activity is mostly constrained by well ODP Site 642E (Fig. 2) on the Vøring Marginal High which drilled two volcanic intervals. The upper interval consists of thick Early Eocene basaltic layers of ~54.3 Ma related to the breakup (SDRS) and the lower interval is composed of dacitic rocks interbedded by late Paleocene/Eocene fluvial sediments (Eldholm et al., 1989; Saunders et al., 1997). The eastward extent of Tertiary magmatism in the Vøring Basin is proven by a K-Ar age of ~55.7 from a grab sample located close to the Norwegian coastline (Bugge et al., 1980). On the East Greenland conjugate margin, Tegner et al. (1998) identified three discrete episodes of pre-(63-59 Ma), syn-(57-54) and post-(50 Ma) breakup episode related magmatism. Svensen et al. (2004) also show that most of the sills and related vents in the Vøring basin have been emplaced during the Tertiary, leading to rapid realease of methane in Eocene.
We are perfectly aware that our 2D modelling might be inconclusive since the dynamic of the sub-lithopsheric processes themselves, even if they can not be excluded, are oversimplified and sometime speculative. However, most of the reasonable and end-member hypotheses, we tested, do not support significant pre-Paleocene magmatism along the Vøring margin. Until we get further geological evidences, the modelling agrees the observations at this stage.
5.2. The “Tertiary” core complex model
In the context of outer Vøring margin, regional extension is the main tectonic process rather than a crustal collapse controlled by gravity forces. Below the NGR, Lundin and Doré (1997) suggest that the T Reflection might have been related to a ductile deformation event initiated by crustal anatexis and core complex formation triggered by huge mantle bodies trapped within the lower crust. Core complexes develop in zones of upper crust located above lower crustal heterogeneities that are weak enough to localise stretching. Consequently, thinning of the upper crust is then compensated by the uprising and exhumation of low viscosity lower crust accommodated along low-angle detachments (Brun, 1999). This could correspond to a local thermal anomaly due, for example, to plutonic emplacement or zone of partial melting (T°>600°C), but most of the time in post-orogenic setting.
Due to the timing of the main volcanic event (56-53 Ma), the occurrence of large volumes of mafic material and genetic melting of the crust are probably unlikely before the break-up as suggested by the modelling and the regional datations of the magamatism.
Once again, the relationships between the T Reflection and the basin structures shows that the dome emplacement and the NGR formation starts at least in Campanian-Maastrichtian time pre-dates the main Tertiary magmatic event. In this case, magmatism and associated fall of viscosity is not a likely trigger for the initiation and rising of the crustal dome. Furthermore, recent field investigations show that if large volumes of pre-breakup mafic magma effectively exist, they do not inexorably lead to regional-scale melting of the lower crust as it is commonly postulated (Barboza et al., 1999).
5.3. The serpentinisation model
Another explanation that could account for the high-velocity characteristics of the NGR lower crust is for this interval to consist of pre-breakup high velocity rocks. Serpentinised mantle below the T Reflection has already been suggested by Ren et al. (1998). Serpentinised mantle has been interpreted to the south both in the Rockall Basin (O'Reilly et al., 1996), in the Porcupine Basin and in the deep Galician margin where similar dome features have been described (Reston et al., 2004). The serpentinization model is consistent with a pre-magmatic emplacement of the dome below the NGR and explains the high velocities. From that point of view, a serpentinized mantle also displays anisotropy, a large range of Vp waves, ranging between 5-7.5 km/s and high Vp/Vs values >1.8 (O'Reilly et al., 1996), quite similar to the values observed below the T Reflection (Mjelde et al., 1997). The density structure of the dome (2900 Kg m-3) and the high P-wave velocities would be equivalent to c. 10-30% serpentinization (Reston et al., 2004).
However, such rocks are only expected to occur within highly stretched extensional crustal domain (pre-breakup terranes) in highly-saturated water conditions (Boillot and Froitzheim, 2001). After removal of post-rift sediments and decompaction of the sedimentary sections, such environments are difficult to explain at depth of 12-15 km below the NGR. The high hydrostatic pressures do not favour a direct downward migration of seawater fluids at such depth. Hydrothermal convection systems through large crustal faults are not exclude and can initiate the onset of mantle serpentinization. This process requires however the presence of large faults penetrating the entire crust (Perez-Gussinye and Reston, 2001). Our previous structural interpretation suggests however a decoupled system of blocks which does not favour such mechanism during the Early Campanian-Paleocene rift event.
In conclusion, the depth and hydrous conditions are probably not favourable to allow a serpentinization process near the T Reflection. The same conclusion is drawn in Mjelde et al. (1997, 2005) based on Vp/Vs analysis of the LCB.
5.4. The retrograde, high-grade rocks model
One of the modelling end-member show that the geometry of the margin may be explained with little extension in the case where the LCB do not fully represent a magmatic feature but a continental fragment. This conclusion agree with the fact that the T Reflection, which represent the top LCB beneath the NGR, influences the structure before the main magmatic episode (Paleocene-Early Eocene). It is suggested that the crustal dome bound by the T Reflection is much older and probably composed of high pressure granulite/eclogitic material, which is known to display both high Vp waves (7.1-8.5 km/s) and high density (2.8-3.6 g.cm3) (eg. Gernigon et al., 2003, 2004). These rocks are well documented in the eastern part of the Norwegian Western Gneiss Region, outcroping in the footwall of the Hornelen post-orogenic basin (Fountain et al., 1994). Its offshore prolongation to the West has recently been interpreted in the northern North Sea below the Triassic-Jurassic rift system (Christiansson et al., 2000).
The geophysical appearances of the Caledonian nappes display low magnetic susceptibility at normal shelf-type thermal gradients (Olesen et al., 1997), which may explain the low magnetic signature of the crustal dome below the NGR. Unpublished Expanded Spread Profiles acquiered during the Elf Refranorge project (1983-1986, unpublished data) also demonstrate that the geophysical nature of the lower crust in the eastern part of the Vøring margin is characterised by high Vp velocity values > 7 km/s at less than 20 km from the Trøndelag Platform (e.g. Planke et al., 1991). These values are also difficult to interpret as either magmatic underplated or serpentinised
mantle, because both features are generally focused close to the break-up axis (Eldholm et al., 2000; Boillot and Froitzheim, 2001).
All these elements provide a consistent model for interpreting the T Reflection as the top of an initial old crystalline, high Vp basement crust likely to have been exhumed during the post Caledonian orogenic collapse? On the other hand, the T Reflection may be assimilated to a mylonitic front forming a round-shaped acoustic impedance contrast between a metamorphic lower plate with granulite/eclogitic material, and an upper plate involving crystalline rocks or meta-sediments (Fig. 8). Recent observations and interpretation, offshore Norway, Olesen et al. (2002); Osmundsen et al. (2003); Ebbing et al. (submitted) propose that such a crustal detachements and exhumed Caledonian terranes can be expected from the Lofoten area to the Trøndelag plateform. That confirms that our interpretation of the deep structures imaged beneath the NGR can be perfectely reliable even if more work needs to be done to confirm this hypothesis.
6. Conclusions
• Integrated studies involving both structural and geophysical investigations in a large-scale geodynamic thermo-kinematical modelling allowed to constrain better the late stage of the Vøring margin evolution. Our study demonstrates some of the complexities in the study of continental rift magmatism.
• 3D seismic data and data from borehole calibrations reveal pre-breakup Early-Campanian-Paleocene rifting event along the north Gjallar Ridge (NGR), located close to the Tertiary volcanics. The T Reflection represents the top of the continental part of an LCB.
• During the latest stage of rifting, the deformation migrates towards the oceanic domain as both suggested by the modelling and the seismic observations. The breakup is assumed to be sudden and relates to the onset of differential stretching and magmatism that probably induces narrow zones of weakness at a different level along the breakup axis.
• Our observations clearly demonstrate that part of the LCB, imaged beneath the NGR was already in place before the main volcanic event and SDRS emplacement. The T Reflection influenced the structural development of the sedimentary basin at least 10-15 Myr prior to breakup.
• We point out in this paper some challenging questions regarding the long-standing belief of magmatic underplating influenced by a mantle plume, and show that alternatives do exist. The conclusion of the 2D thermo-kinematical parametric analysis is that the magmatic model predicts, along the outer Vøring Basin, either little extension (β < 2) with no melting or high extension (β > 5) with significant melting. This analysis suggests that high potential temperature is not always a pre-requisite to generate a huge amount of underplating. The modelling also shows that most of the melt occurs during the breakup and can moderately start during the Paleocene.
• Assuming the chronologic discrepancy between the deformation (pre-Paleocene) and the paroxysme of the partial melting (late Paleocene-early Eocene), the LCB below the NGR is preferentially interpreted here to partly (or fully?) represent a high P-wave velocity crystalline basement of old retrograde high- and ultra-high-pressure rocks (granulite/eclogite material).
• This interpretation could have major implications for estimates of the thermal history, petroleum assessment, mantle temperature and magmatic production along the Vøring volcanic rifted margin because the amount of mafic material emplaced could be 20-40% less than has been hitherto thought.
Acknowledgements
This work is part of the sub-basalt imaging project realised by collaboration between the "Institut Universitaire Europeen de la Mer" (IUEM, Brest, France) and the Total Exploration Norge Research Center. We thank geologists and geophysists of Total Exploration Norge in Stavanger for stimulating discussions. The manuscript greatly profited from the late comments and review of Brian O´Reilly and Hilary O’Donnell from the Dublin Institute for Advanced Studies. Jolante van Vijk, Hans Thybo and an anonymous reviewer are thanked for their many insightful comments and suggestions that helped to improve the paper substantially. We are also grateful to TGS-NOPEC, the Norwegian Petroleum Directory for permission to publish seismic sections and gravity data. We also thank Total for using MARGE (the numerical code) and for permission to present these results.
References
Anderson, D.L. and Natland, J.H., 2005. A brief history of the plume hypothesis and its competitors: concept and controversy. In: G.R. Foulger, Anderson, D.L., Natland J.H. and Presnall, D.C. (Editors), Plates, Plumes & Paradigms. Geological Society of America, Special Paper 388, in press.
Athy, L.F., 1930. Density, porosity, and compaction of sedimentary rocks. American Association of Petroleum Geologist Bulletin, 14: 1-24.
Barboza, S.A., Bergantz, G.W. and Brown, M., 1999. Regional granulite facies metamorphism in the Ivrea zone: Is the Mafic Complex the smoking gun or a red herring? Geology, 27(5): 447-450.
Berndt, C., Skogly, O.P., Planke, S., Eldholm, O. and Mjelde, R., 2000. High velocity break-up related sills in the Vøring Basin off Norway. Journal of Geophysical Research, 105, B12: 28,443-28,455.
Berndt, C., Mjelde, R., Planke, S., Shimamura, H. and Faleide, J.I., 2001. Controls on the tectono-magmatic evolution of a volcanic transform margin: the Vøring Transform Margin, NE-Atlantic. Marine Geophysical Research, 22: 133-152.
Birch, A.F. and Clark, H., 1940. The thermal conductivity of rocks and its dependence upon temperature and composition (Part 1). American Journal of Science, 238(8): 529-558.
Boillot, G. and Froitzheim, N., 2001. Non-Volcanic rifted margins, continental break-up and the onset of sea-floor spreading: some outstanding questions. In: R.C.L. Wilson, R.B. Whitmarsh, B. Taylor and N. Froitzheim (Editors), Non-Volcanic Rifting of Continental Margins: A comparison of Evidence from Land and Sea. Geological Society Special Publication, The Geological Society, London, pp. 9-30.
Boutillier, R.R. and Keen, C.E., 1999. Small-scale convection and divergent plate boundaries. Journal of Geophysical Research, 104(B4): 7389-7403.
Bown, J.W. and White, R.S., 1995. Effect of finite extension rate on melt generation at rifted continental margins. Journal of Geophysical Research, 100(B9): 18,011-18,030 (94JB01478). Braun, J. and Beaumont, C., 1989. A physical explanation of the relation between flank uplifts and
the breakup unconformity at rifted continental margins. Geology, 17(8): 760-764.
Brekke, H., 2000. The tectonic evolution of the Norwegian Sea continental margin with emphasis on the Vøring and Møre Basins. In: A. Nøttvedt (Editor), Dynamics of the Norwegian Margin. Geological Society Special Publication, The Geological Society, London, pp. 327-378.
Brigaud, F., Chapman, D.S. and Le Douaran, S., 1990. Estimating thermal conductivity in sedimentary basins using lithologic data and geophysical well logs. American Association of Petroleum Geologist Bulletin, 74(9): 1459-1477.
Brigaud, F. and Vasseur, G., 1989. Mineralogy, porosity and fluid control on thermal conductivity of sedimentary rocks. Geophysical Journal International, 98: 525-542.
Brun, J.P., 1999. Narrow rifts versus wide rifts:inferences for the mechanics of rifting from laboratory experiments. Philosophical Transaction of the Royal astronomy Society, ser. A, 357: 695-712.
Buck, W.R., 1986. Small-scale convection induced by passive rifting; the cause for uplift of rift shoulders. Earth and Planetary Science Letters, 77(3-4): 362-372.
Bugge, T., Prestvik, T. and Rokoengen, K., 1980. Lower Tertiary volcanic rocks off Kristiansund-Mid Norway. Marine Geology, 35: 215-220.
Burov, E.B. and Diament, M., 1995. The effective elastic thickness (Te) of continental lithosphere: what does it really mean? Journal of Geophysical Research, 100(B3): 3905-3927.
Callot, J.P., Geoffroy, L. and Brun, J.P., 2002. Development of volcanic passive margins: Three-dimensional laboratory models. Tectonics, 21(6): 1052.
Chapman, D.S., Keho, T.H., Bauer, M.S. and Picard, M.D., 1984. Heat flow in the Uinta basin determined from bottom hole temperature (BHT) data. Geophysics, 49: 453-466.
Christiansson, P., Faleide, J.I. and Berge, A.M., 2000. Crustal structure in the northern North Sea: an integrated geophysical study. In: A. Nøttvedt (Editor), Dynamics of the Norwegian Margin. Geological Society Special Publication, The Geological Society, London, pp. 15-40. Clauser, C. and Huenges, E., 1994. Thermal conductivity of rocks and minerals. In: T.J. Ahrens
(Editor), AGU Handbook of Physical Constants. American Geophysical Union, Washington D.C.
Corfield, S.M., Wheeler, W., Karpuz, R., Wilson, M. and Helland, R., 2004. Exploration 3D seismic over the Gjallar Ridge, Mid-Norway: visualization of structures on the Norwegian volcanic margin from Moho to seafloor. In: R.J. Davies, J.A. Cartwright, S.A. Stewart, M. Lappin and J.R. Underhill (Editors), 3D Seismic Technology: Apllication to the Exploration of Sedimentary Basins. Geological Society, London, Memoirs 29, The Geological Society, London, pp. 177-185.
Cox, K.G., 1993. Continental magmatic underplating. Royal Society of London Philosophical Transactions, A(342): 155-166.
Davis M. and Kusznir N., 2004. Depth-Dependent Lithospheric Stretching at Rifted Continental Margins. In: G.D. Karner (Editor), Proceedings of NSF Rifted Margins Theoretical Institute, , Columbia University Press, pp. 92-136.
Digranes, P., Mjelde, R., Kodaira, S., Shimamura, H., Kanazawa, T., Shiobara, H. and Berg, E.W., 1998. A regional shear-wave velocity model in the central Vøring Basin, N. Norway, using three-component Ocean Bottom Seismographs. Tectonophysics, 293: 157-174.
Doré, A.G., Lundin, E.R., Jensen, L. N., Birkeland, Ø., Eliassen, P.E. and Fichler, C., 1999. Principal tectonic events in the Northwest European Atlantic margin. In: A.J. Fleet and S.A.R. Boldy (Editors), Petroleum Geology of Northwest Europe: Proceedings of the 5th Conference. Geological Society Special Publication, London, pp. 41-61.
Ebbing, J., Lundin, E., Olesen, O., Hansen, E.K., 2005. The mid-Norwegian margin: A discussion of crustal lineamnets, mafic intrusions and remnants of the Caledonian root by 3D density modelling and structural interpretation. Journal of the Geological Society, London, submitted. Ebinger, C.J. and Casey, M., 2001. Continental breakup in magmatic provinces: An Ethiopian
example. Geology, 29: 527-530.
Eldholm, O., Gladczenko, T.P., Skogseid, J. and Planke, S., 2000. Atlantic volcanic margins: a comparative study. In: A. Nøttvedt (Editor), Dynamics of the Norwegian Margin. Geological Society Special Publication, The Geological Society, London, pp. 411-428.
Eldholm, O. and Grue, K., 1994. North Atlantic volcanic margins: dimensions and production rates. Journal of Geophysical Research, 99: 2955-2968.
Eldholm, O., Thiede, J. and Taylor, E., 1989. Evolution of the Vøring volcanic margin. In: O. Eldholm, J. Thiede and E. Taylor (Editors), Proceedings ODP Scientific Results. Ocean Drilling Program, College Station, TX, 104:1033-1065.
Færseth, R.B. and Lien, T., 2002. Cretaceous evolution in the Norwegian Sea-a period characterized by tectonic quiescence. Marine and Petroleum Geology, 19: 1005-1027.
Fichler, C., Rundhovde, E., Olesen, O., Sæther, B.M., Rueslåtten, H., Lundin, E. and Doré, A.G., 1999. Regional tectonic interpretation of image enhanced gravity and magnetic data covering the Mid-Norwegian shelf and adjacent mainland. Tectonophysics, 306: 183-197.
Foulger, G.R. and Anderson, D.L., 2005. A cool model for the Iceland hotspot. Journal of Volcanic and Geothermal Research, 141: 1-22 doi:10.1016/j.jvolgeores.2004.10.007.
Fountain, D.M., Boundy, T.M., Austrheim, H. and Rey, P., 1994. Eclogite-facies shear zones-deep crustal reflectors? Tectonophysics, 232: 411-424.
Gac, S. and Geoffroy, L. 2005. Thermo-mechanical modelling in 3D of a stretched continental lithopshere containing localized low-viscosity anomalies (the soft-point theory of plate break-up). Earth and Planetary Science Letters. Submitted
Geoffroy, L., Gélard, J.P., Lepvrier, C. and Olivier, P., 1998. The coastal flexure of Disko (West Greenland), onshore expression of the oblique reflectors. Journal of the Geological Society London, 155: 464-473.
Gernigon, L., Ringenbach, J.C., Planke, S. and Le Gall, B., 2004. Deep structures and breakup along volcanic rifted margins: Insights from integrated studies along the outer Vøring Basin (Norway). Marine and Petroleum Geology, 21(3): 363-372.
Gernigon, L., Ringenbach, J.-C., Planke, S., Le Gall, B. and Jonquet-Kolstø, H., 2003. Extension, Crustal Structure and magmatism at the Outer Vøring Basin, North Atlantic Margin, Norway. Journal of the Geological Society London, 160: 197-208.
Green, D.H. and Ringwood, A.E., 1967. The genesis of basaltic magmas. Contributions to Mineralogy and Petrology, 15: 103-190.
Hansen, J. P. V., Cartwright, J.A., Huuse, M. and O. R. Clausen, O.R., 2005. 3D seismic expression of fluid migration and mud remobilization on the Gjallar Ridge, offshore mid-Norway: Basin Research, 17:123-139.
Hofmeister, A.M., 1999. Mantle values of thermal conductivity and the geotherm from phonon lifetimes. Science, 283: 1699-1706.
Holbrook, W.S. and Kelemen, P.B., 1993. Large igneous province on the US Atlantic margin and implications for magmatism during continental breakup. Nature, 364: 433-436.
Jarvis, G. and McKenzie, D.P., 1980. Sedimentary basin formation with finite extension rates. Earth and Planetary Science Letters, 48: 42-52.
Jones, S.M. and White, N., 2003. Shape and size of the starting Iceland plume swell. Earth and Planetary Science letters, 216: 271-282.
Keen, C.E. and Dehler, S.A., 1997. Extensional styles and gravity anomalies at rifted continental margins: some North Atlantic examples. Tectonics, 16(5): 744-754.
Koyi, H. and Skelton, A., 2001. Centrifuge modelling of the evolution of low-angle detachment faults from high-angle normal faults. Journal of structural Geology, 23: 1179-1185.
Kooi, H., Cloetingh, S. and Burrus, J., 1992. Lithospheric necking and regional isostasy at extensional basins 1. Subsidence and gravity modelling with an application to the Gulf of Lions Margin (SE France). Journal of Geophysical Research, 97(B12): 17,553-17,571.
Korenaga, J., 2004. Mantle mixing and continental breakup magmatism. Earth and Planetary Science Letters, 218: 463-473.
Lachenbruch, A.H., Sass, J.H. and Galanis, S.P., Jr., 1985. Heat Flow in Southernmost California and the Origin of the Salton Trough. Journal of Geophysical Research, 90(B7): 6709-6736. Laske, G. and Masters, G., 1997. A Global Digital Map of Sediment Thickness. EOS Trans. AGU,
78: F483.
Latil-Brun, M.V. and Lucazeau, F., 1988. Subsidence, extension and thermal history of the West African margin in Senegal. Earth and Planetary Science Letters, 90(2): 204-220.
Lucazeau, F., Brigaud, F. and Leturmy, P., 2003. Dynamic interactions between the gulf of Guinea passive margin and the Congo river drainage basin. Part II: isostasy and uplift. Journal of Geophysical Research, 108( B8): 2384 10.1029/2002JB001928.
Lundin, E.R. and Doré, A.G., 1997. A tectonic model for the Norwegian passive margin with implications for the NE Atlantic: Early Cretaceous to break-up. Journal of the Geological Society London, 154: 545-550.
Maclennan, J. and Lovell, B., 2002. Control of regional sea level by surface uplift and subsidence caused by magmatic underplating of Earth's crust. Geology, 30(8): 675-678.