Université du Québec
Institut National de la Recherche Scientifique Institut Armand-Frappier
L’HYDROGENE MOLECULAIRE EN TANT QUE MODULATEUR DES
COMMUNAUTES MICROBIENNES DU SOL
Par
Sarah Piché-Choquette
Thèse présentée pour l’obtention du grade de Philosophiae doctor (Ph.D.)
en biologie
Jury d’évaluation
Présidente du jury et Pre Annie Castonguay
Examinatrice interne INRS-Institut Armand-Frappier
Examinateur externe Pr Marc St-Arnaud
Institut de recherche en biologie végétale
Université de Montréal Examinateur externe Pr Jean-Philippe Bellenger
Université de Sherbrooke Directeur de recherche Pr Philippe Constant
INRS-Institut Armand-Frappier
REMERCIEMENTS
Je remercie d’abord mon directeur de thèse, le professeur Philippe Constant, qui m’a permis d’œuvrer au sein de son laboratoire et d’évoluer d’un point de vue scientifique pendant ma maîtrise et mon doctorat. Merci à tous les membres du laboratoire pour votre collaboration et votre encouragement. Merci Anne, Livie et Julien pour les longues discussions scientifiques, philosophiques et personnelles. Merci Quentin et David pour nos conversations sans queue ni tête. Je tiens aussi à remercier les membres des laboratoires de Richard et Claude et ceux des comités au sein desquelsj’ai œuvré. Je remercie le professeur Josh D. Neufeld et les docteurs Martin Hartmann et Roland Wilhelm pour leurs discussions enrichissantes, l’encouragement et le support moral qu’ils m’ont apportés. Josh, I’ll always remember our first chat at IUMS 2014 as a volunteer, or even your audio “pep talk” regarding my involvement in the Armand Frappier Conference as well as your personal welcome in your lab in Waterloo. Martin, in spite of my comprehensive exam, I quickly realized how much of a rare gem you are, both as a person and as a scientist. Our discussions helped me shape my career path, be more confident in my abilities and question myself often to avoid scientific prejudice. I enjoyed your welcome in Zurich, I felt pretty much at home despite the distance. Roli, I’ll remember our never-ending discussions under the moonlight while gazing at the silent thunder off in the distance… I never expected to meet a scientist who could understand me so much. I’m glad to know that I am not alone and that people like us can succeed in academia. Je remercie également ma famille et mes amis, qui m’ont remonté le moral tout au long de ce périple tortueux. Un merci spécial à mes parents, à Sonia, Éric, Esteban, Audrey-Lou, Simon, Stéphanie P, Vincent, Caroline M, Charles, Mathieu, Maxime, Guillaume, Amélie, Philippe I, Camylle, Stéphanie R et Caroline B. Vous êtes irremplaçables.
Je remercie mon conjoint, Jean-Marc, sans qui je n’aurais jamais eu la motivation de terminer cette thèse. Jean-Marc m’a aidé à surmonter les embûches rencontrées pendant mon parcours, dont les présentations, examens, articles, décès dans mon entourage, le syndrome de l’imposteur et les multiples agressions que j’ai subies par des gens de
iv
RÉSUMÉ
L’hydrogène moléculaire (H2) est une source d’énergie ubiquitaire, retrouvée à l’état de trace dans l’atmosphère global, mais en plus fortes concentrations dans de nombreux écosystèmes tels que les terres humides et la rhizosphère des légumineuses fixatrices d’azote. Une grande majorité des bactéries fixatrices d’azote recrutées par les légumineuses utilisées en agriculture sont dépourvues d’hydrogénase, ce qui implique que l’H2 produit par l’enzyme nitrogénase diffuse dans le sol. Compte tenu du fort potentiel énergique de l’H2, celui-ci est rapidement oxydé par les microorganismes oxydant l’H2 (HOM) et ce, dans un rayon de 3 à 4,5 cm de la source. Ces microorganismes ont des capacités physiologiques variées, se retrouvent dans des niches écologiques oxiques et anoxiques et sont distribués parmi plus de 40 embranchements taxonomiques. Bien que des études ont montré que certaines HOM promeuvent la croissance des plantes in vitro, l’impact de l’H2 sur les communautés microbiennes du sol est inconnu. Le but de cette thèse est donc d’élucider ce mystère en explorant le potentiel de l’H2 à structurer les processus biogéochimiques du sol. Les hypothèses de recherche sont ainsi que de fortes concentrations d’H2, représentatives d’écosystèmes riches en H2, altéreront directement et indirectement la structure et la fonction des communautés microbiennes du sol et ce, en fonction de la dose d’exposition à l’H2. Un effet direct implique un changement associé à la distribution et l’activité métabolique des HOM, alors que les effets indirects incluent des processus autres que l’oxydation de l’H2. Afin de pouvoir valider ces hypothèses, un système de microcosmes à flux dynamique a été conçu au laboratoire et a permis d’incuber des microcosmes de sols à des rapports stœchiométriques d’H2précis, s’échelonnant de 0,5 à 10 000 ppmv d’H2. Trois sols prélevés dans une plantation de peupliers, une plantation de mélèzes et une terre agricole ont été utilisés en raison de leurs propriétés biotiques et abiotiques contrastantes. À la suite des incubations, les profils de diversité des communautés microbiennes—bactériennes, fongiques et bactériennes à haute affinité pour l’H2 (HA-HOB)—ainsi que divers processus qui leur sont propres, ont été analysés. D’abord, de nombreux effets directs ont été recensés. Les mesures de potentiel d’oxydation de l’H2 en cours d’incubation ont montré qu’une exposition des HOM à de fortes concentrations d’H2 menait à une activation rapide du métabolisme des HOM à faible affinité, tout en inhibant celui des HA-HOB. Globalement, le Kmet le Vmaxdu métabolisme d’oxydation de l’H2ont augmentés significativement post-incubation. En ce qui a trait à la structure des communautés de HA-HOB, l’abondance relative de centaines de génotypes a été altérée. De manière surprenante, aucun de ces génotypes ne correspondait à ceux actuellement répertoriés dans les bases de données génomiques publiques. Ensuite, plusieurs effets indirects ont aussi été documentés post-incubation. Trois fonctions autres que l’oxydation d’H2 ont été altérées, dont une réduction de l’oxydation du méthane (CH4) et du monoxyde de carbone (CO) et une stimulation de l’utilisation de nombreux substrats carbonés. La réponse globale de ces fonctions fut universelle, bien que l’intensité de l’altération se soit avérée dépendante des conditions biotiques et abiotiques des trois sols étudiés. De plus, l’abondance relative de microorganismes n’oxydant pas l’H2—des Champignons et des assemblages de génomes partiels bactériens exempts de gènes codant pour des hydrogénases—a aussi été affectée et ce, de manière idiosyncratique
entre les trois sols analysés. Les relations de dose-réponse entre la dose d’exposition à l’H2et la réponse observée furent mineures au niveau de la structure des communautés, mais majeures au niveau de ses fonctions. En effet, bien que l’abondance relative de nombreux phylotypes soit proportionnelle à la concentration d’H2, la contribution de ceux-ci sur l’ensemble de la diversité β fut négligeable. En revanche, les fonctions mesurées, soient la vitesse d’oxydation d’H2à faible affinité ainsi que celle d’oxydation de l’H2, du CH4et du CO à haute affinité, étaient proportionnelles à la dose d’exposition. L’altération de processus d’oxydation de gaz traces en fonction de la distance d’une source ponctuelle productrice d’H2 a donc pu être modélisée, permettant ainsi de représenter spatialement ce continuum métabolique. Cette thèse a apporté de nombreuses nouvelles connaissances aux domaines de la biogéochimie et de l’écologie microbienne en démontrant l’interaction de l’H2avec des processus biogéochimiques variés, en plus de soulever de nombreuses questions. Les diverses interactions entre les cycles biogéochimiques de l’H2 et du carbone impliqueraient entre autres que les HOM, dont l’activité est généralement considérée comme une fonction spécialiste, pourraient en fait être davantage des groupes fonctionnels inhéremment mixotrophes ou même généralistes.
vi
ABSTRACT
Molecular hydrogen (H2) is a ubiquitous energy source found in trace amounts in the global atmosphere, but in higher concentrations in ecosystems such as wetlands and the rhizosphere of nitrogen-fixing legumes. Most nitrogen-fixing bacteria recruited by agriculturally-relevant legumes are devoid of hydrogenases, thus H2 generated by nitrogenase enzymes diffuses into soils. Due to its strong energy potential, H2is quickly oxidized by H2-oxidizing microbes (HOM), that is, within a 3-4.5 cm radius from its source. Those microbes have broad physiological capabilities, are found in both oxic and anoxic ecological niches, and are distributed among more than 40 phyla. While studies have shown that some HOM isolates promote plant growth in vitro, the overall impact of H2on soil microbial communities is unknown. The goal of this thesis is thus to shed light upon the potential of H2 as a driver of soil biogeochemical processes. Specific research hypotheses are that elevated concentrations of H2, representative of H2-rich ecosystems, will directly or indirectly alter the structure and function of soil microbial communities, and that the ensuing responses will be proportional to H2exposure. Direct effects consist of changes in HOM distribution and metabolic activity, while indirect effects are associated with processes unrelated to H2 metabolism. In order to validate these hypotheses, a dynamic microcosm chambers system was designed in the lab, thus enabling the incubation of soil microcosms to precise H2 stoichiometric ratios ranging from 0.5 to 10,000 ppmv H2. Sites sampled include a poplar monoculture, a larch monoculture and a farmland due to their contrasting biotic and abiotic features. Following the incubations, microbial communities—bacterial, fungal and high-affinity H2-oxidizing bacteria (HA-HOB)—diversity profiles as well as several of their underlying processes were analyzed. Firstly, several direct effects were identified. Potential H2 oxidation rates measured throughout the incubation have shown that HOM exposure to elevated H2concentrations leads to a swift activation of low-affinity HOM H2 metabolism, all the while inhibiting the H2metabolism of HA-HOB. Overall, Km and Vmaxof H2 oxidation metabolism increased significantly post-incubation. In terms of HA-HOB community structure, the relative abundance of hundreds of genotypes was altered. Surprisingly, none of them matched those currently listed in public genomic databases. Secondly, numerous indirect effects were identified post-incubation. Three functions unrelated to H2oxidation were altered,
i.e. an abatement in methane (CH4) and carbon monoxide (CO) oxidation and a stimulation of carbon substrates utilization. Global functional responses were universal, yet the intensity of such alterations depended on soil biotic and abiotic conditions. Furthermore, the relative abundance of non-H2-oxidizing microbes—Fungi and partial genome assemblies devoid of hydrogenase-coding genes—was also affected idiosyncratically between the three soils analyzed. Dose-response relationships between H2exposure and response at the community structure level was minor, however major changes were observed at the functional level. Indeed, despite the fact that the relative abundance of numerous phylotypes was proportional to the H2 concentration, their contribution to overall β-diversity was negligible. However, measured functions, i.e. low-affinity H2 oxidation rates and high-affinity H2, CH4 and CO oxidation rates, were proportional to the exposure dose. The alteration of trace gases oxidation processes as a function of distance from an H2 point source was modeled to spatially represent this
metabolic continuum. This thesis has brought significant knowledge to the fields of biogeochemistry and microbial ecology by demonstrating the interaction between H2and various biogeochemical processes in addition to have raised several questions. For instance, interactions between H2 and carbon biogeochemical cycles would imply that HOM, whose activity is generally assumed to be a specialist function, could in fact be an inherently mixotrophic or generalist functional group.
viii
AVANT-PROPOS
Cette thèse est écrite sous forme de thèse par articles, incluant cinq articles révisés par les pairs et publiésainsi qu’une introduction et une discussion globales permettant de lier ces articles. Le premier chapitre (1) constitue une revue de littératureabordant d’une part la diversité des microorganismes produisant ou utilisant l’hydrogène moléculaire (H2), suivi de la proposition duconcept que l’H2est, via les microorganismes qui l’utilisent, un joueur clé du cycle du carbone dans de nombreux écosystèmes. Le second chapitre (2) élabore la mise en contexte, la problématique, les hypothèses et objectifs de recherche de ma thèse. Les chapitres suivants (3-6) consistent en quatre articles publiés dans différents journaux scientifiques. Un récapitulatif des conclusions tirées ainsi que l’intégration de ces articles de manière à justifier leur apport à la littérature scientifique se trouve ensuite au chapitre (7). Quelques projets connexes en cours ainsi que des perspectives par suite de cette thèse sont décrits dans ce même chapitre. Le dernier chapitre (8) fait état de la bibliographie à laquelle cette thèse se réfère. Finalement, des annexes contenant des liens URL permettant d’accéder au matériel supplémentaire de format hors-norme des articles publiés se trouvent à la fin du document. Ces tableaux et figures sont aussi disponibles sur le site web des journaux scientifiques où ont été publiés les articles.
TABLE DES MATIERES
1 MOLECULAR HYDROGEN, A NEGLECTED KEY DRIVER OF SOIL BIOGEOCHEMICAL
PROCESSES... 1
1.1 RÉSUMÉ EN FRANÇAIS... 2
1.2 ABSTRACT... 2
1.3 INTRODUCTION... 3
1.4 HYDROGENASES CLASSIFICATION:AN OVERVIEW... 5
1.4.1 [Fe]-hydrogenases ... 6
1.4.2 [FeFe]-hydrogenases ... 8
1.4.3 [NiFe]-hydrogenases ... 9
1.5 OVERVIEW OF THE H2BIOGEOCHEMICAL CYCLE... 15
1.5.1 H2production in anoxic ecosystems ... 16
1.5.2 H2production in oxic ecosystems ... 17
1.5.3 H2uptake in anoxic ecosystems ... 18
1.5.4 H2uptake in oxic ecosystems ... 23
1.6 JUXTAPOSITION OF THE H2AND CBIOGEOCHEMICAL CYCLES IN SOILS ALONG THEORETICAL O2 GRADIENTS... 25
2 MISE EN CONTEXTE DU PROJET DE THESE ... 29
2.1 PROBLÉMATIQUE... 29
2.2 BUT DU PROJET... 33
2.3 HYPOTHÈSES... 33
2.4 OBJECTIFS... 36
3 H2-SATURATION OF HIGH AFFINITY H2-OXIDIZING BACTERIA ALTERS THE ECOLOGICAL NICHE OF SOIL MICROORGANISMS UNEVENLY AMONG TAXONOMIC GROUPS.. 37
3.1 RÉSUMÉ EN FRANÇAIS... 38
3.2 ABSTRACT... 38
3.3 INTRODUCTION... 39
3.4 MATERIAL AND METHODS... 41
3.4.1 Soil Sample ... 41
3.4.2 Controlled H2exposure in dynamic soil microcosm chambers ... 41
3.4.3 H2uptake activity ... 42
3.4.4 DNA extraction, qPCR and high-throughput sequencing of PCR-amplified bacterial 16S rRNA gene ... 43
x
3.4.7 Statistical analyses ... 45
3.5 RESULTS AND DISCUSSION... 46
3.5.1 Impact of H2exposure on the distribution and activity of HOB ... 46
3.5.2 Impact of H2exposure on soil bacterial community structure ... 49
3.5.3 Impact of H2exposure on the co-occurrence of OTUs ... 54
3.6 CONCLUSION... 55
3.7 ACKNOWLEDGMENTS... 56
3.8 SUPPLEMENTARY MATERIAL... 57
3.8.1 Construction of weighted co-occurrence networks ... 57
3.8.2 Comparison of networks patterns across treatments ... 57
3.8.3 Conluding remarks regarding the impact of H2exposure on OTU co-occurrence – Only a few modules are conserved between aH2and eH2networks ... 59
4 THE TALE OF A NEGLECTED ENERGY SOURCE: ELEVATED HYDROGEN EXPOSURE AFFECTS BOTH MICROBIAL DIVERSITY AND FUNCTION IN SOIL ... 65
4.1 RÉSUMÉ EN FRANÇAIS... 67
4.2 ABSTRACT... 67
4.3 IMPORTANCE... 68
4.4 INTRODUCTION... 68
4.5 RESULTS... 71
4.5.1 Soil physicochemical properties and microbial metabolism... 71
4.5.2 Taxonomic profile of soil microbial communities ... 74
4.5.3 Metagenomic profile of soil microbial communities... 78
4.5.4 Disentangling the idiosyncratic impact of H2on microbial communities ... 80
4.6 DISCUSSION... 82
4.7 MATERIALS AND METHODS... 86
4.7.1 Soil samples ... 86
4.7.2 Soil microcosm incubations ... 86
4.7.3 Measurement of gas exchanges ... 87
4.7.4 Carbon metabolism ... 88
4.7.5 Nucleic acid extraction and purification ... 89
4.7.6 Bacterial, archaeal and fungal communities ... 89
4.7.7 Metagenomic analysis ... 89
4.7.8 Nucleotide sequences accession numbers ... 90
4.7.9 Statistical analyses ... 90
4.8 ACKNOWLEDGMENTS... 92
4.9.1 Method S1. Description of hypothesized paths constituting the models predicting direct and
indirect effects of H2exposure on measured microbial processes ... 92
4.9.2 Method S2. Dynamic microcosm chamber unit... 96
4.9.3 Method S3. Metagenomic analysis pipeline ... 97
5 SURVEY OF HIGH-AFFINITY H2-OXIDIZING BACTERIA IN SOIL REVEALS THEIR VAST DIVERSITY YET UNDERREPRESENTATION IN GENOMIC DATABASES ... 109
5.1 RÉSUMÉ EN FRANÇAIS... 110 5.2 ABSTRACT... 110 5.3 MAIN PAPER... 111 5.4 SUPPLEMENTAL METHOD... 117 5.4.1 PCR and RT-PCR ... 117 5.4.2 PCR amplicon sequencing ... 117 5.4.3 Phylogenetic analysis ... 117 5.4.4 Statistical analyses ... 118
6 DOSE-RESPONSE RELATIONSHIPS BETWEEN ENVIRONMENTALLY-RELEVANT H2 CONCENTRATIONS AND THE BIOLOGICAL SINKS OF H2, CH4AND CO IN SOIL ... 119
6.1 RÉSUMÉ EN FRANÇAIS... 120
6.2 ABSTRACT... 121
6.3 INTRODUCTION... 122
6.4 MATERIAL AND METHODS... 124
6.4.1 Soil sampling and microcosms incubation ... 124
6.4.2 Nucleic acids extraction and purification ... 125
6.4.3 PCR amplicon sequencing and sequences analysis pipeline ... 125
6.4.4 Trace gases exchange measurements ... 127
6.4.5 H2fluxes and concentrations theoretical framework ... 127
6.4.6 Distribution of trace gases oxidation rates altered by H2on a spatial scale ... 131
6.4.7 Statistical analyses ... 131
6.5 RESULTS... 132
6.5.1 Changes in microbial community structure over the H2concentration gradient ... 132
6.5.2 Dose-response relationships between H2mixing ratio and trace gases oxidation rates .... 135
6.5.3 Projection of H2concentration gradients in soils exposed to a H2point source ... 137
6.5.4 Trace gases oxidation rates as a function of distance from H2-emitting point sources ... 138
6.6 DISCUSSION... 139
6.7 ACCESSION NUMBERS... 143
xii
7 DISCUSSION ... 144
7.1 EFFETS DIRECTS DE L’H2SUR LA STRUCTURE ET LA FONCTION DES COMMUNAUTÉS MICROBIENNES DU SOL... 144
7.2 EFFETS INDIRECTS DE L’H2SUR LA STRUCTURE ET LA FONCTION DES COMMUNAUTÉS MICROBIENNES DU SOL... 151
7.3 RELATIONS DE DOSE-RÉPONSE ENTRE LA CONCENTRATION D’H2ET LES ALTÉRATIONS DES COMMUNAUTÉS MICROBIENNES DU SOL... 154
7.4 CONCLUSION ET PERSPECTIVES... 158
8 REFERENCES... 160
9 ANNEXE 1 – MATÉRIEL SUPPLÉMENTAIRE DE FORMAT HORS-NORMES ASSOCIÉ À L’ARTICLE “MOLECULAR HYDROGEN, A NEGLECTED KEY DRIVER OF SOIL BIOGEOCHEMICAL PROCESSES ” ...187
9.1 FIGURE S1... 188
9.2 FIGURE S2... 188
9.3 FIGURE S3... 188
10 ANNEXE 2 – MATÉRIEL SUPPLÉMENTAIRE DE FORMAT HORS-NORMES ASSOCIÉ À L’ARTICLE “THE TALE OF A NEGLECTED ENERGY SOURCE: ELEVATED HYDROGEN EXPOSURE AFFECTS BOTH MICROBIAL DIVERSITY AND FUNCTION IN SOIL” ...189
10.1 DATA SET S1... 190 10.2 DATA SET S2... 191 10.3 DATA SET S3... 191 10.4 DATA SET S4... 191 10.5 DATA SET S5... 191 10.6 DATA SET S6... 191
11 ANNEXE 3 – MATÉRIEL SUPPLÉMENTAIRE DE FORMAT HORS-NORMES ASSOCIÉ À L’ARTICLE “SURVEY OF HIGH-AFFINITY H2-OXIDIZING BACTERIA IN SOIL REVEALS THEIR VAST DIVERSITY YET UNDERREPRESENTATION IN GENOMIC DATABASES”...192
11.1 TABLE S1... 193
11.2 TABLE S2... 193
11.3 FIGURE S1... 193
12 ANNEXE 4 – MATÉRIEL SUPPLÉMENTAIRE OU BASES DE DONNÉES ASSOCIÉS À L’ARTICLE “DOSE-RESPONSE RELATIONSHIPS BETWEEN ENVIRONMENTALLY-RELEVANT H2 CONCENTRATIONS AND THE BIOLOGICAL SINKS OF H2, CH4AND CO IN SOIL”...194
12.2 TABLE S2... 195 12.3 TABLE S3... 195 12.4 TABLE S4... 195
LISTE DES TABLEAUX
TABLE 3.1 SUMMARY OF OTUS SHOWING DIFFERENT RELATIVE ABUNDANCE IN EH2AND AH2TREATMENTS.. 54
TABLE 3.2 LIST OF BARCODES USED TO PREPARE BACTERIAL 16SRRNAGENE PCRAMPLICON LIBRARIESA.64 TABLE 4.1 SOIL PHYSICOCHEMICAL PARAMETERS AND PROCESS RATES MEASURED IN SOIL MICROCOSMS. ... 72
TABLE 4.2 UNEVEN RESPONSE OF DIFFERENT TAXONOMIC GROUPS (FAMILY LEVEL)OF BACTERIA AND FUNGI TO H2EXPOSURE AS A FUNCTION OF LAND-USE TYPE. ... 75
TABLE 4.3 ASSUMPTIONS OF THE STRUCTURAL EQUATION MODELS... 93
TABLE 4.4 VALUES REPRESENTING THE COMPOSITE VARIABLES... 94
TABLE 4.5 CALCULATED AND ESTIMATED SHANNON INDICES OF SOIL SAMPLES... 96
TABLE 4.6 ABSENCE OF CH4PRODUCTION IN SOIL MICROCOSMS... 100
TABLE 4.7 LIST OF GENOME BINS FOR WHICH THE DISTRIBUTION WAS INFLUENCED BY H2EXPOSURE... 101
TABLE 4.8 MULTIPLE LINEAR REGRESSION EQUATIONS DEFINING THE RELATIVE ABUNDANCE OF (A)GENOME BINS OUTLINED IN THEPCAAND THE CORRESPONDING (B) OTUS (RRNAMARKER GENE AMPLICON SEQUENCING)ACCORDING TO BIOTIC AND ABIOTIC PARAMETERS. ... 102
TABLE 4.9 GENOME BINS OF POTENTIAL HOBCONTAINING HYDROGENASE GENE BASED ON SEARCH IN METAGENOMIC ANNOTATION DATABASES (1GENE)AND [NIFE]-HYDROGENASE HMM (2GENES)... 103
TABLE 5.1 HA-HOBSPECIES RICHNESS AND QUANTIFICATION OF HHYLGENE AND TRANSCRIPT ACROSS H2 TREATMENTS AND LAND-USES... 112
TABLE 6.1 REGRESSION MODELS DEPICTING TRACE GASES OXIDATION PROCESSES AS A FUNCTION OF H2 EXPOSURE IN BOTH LAND-USES. H2MIXING RATIO IS IN PPMV... 136
LISTE DES FIGURES
FIGURE 1.1 CONSENSUS TREE OF 25 [FE]-HYDROGENASES SEQUENCES,WITH AN ALIGNMENT LENGTH OF 389 AMINO ACIDS... 7 FIGURE 1.2 CONSENSUS TREE OF 1217 [FEFE]-HYDROGENASES SEQUENCES,WITH AN ALIGNMENT LENGTH OF 3525AMINO ACIDS,COMPUTED AS DESCRIBED IN FIG. 1.1. ... 9 FIGURE 1.3 CONSENSUS TREE OF 1988 [NIFE]-HYDROGENASES SEQUENCES,WITH AN ALIGNMENT LENGTH OF
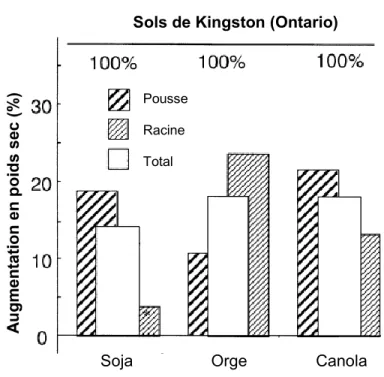
1850AMINO ACIDS,COMPUTED AS DESCRIBED IN FIG. 1.1. ... 11 FIGURE 1.4 JUXTAPOSITION OF THE CARBON CYCLE AND MAIN H2-OXIDIZING FUNCTIONAL GROUPS... 28 FIGURE 2.1 AUGMENTATION DU POIDS SEC DE PLANTES CULTIVÉES DANS DES SOLS PRÉTRAITÉS À DE L’AIR
ENRICHI EN H2COMPARÉ À DES PLANTES CULTIVÉES DANS DES SOLS TRAITÉS AVEC DE L’AIR... 32 FIGURE 2.2 EFFET DE L’ISOLAT VARIOVORAX PARADOXUSJM63SUR L’ÉLONGATION DES RACINES DE
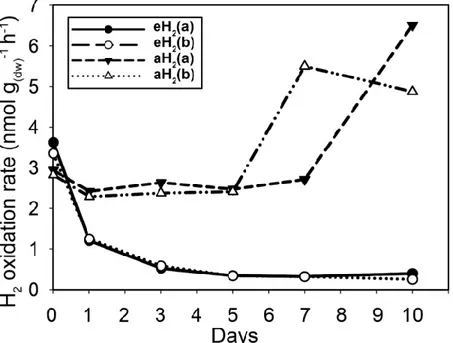
PLANTULES DE BLÉ D’HIVER APRÈS DEUX JOURS. ... 33 FIGURE 3.1 TIME SERIES OF THE HIGH-AFFINITY H2OXIDATION RATE MEASURED IN SOIL MICROCOSMS EXPOSED TO AH2OR EH2THROUGHOUT THE INCUBATION PERIOD. ... 46 FIGURE 3.2 TIME SERIES OF (A)HHYLAND (B) 16SRRNAGENE ABUNDANCE IN SOIL AS DETERMINED BY QPCR.
48
FIGURE 3.3 KINETIC PARAMETERS GOVERNING H2OXIDATION ACTIVITY IN SOIL MICROCOSMS INCUBATED UNDER (A)AH2AND (B)EH2EXPOSURE. ... 49
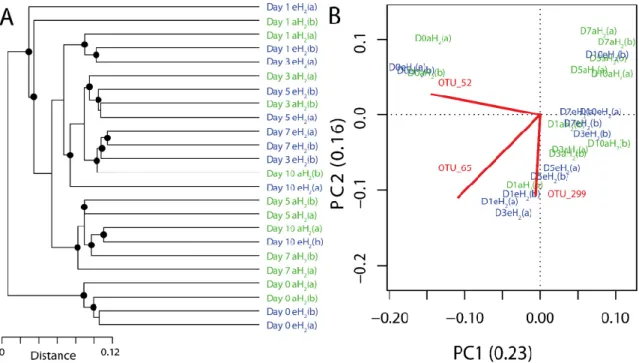
FIGURE 3.4 INFLUENCE OF H2EXPOSURE ON BACTERIAL RIBOTYPING PROFILES... 51 FIGURE 3.5 TIME SERIES OF THE RELATIVE ABUNDANCE OF THE 3 OTUS HAVING A HIGHER CONTRIBUTION THAN AVERAGE TO EXPLAIN THE TWO DIMENSIONS OF THE PCASPACE IN SOIL MICROCOSMS. ... 52 FIGURE 3.6 COMPOSITE PRESERVATION STATISTICS OF MODULES FROM THE EH2NETWORK (TEST NETWORK)
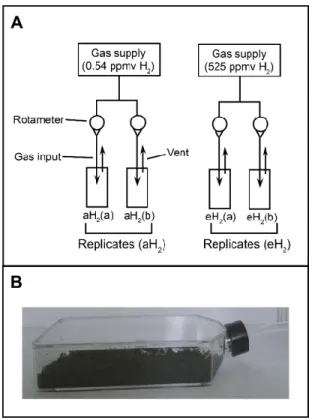
AGAINST MODULES FROM THE AH2NETWORK... 59 FIGURE 3.7 SCHEMATIC REPRESENTATION OF THE DYNAMIC MICROCOSM CHAMBERS... 60 FIGURE 3.8 TAXONOMIC PROFILES IN SOIL. ... 61 FIGURE 3.9 MODULE-TRAIT RELATIONSHIP HEATMAP FOR CORRELATION NETWORK COMPUTED USING OTU
COVARIATION PROFILE UNDER EH2OR AH2EXPOSURE. ... 62 FIGURE 3.10 TAXONOMIC PROFILE OF OTUS FOUND IN SELECTED MODULES OF CORRELATION NETWORKS.. 63 FIGURE 4.1 UPGMAAGGLOMERATIVE CLUSTERING OF SOIL MICROBIAL COMMUNITIES ACCORDING TO A
EUCLIDEAN DISTANCE MATRIX CALCULATED WITHHELLINGER-TRANSFORMED DATA. ... 77 FIGURE 4.2 (A) PCASHOWING THE DISTRIBUTION OF SOIL MICROCOSMS IN A REDUCED SPACE DEFINED BY THE RELATIVE ABUNDANCE OF THE 93GENOME BINS. ... 79 FIGURE 4.3 STRUCTURAL EQUATION MODELS TESTING CAUSAL ASSUMPTIONS OF SOIL BIOTIC AND ABIOTIC
VARIABLES ON MICROBIAL PROCESSES... 81 FIGURE 4.4 HYPOTHETICAL STRUCTURAL EQUATION MODEL... 93
FIGURE 4.5 REGRESSION ANALYSIS BETWEEN BACTERIAL SHANNON INDICES OBTAINED VIA DNA-BASED (INDEPENDENT VARIABLE)AND RNA-BASED (DEPENDENT VARIABLE)RIBOTYPING PROFILE... 95 FIGURE 4.6 REGRESSION ANALYSIS BETWEEN FUNGAL SHANNON INDICES OBTAINED VIA DNA-BASED
(INDEPENDENT VARIABLE)AND RNA-BASED (DEPENDENT VARIABLE)RIBOTYPING PROFILE... 95 FIGURE4.7 SCHEMATIC OF THE DYNAMIC MICROCOSM CHAMBER UNIT SETUP... 97 FIGURE 4.8 COMMUNITY-LEVEL CARBON SUBSTRATES UTILIZATION PROFILING... 105 FIGURE 4.9 OVERVIEW OF THE TAXONOMIC COMPOSITION OF BACTERIAL AND FUNGAL COMMUNITIES IN SOILS.
106
FIGURE 4.10 METAGENOMIC ANALYSIS USING MG-RASTPIPELINE. ... 107 FIGURE 4.11 BUBBLE-CHART REPRESENTATION OF OTUS ASSOCIATED WITH THE 4GENOME BINS OF
INTEREST. 108
FIGURE 5.1 CLASSIFICATION OF HHYL OTUS ACROSS A)A CONSENSUS PHYLOGENY ANALYSIS AND B)THE THREE LAND-USE TYPES. ... 114 FIGURE 5.2 PARSIMONIOUS RDAREPRESENTING THE DISTRIBUTION OF SOIL MICROCOSMS IN A REDUCED
SPACE ACCORDING TO THEIR HHYL OTUS DISTRIBUTION PROFILES CONSTRAINED WITH ENVIRONMENTAL VARIABLES... 115 FIGURE 6.1 PCADEPICTING THE DISTRIBUTION OF SOIL MICROCOSMS IN A REDUCED SPACE DEFINED BY THE
RELATIVE ABUNDANCES PROFILES OF A) BACTERIAL ASVIN FARMLAND SOIL, B) BACTERIAL ASVIN POPLAR SOIL, C) FUNGAL ASVIN FARMLAND SOIL AND D) FUNGAL ASVIN POPLAR SOIL. ... 135 FIGURE 6.2 STAIR-STEP PLOT OF MEASURED PROCESS RATES AS A FUNCTION OF H2EXPOSURE. ... 136 FIGURE 6.3 MODELED H2MIXING RATIOS AS A FUNCTION OF DISTANCE FROM A H2-EMITING POINT SOURCE. . 137 FIGURE 6.4 SIMULATED H2, COAND CH4OXIDATION RATES AS A FUNCTION OF DISTANCE FROM A H2-EMITING
LISTE DES ABRÉVIATIONS
% ... Percent (app)Km... Apparent Km
(app)Vmax... Apparent maximum rate achieved by the system (dw) ... Dry weight
[ ] ... Concentration “... Inch
°C ... Degree Celsius µL ... Microlitre
ACE... Abundance-based Coverage Estimator aH2... Atmospheric hydrogen
AMV ... Avian myeloblastosis virus ANOVA... Analysis of variance
ASV ... Amplicon sequence variant ATP ... Adenosine triphosphate BIO ... Biodiversity composite
BLAST... Basic Local Alignment Search Tool
BLASTN ... Basic Local Alignment Search Tool Nucleotide BLASTP ... Basic Local Alignment Search Tool Protein bp ... Base pair
BWA ... Burrows-Wheeler Aligner C... Carbon
C/N ... Carbon-to-nitrogen ratio CH4... Methane
cm ... Centimeter cm3... Cubic centimeter CO... Carbon monoxide CO2... Carbon dioxide
COG ... Clusters of Orthologous Groups of proteins CPM ... Count per million
DL... Detection limit
DNA... Deoxyribonucleic acid DOE ... Department of energy dsDNA... Double-stranded DNA
DUK... Decontamination Using Kmers e-... Electron
e.g. ... Exempli gratia (for example)
F (sample) ... Farmland FC ... Fold-change
FID ... Flame ionization detector g ... gram
Gb ... Gigabase
GC... Gas chromatograph GI ... GenInfo Identifier h ... Hour
H (sample)... High mixing ratio (10,000 ppmv) H+... Proton
H2... Hydrogen
HAH... High-affinity [NiFe]-hydrogenases HA-HOB ... High-affinity hydrogen-oxidizing bacteria HMM... Hidden Markov Model
HOB ... Hydrogen-oxidizing bacteria HOM... Hydrogen-oxidizing microbes
i.e. ... Id est (in other words)
ITS... Internal transcribed spacer JGI... Joint Genome Institute JTT ... Jones-Taylor-Thornton
KEGG... Kyoto Encyclopedia of Genes and Genomes KM... Michaelis constant
KOG ... EuKaryotic Orthologous Groups L (soil) ... Larch soil
L (treatment) Low mixing ratio (0.5 ppmv) LG ... Le and Gascuel
LR... Likelihood ratio
MBH ... Membrane-bound hydrogenase
MEGA... Molecular Evolutionary Genetics Analysis H4MPT... Tetrahydromethanopterin
MG-RAST.... Metagenomics Rapid Annotation using Subsystem Technology min ... Minute
ml ... Milliliter
ML ... Maximum likelihood mm ... millimeter
MOB ... Methane-oxidizing bacteria MP... Maximum parsimony n ... Sample size
N... Nitrogen n.s. ... Non-significant N2... Nitrogen
NCBI... National Center for Biotechnology Information NJ... Neighbor joining
nmol ... Nanomole nt ... Nucleotide OD... Optical density
OTU... Operational taxonomic unit P (sample)... Poplar soil
PC ... Principal component
PCA... Principal component analysis PCR... Polymerase chain reaction
PERMANOVA……..Permutational multivariate analysis of variance
Pfam... Protein families annotations and multiple sequence alignments pH... Potential of hydrogen
pmol ... picomole
ppmv ... part per million by volume QC... Quality control
qPCR... Quantitative polymerase chain reaction
qRT-PCR... Quantitative reverse transcription polymerase chain reaction R2... Coefficient of determination
RDA... Redundancy Analysis RNA... Ribonucleic acid
rRNA ... Ribosomal ribonucleic acid
SCCM... Standard cubic centimeter per minute SEM ... Structural equation model
SH ... Soluble hydrogenase SIMPROF.... Similarity profile tool
SOIL ... Abiotic parameters composite ssDNA ... Single-stranded DNA
TCD... Thermal conductivity detector Tg ... Teragram
T-RFLP... Terminal restriction fragment length polymorphism UPGMA ... Unweighted pair group method with arithmetic mean URL ... Uniform Resource Locator
whc... Water holding capacity y ... Year
α ... Significance level β (variable) .. Soft-thresholding power
1
MOLECULAR HYDROGEN, A NEGLECTED KEY DRIVER OF SOIL
BIOGEOCHEMICAL PROCESSES
Titre français : L’hydrogène moléculaire en tant que moteur négligé des cycles biogéochimiques du sol
Article accepté dans le journal Applied and Environmental Microbiology le 13 janvier 2019
Auteurs : Sarah Piché-Choquette1✉et Philippe Constant1
1INRS-Institut Armand-Frappier, 531 boulevard des Prairies, Laval (Québec), Canada, H7V 1B7
✉Auteur correspondant
Contribution des auteurs
Sarah Piché-Choquette: Écriture de l’article Philippe Constant: Écriture de l’article
1.1
Résumé en français
Des études ont émis l’hypothèse que l’atmosphère de la Terre primitive était riche en gaz réducteurs comme l’hydrogène (H2). Puisque ce gaz est ubiquitaire dans la biosphère, qu’il peut aisément diffuser à travers les cellules microbiennes et qu’il nécessite une faible énergie d’activation, on suppose que l’H2pourrait être le premier donneur d’électron ayant donné naissance à la synthèse d’ATP. Même aujourd’hui, les enzymes hydrogénases permettant la production et l’oxydation d’H2sont retrouvés dans des milliers de génomes originaires des trois domaines du vivant et ce, en provenance d’écosystèmes aquatiques, terrestres ou même associés à un hôte. Bien que l’H2ait déjà été proposé à titre de source d’énergie universelle pour la croissance et la maintenance, sa contribution en tant que moteur de processus biogéochimiques a reçu peu d’attention. Nous tenons ainsi à remédier à cette lacune en résumant la littérature actuelle sur la classification, la distribution et le rôle physiologique des hydrogénases. La répartition de ces enzymes parmi de nombreux groupes fonctionnels microbiens ainsi que des résultats récents sont par la suite apportés de manière à supporter l’hypothèse que les microorganismes oxydant l’H2 sont des espèces-clés accentuant le recyclage du carbone le long de gradients de concentration d’O2 dans les sols riches en H2. En conclusion, nous suggérons de se concentrer sur la flexibilité métabolique des microorganismes oxydant l’H2 en employant des approches tant au niveau de l’individu que de la communauté microbienne afin de déterminer l’impact de l’H2sur le recyclage du carbone ainsi que le potentiel de recyclage du carbone des microorganismes oxydant l’H2 et ce, via des techniques dépendantes et indépendantes de la culture en laboratoire afin mieux nous éclairersur le rôle de l’H2en tant que moteur des processus biogéochimiques.
1.2
Abstract
The atmosphere of the early Earth is hypothesized to have been rich in reducing gases such as hydrogen (H2). H2has been proposed as the first electron donor leading to ATP synthesis due to its ubiquity throughout the biosphere as well as its ability to easily diffuse through microbial cells and its low activation energy requirement. Even today, hydrogenase enzymes enabling the production and oxidation of H2 are found in
thousands of genomes spanning the three domains of life across aquatic, terrestrial and even host-associated ecosystems. Even though H2 has already been proposed as a universal growth and maintenance energy source, its potential contribution as a driver of biogeochemical cycles has received little attention. Here, we bridge this knowledge gap by providing an overview of the classification, distribution and physiological role of hydrogenases. Distribution of these enzymes in various microbial functional groups and recent experimental evidences are finally integrated to support the hypothesis that H2 -oxidizing microbes are keystone species driving C cycling along O2 concentration gradients found in H2-rich soil ecosystems. In conclusion, we suggest focusing on the metabolic flexibility of H2-oxidizing microbes by combining community-level and individual-level approaches aiming to decipher the impact of H2on C cycling and the C-cycling potential of H2-oxidizing microbes, via both dependent and culture-independent methods to give us more insight into the role of H2 as a driver of biogeochemical processes.
1.3
Introduction
Several prebiotic chemistry models have hypothesized that the primary atmosphere of the early Earth was rich in reducing gases such as molecular hydrogen (H2), carbon monoxide (CO) and methane (CH4) (Oparin, 1938; Tian et al., 2005; Trainer, 2013; Zahnle
et al., 2010). The ubiquitous availability of H2, its low activation energy requirements and its ability to diffuse through microbial cells led to the hypothesis that H2 was the first electron donor as a mean to generate an ion gradient and consequently, ATP synthesis (Lane et al., 2010; Morita, 1999). In this regard, the iron-sulfur world hypothesis stipulates that NiFe/FeS active centers similar to the active site of hydrogenase enzymes— catalyzing the interconversion of H2 into protons and electrons—could have emerged billion years ago and have led to the first biotic sources and sinks of H2(Wächtershäuser, 2010). The availability of elevated mixing ratios of H2 in many ecological niches might represent a type of selection pressure maintaining this ancientmetabolism within today’s microbes, including environmental isolates (e.g. newly-cultivated Verrucomicrobia)
carcinogenesis) (Wang et al., 2016). Indeed, hydrogenases are well represented within the tree of life, as they are found in thousands of genomes from over 30 phyla ((Greening
et al., 2016; Vignais & Billoud, 2007), Fig. 1.1, 1.2 and 1.3). They support autotrophic and
mixotrophic lifestyles in various ecosystems encompassing soil, aquatic and animal-associated niches (Morita, 1999).
In soils, microbial growth is often limited by the scarcity of carbon sources and nutrients (Morita, 1999), which translates to bursts of growth in-between intervals of starvation-survival. On the other hand, H2is ubiquitous, requires a low activation energy and can easily permeate microbial cells (Morita, 1999). The ubiquity of H2is notably due to its high penetrating power through materials and its continuous abiogenic production in Earth’s upper mantle and biogenic production by fermentation, N2fixation and photoproduction (Morita, 1999). H2 oxidation can be combined with the reduction of a wide variety of oxidants, and therefore it can be performed in most ecosystems. This combination provides a quick energy fix, via H2, to overcome those short-to-long intervals of starvation-survival. Several studies have calculated this minimal energy requirement from thermodynamic and bioenergetic perspectives (Alperin & Hoehler, 2009; Hoehler et al., 2001; Hoehler & Jørgensen, 2013).
When environmental conditions are not suitable for growth, H2 oxidation could provide energy to undergo anabiosis, i.e. long-term stationary phase or even dormancy (Keilin, 1959; Morita, 1999). Such lifestyle might combine starvation-survival with another survival mechanism such as anahydrobiosis (i.e. desiccation) or cryobiosis (i.e. freezing) (Finkel, 2006), not unlike microbes trapped in amber or frozen in permafrost. Metabolically inactive lifestyles drastically reduce energy demands, yet microbial cells still need to prevent amino acids racemization (i.e. spontaneous change of isomeric form) and DNA depurination over extended periods of time by constantly repairing cellular damage or re-synthesising DNA (Alperin & Hoehler, 2009; Hoehler & Jørgensen, 2013; Onstott et al., 1998; Poinar et al., 1996), requiring a continuous input of energy. When organic matter
and H2 abound, H2-oxidizing microbes (HOM) can switch from short- or long-term dormancy to a more metabolically-active lifestyle (Morita, 1999).
While recent studies have shown the ubiquity and importance of H2 in natural and engineered ecosystems, this field of study has been fairly overlooked since few research groups have focussed on biotic H2 dynamics at the ecosystem level (Meredith et al., 2017). The aim of this review is to examine and discuss the potential role of H2 as an energy source maintaining microbial viability and activity, and in turn sustaining soil biogeochemical processes. Firstly, a brief overview of hydrogenases enzymes is provided, including their classification and physiological roles, with emphasis on their kinetic properties and O2 tolerance. The following section describes functional groups producing and oxidizing H2 across oxic and anoxic soil habitats. The last section integrates the biochemical properties of hydrogenases to propose succession patterns of HOM along theoretical gradients of O2and H2prevailing in soils as well as their potential implications in the carbon cycle. This review concludes with research perspectives aiming to evaluate the contribution of HOM in soil biogeochemical processes.
1.4
Hydrogenases classification: an overview
Hydrogenases are metalloenzymes catalyzing the interconversion of H2 to protons and electrons according to the following reaction: H2 ⇌ 2H+ + 2e- (Constant & Hallenbeck, 2013). These enzymes are used either to provide energy, to reduce cofactors or to disperse reducing equivalents generated through anaerobic processes (Vignais & Billoud, 2007). The conformation of electron bridges between structural subunits as well as the localization of the protein, membrane-bound or soluble, determines their physiological role (Constant & Hallenbeck, 2013). Their classification into [Fe]-hydrogenases, [FeFe]-hydrogenases and [NiFe]-[FeFe]-hydrogenases is based on differences between their active sites and amino acid sequences (Armstrong & Albracht, 2005). These classes probably originated from converging rather than sequential evolution, since their tertiary structure, catalytic activity and taxonomic distribution are clearly distinct (Vignais, 2008; Vignais et
structure (Calteau et al., 2005; Hansen & Perner, 2016; Keeling, 2009; Ludwig et al., 2006). Consequently, several microbes, such as Cupriavidus necator (phylum
Proteobacteria) and Mycobacterium smegmatis (phylum Actinobacteria), have the
genomic capability to express multiple hydrogenases with distinct physiological roles, resulting in an increased metabolic flexibility (Berney et al., 2014; Burgdorf et al., 2005a).
1.4.1 [Fe]-hydrogenases
[Fe]-hydrogenases are homodimers consisting of two 38 kDa subunits with a single Fe atom in their catalytic center (Constant & Hallenbeck, 2013). In contrast with [FeFe]- and [NiFe]-hydrogenases, [Fe]-hydrogenases do not contain Fe-S clusters, are restricted to hydrogenotrophic methanogenic archaea within the Euryarchaeota phylum ((Zirngibl et
al., 1992), Fig. 1.1 and 9.1) and are not inactivated by O2(Fontecilla-Camps et al., 2007; Lyon et al., 2004). In nickel-limiting conditions, [Fe]-hydrogenases work along with F420 -dependent methylene-H4MPT dehydrogenases to redirect electrons originating from H2 oxidation towards H2- and CO2-dependent methanogenesis (Thauer et al., 1996).
Figure 1.1 Consensus tree of 25 [Fe]-hydrogenases sequences, with an alignment length of 389 amino acids.Protein sequences were imported from a study by Greening et al. (2016), which included non-redundant putative hydrogenase catalytic subunits from cultured and environmental metagenomes sourced from NCBI Refseq and JGI MDM (Joint Genome Institute, Microbial Dark Matter) databases. More details are found in the article by Greening et al. (2016). See Fig. 9.1 for complete taxa names and a more detailed phylogenetic tree. Hydrogenases amino acids sequences were aligned with MUSCLE (Edgar, 2004) and clustered into phylogenetic trees using the following algorithms: Maximum likelihood (Jones-Taylor-Thornton substitution model) using RAxML version 8.2.10 (Stamatakis, 2014); Maximum parsimony using PAUP 4.0 (Swofford, 2003); and Neighbor-joining (Jones-Taylor-Thornton substitution model) using BIONJ (Gascuel, 1997). CIPRES Science Gateway v3.3 (Miller et al., 2011) servers were used for phylogenetic trees construction. Tree branches supported by over 50% of the 1000 bootstrap replications were represented in the final consensus tree. The consensus tree was built using the “ape” package (Paradis et al., 2004) in R (R Development Core Team, 2017). Branch colors represent taxonomic classification at the class level, since all 25 sequences are part of the Euryarchaeota
1.4.2 [FeFe]-hydrogenases
[FeFe]-hydrogenases are mono-, di-, tri- or tetrameric enzymes containing an active center with two Fe atoms, called H-cluster, as well as Fe-S clusters (Vignais & Colbeau, 2004). They are strictly anaerobic since their active site is denatured by O2 exposure (Constant & Hallenbeck, 2013). [FeFe]-hydrogenases almost exclusively produce H2 (Burgdorf et al., 2005a; Thauer, 2011), with a few exceptions, such as in Desulfovibrio
vulgaris (phylum Proteobacteria), whose [FeFe]-hydrogenase can oxidize H2 in nickel-limited conditions to circumvent [NiFe]-hydrogenase synthesis (Pohorelic et al., 2002). [FeFe]-hydrogenases are mostly found in anaerobic Firmicutes and sulfate reducers (Fig. 1.2 and 9.2) due to their O2-sensitivity (Adams, 1990; Atta & Meyer, 2000; Vignais et al., 2001). They consist of the only class of hydrogenases found in eukaryotes, namely in unicellular green algae Chlamydomonas reinhardtii (phylum Chlorophyta) (Happe et al., 1994), where they are located within membrane-limited organelles like chloroplasts and hydrogenosomes (Akhmanova et al., 1998).
Figure 1.2 Consensus tree of 1217 [FeFe]-hydrogenases sequences, with an alignment length of 3525 amino acids, computed as described in Fig. 1.1.See Fig. 9.2 for complete taxa names and a more detailed phylogenetic tree. Branches colors represent taxonomic classification at the phylum level while pie charts show the relative abundance of each phylum within hydrogenases’ subgroups. Dashed brackets show which tree branches belong to a specific hydrogenases group. Numbers between parentheses depict the amount of sequences within that group.
1.4.3 [NiFe]-hydrogenases
[NiFe]-hydrogenases are the most widespread hydrogenases class (Vignais & Billoud, 2007). Several structural and accessory genes are necessary for their maturation
at the very least a core heterodimeric component comprising a large α-subunit (ca. 60 kDa) and a small β-subunit (ca. 30 kDa) (Constant & Hallenbeck, 2013). [NiFe]-hydrogenases represent a heterogenous group of [NiFe]-hydrogenases divided into 5 subgroups according to their phylogeny (Fig. 1.3 and 9.3) and physiology (Constant & Hallenbeck, 2013). Among these physiological traits, O2 tolerance and low catalytic affinity are the most common (Constant & Hallenbeck, 2013). Indeed, only a few subgroups are sensitive to O2and a single subgroup has a high-affinity towards H2, i.e. can oxidize atmospheric H2 (0.53 ppmv (Novelli et al., 1999)). This classification scheme supported by concurrence between gene sequences and physiological roles of hydrogenases has been revisited recently using structural gene sequences similarity networks, suggesting a higher number of putative sub-classes within each group (Greening et al., 2016; Søndergaard et al., 2016). Such reclassifications will not be covered here owing to the lack of experimental observations supporting their coherence with genetic, biochemical and physiological features of hydrogenases.
Figure 1.3 Consensus tree of 1988 [NiFe]-hydrogenases sequences, with an alignment length of 1850 amino acids, computed as described in Fig. 1.1.See Fig. 9.3 for complete taxa names and a more detailed phylogenetic tree. Branches colors represent taxonomic classification at the phylum level while pie charts show the relative abundance of each phylum within hydrogenases’ subgroups. Dashed brackets show which tree branches belong to a specific hydrogenases group. Numbers between parentheses depict the amount of sequences within that group.
Group 1 [NiFe]-hydrogenases
Group 1 [NiFe]-hydrogenases (membrane-bound hydrogenases or MBH) are H2-uptake hydrogenases attached to the cytoplasmic membrane (periplasmic side) (Constant & Hallenbeck, 2013). They are intimately linked to the electron transport chain by supplying
subsequent generation of ATP (Pandelia et al., 2012). MBH are used for energy generation by coupling the oxidation of H2with the reduction of several electron acceptors such as CO2, SO4-2, NO3-, Fe(III) oxides or O2 (Pandelia et al., 2012). They are mostly found in Proteobacteria and Firmicutes (62.5% and 17.3%) (Fig. 1.3 and 9.3). Ancestral MBH found in methanogenic archaea and sulfate-reducing bacteria are O2-sensitive (Pandelia et al., 2012). Contrastingly, those associated with Isp complex, in obligate and facultative autotrophs, and with HybA-MBH, in Gammaproteobacteria, have a low tolerance towards O2 (Pandelia et al., 2012). O2-tolerant MBH are used to perform the Knallgas reaction, i.e. oxidation of H2 using O2 as terminal electron acceptor, or other reactions involving high-potential electron acceptors such as nitrogen oxides or bacteriochlorophylls (Pandelia et al., 2012).
Group 2 [NiFe]-hydrogenases
Group 2 [NiFe]-hydrogenases consist of cytoplasmic enzymes divided into 2 distinct functional groups; 2a and 2b (Constant & Hallenbeck, 2013). [NiFe]-hydrogenases encompassing Group 2a are soluble uptake hydrogenases oxidizing H2 endogenously produced by N2fixation (Tamagnini et al., 2007) or NADH/NADPH oxidation (Berney et
al., 2014) and are mainly found in Cyanobacteria and other N2-fixing bacteria ((Bothe et
al., 2010; Tamagnini et al., 2007), Fig. 1.3 and 9.3). Their role is to channel electrons to
the electron transport chain and supply energy to the cell (Vignais & Colbeau, 2004). They are often located inside cyanobacterial heterocysts devoid of oxygenic photosynthesis and are upregulated under anoxic conditions due to their O2 sensitivity (Axelsson & Lindblad, 2002). Contrastingly, Group 2b [NiFe]-hydrogenases are H2-sensing regulatory hydrogenases (RH) acting as two-component signal transduction systems (Constant & Hallenbeck, 2013). The specific shape and size of the hydrophobic gas channel leading exogenously-produced H2to the active site confers O2-tolerance to the enzyme (Buhrke
et al., 2005). When H2is present, RH induce the transcription of Group 1 and Group 3 uptake hydrogenases operons in Knallgas bacteria (Buhrke et al., 2004; Lenz et al., 2002).
Group 3 [NiFe]-hydrogenases
Group 3 [NiFe]-hydrogenases are cytoplasmic enzymes called bidirectional heteromultimeric [NiFe]-hydrogenases or soluble hydrogenases (SH) (Constant & Hallenbeck, 2013). Their role is to provide redox balance within the cell in both bacteria and archaea (Vignais & Billoud, 2007). The structural subunits of those enzymes are in close association with protein modules binding soluble cofactors (Constant & Hallenbeck, 2013). Group 3 [NiFe]-hydrogenases are O2-tolerant due to two extra cyanide ligands bound to the Ni and Fe atoms of their active site (Burgdorf et al., 2005b). These hydrogenases mainly found in Proteobacteria (37.4%) and Euryarchaeota (27.4%) (Fig. 1.3 and 9.3) are further divided into 4 subgroups (Constant & Hallenbeck, 2013). Group 3a [NiFe]-hydrogenases are heterotrimeric enzymes initially found in methanogenic archaea (Peters et al., 2015), but more recently in some bacterial phyla (Ney et al., 2016), and are used to reduce the F420 cofactor. Group 3b [NiFe]-hydrogenases are tetrameric enzymes acting like bifunctional sulfhydrogenases (Constant & Hallenbeck, 2013). They were initially found in hyperthermophilic archaea yet have also been detected in bacterial phyla more recently (Greening et al., 2016). They reduce S0to H
2S or oxidize NAD(P)H and produce H2 to disperse reducing equivalents generated through fermentation, or alternatively to produce NADPH by using H2 (Ma et al., 1993). Group 3c [NiFe]-hydrogenases are heterodisulfide reductase-associated [NiFe]-hydrogenases that catalyze the reduction of compounds such as methyl viologen and CoS-S-CoB (Coenzyme M-disulfide bond-Coenzyme B) (Thauer et al., 2010) and are mostly found in methanogens and sulfate reducers. Group 3d [NiFe]-hydrogenases consist of a heteromeric hydrogenase and a NADH-dehydrogenase module that binds to NAD(P)H (Constant & Hallenbeck, 2013). The amount of hydrogenase subunits varies greatly, consisting, for example, of a heterodimeric enzyme in C. necator (Lauterbach et al., 2011) or a heteropentameric enzyme in Cyanobacteria (Puggioni et al., 2016). These hydrogenases are used to balance the NAD+/NADH pool by reducing NAD+ using H
2 (Constant & Hallenbeck, 2013).
Group 4 [NiFe]-hydrogenases or membrane-associated energy-converting hydrogenase are oxygen-sensitive (Bonam et al., 1989), multimeric enzymes comprising two proteins embedded within the cytoplasmic membrane as well as hydrophilic subunits (Constant & Hallenbeck, 2013). Group 4 [NiFe]-hydrogenases are mostly found in methanogenic archaea, chemolithoautotrophic bacteria and in hyperthermophilic archaea (Fig. 1.3 and 9.3). In facultative chemolithoautotrophs, Group 4 hydrogenases disperse reducing equivalents generated through fermentation by coupling the reduction of protons from water with the anaerobic oxidation of C1 compounds like formate or carbon monoxide (Schut et al., 2012). In acetoclastic methanogens, energy-converting hydrogenases (Ech) perform the H2-dependent reduction of ferredoxin, leading to the generation of a proton gradient through the cytoplasmic membrane and the generation of ATP (Welte et al., 2010). In methanogens without a cytochrome, Group 4 [NiFe]-hydrogenases (Eha and Ehb) reduce ferredoxin and catalyze H2 oxidation, which is then coupled with the generation of a sodium ion motive force (Constant & Hallenbeck, 2013). Group 4 [NiFe]-hydrogenases also include energy-converting Mbh-type hyperthermophilic enzymes producing H2in order to re-establish oxidized ferredoxin levels (Schut et al., 2013).
Group 5 [NiFe]-hydrogenases
Group 5 [NiFe]-hydrogenases are O2-tolerant (Schäfer et al., 2013) uptake hydrogenases harboring a high affinity towards H2 enabling them to oxidize atmospheric H2(Constant
et al., 2010). Their activity was first discovered in spores of Streptomyces spp. (phylum Actinobacteria) (Constant et al., 2008). These enzymes are likely associated to the
cytosolic side of the membrane through an electron acceptor, but conflicting results have been reported (Greening et al., 2014a; Schäfer et al., 2013). Genomic database mining demonstrated that Group 5 [NiFe]-hydrogenases are mostly found in Actinobacteria (84.0%, Fig. 1.3 and 9.3) (Constant et al., 2011b; Greening et al., 2016). The proposed role of these hydrogenases is to provide a growth advantage (Greening et al., 2014b) or a supplementary energy source within a survival-mixotrophic lifestyle (Liot & Constant, 2016) to sustain microbial seedbanks in oligotrophic environments (Constant et al., 2011b). However, C. necator has a weakly expressed Group 5 [NiFe]-hydrogenase that
cannot oxidize atmospheric H2 (Schäfer et al., 2013). Indeed, biochemical properties conferring high affinity for H2 are unknown. While there is a high sequence similarity between the active site of Group 5 [NiFe]-hydrogenases, such hydrogenases display a wide spectrum of affinities, e.g. Kmover 1,000 ppmv in C. necator in contrast to 11 ppmv in Streptomyces sp. PCB7 (Constant et al., 2008). This suggests that either a lateral gene transfer in C. necator (Schwartz et al., 2003) or the evolution of unknown biochemical attributes in hydrogenases were found in high-affinity HOM. Alternatively, other factors, such as the currently unknown physiological electron acceptor of Group 5 [NiFe]-hydrogenases (Greening et al., 2014a; Schäfer et al., 2016), could be responsible for their affinity towards H2. Their affinity has not been tested extensively in vitro, thus we cannot assume that C. necator is an exception to the rule. Also, diverging phylogenetic analyses spawned confusion in hydrogenases terminology, yet Group 5 (Constant et al., 2011b; Piché-Choquette et al., 2017; Schäfer et al., 2013) and Group 1h (Greening et al., 2016) refer to the same enzymes.
1.5
Overview of the H
2biogeochemical cycle
Biological sources and sinks of H2are common in oxic and anoxic ecosystems. In anoxic ecosystems—such as wetlands, freshwaters under the chemocline, marine sediments and animal gastrointestinal tracts—H2 is mainly produced as a reaction intermediate of organic matter degradation by organisms from the three domains of life. The main biological sinks of H2 in anoxic ecosystems are acetogens, methanogens, sulfate-reducing microbes, iron oxide-sulfate-reducing microbes and nitrate-sulfate-reducing microbes (Thauer, 2011). In oxic environments—such as upland soils, freshwaters above the chemocline and open oceans—H2 is mainly generated by N2 fixation and is consumed by Knallgas bacteria and high-affinity H2-oxidizing bacteria (Thauer, 2011). Due to its energetic potential, H2 is quickly consumed by microbes within the same microenvironment, indicating that H2 production is likely the limiting step of the H2 biogeochemical cycle (Thauer et al., 1996). Microbial functional groups responsible for H2 production and utilization in anoxic and oxic ecosystems will be presented in the following subsections to
1.5.1 H2production in anoxic ecosystems
In anoxic ecosystems, production (or biophotolysis), dark fermentation and photo-fermentation are responsible for most of the H2production (Thauer, 2011).
Photo-production
Photo-production of H2 in aquatic sediments is performed by unicellular algae such as
Chlorella fusca (phylum Chlorophyta), Tetradesmus obliquus (phylum Chlorophyta)
(Gaffron & Rubin, 1942) (formerly Scenedesmus obliquus) and Chlamydomonas
reinhardtii (Yagi et al., 2016), as well as Cyanobacteria. In soils, several purple non-sulfur
bacteria perform photo-production, including Rhodobacter capsulatus (phylum
Proteobacteria) (Tsygankov et al., 1998) and Rhodopseudomonas rutila (phylum Proteobacteria) (Oh et al., 2004). This process occurs under oxygen and CO2limitation (Benemann, 2000; Ghirardi et al., 2000). Light-excited electrons are transferred across photosystems to reduce ferredoxin, then ferredoxin is re-oxidized in order to produce H2 via an [FeFe]-hydrogenase (Bourke et al., 2017). This process maintains the electron flow within the electron transport chain to resume oxygenic photosynthesis as soon as better conditions arise (Benemann, 2000), such as changing tides or the next photoperiod.
Photo-fermentation and dark fermentation
Unicellular algae such as Fragilariopsis sp. (phylum Bacillariophyta) and Pyramimonas sp. (phylum Chlorophyta) (Bourke et al., 2017), strict anaerobes like Clostridium
acetobutylicum (phylum Firmicutes) (Zhang et al., 2006) and even facultative anaerobes
like Escherichia coli, phylum Proteobacteria) (Redwood et al., 2008) from both aquatic and terrestrial environments can produce H2 through dark fermentation. Glycolysis followed by the decarboxylation of pyruvate into acetyl-CoA reduces ferredoxin/NAD+into oxidized ferredoxin/NADH, supplying electrons to a hydrogenase and generating H2 by their re-oxidation (Bourke et al., 2017; Calusinska et al., 2010; Schut & Adams, 2009). Alternatively, the conversion of CoA and pyruvate into formate and acetyl-CoA followed by the cleavage of formate also leads to the generation of H2 and CO2 (Khanna & Das,
2013). Oxidized ferredoxin/NADH are regenerated by discarding reducing equivalents and glycolysis can generate ATP anew. Photo-fermentation is performed by purple non-sulphur bacteria—e.g. Rhodospirillum rubrum (phylum Proteobacteria) or Rhodobacter
sphaeroides—that use light energy to convert organic substrates like lactic acid into H2 and CO2(Khanna & Das, 2013). These processes can be performed sequentially, given that there are dark and light cycles. According to genomic surveys and culture-dependent measurements, in aquatic environments, H2-evolving fermenters include unicellular algae, Firmicutes, Bacteroidetes, Spirochetes and Proteobacteria (Bourke et al., 2017; Boyd et al., 2014; Dong et al., 2018; Mei et al., 2016). In anoxic soils, such as paddy fields, molecular surveys targeting [FeFe]-hydrogenases have shown that Firmicutes (mostly Clostridia), Proteobacteria (mostly Deltaproteobacteria) and Chloroflexi are the most abundant H2 producers (Baba et al., 2016; Baba et al., 2014). Similarly, in a moderately acidic fen slurry enrichment, fermenters were identified as Firmicutes (Clostridia and Negativicutes) and Deltaproteobacteria (Schmidt et al., 2010).
Nitrogen fixation
Various microbes such as Clostridium spp., Bacillus spp. (phylum Firmicutes) as well as methanogenic archaea and Cyanobacteria can fix N2 and consequently produce H2 in anoxic or microoxic environments (Leigh, 2000; Orr et al., 2011). Since current estimates suggest that most of the biological nitrogen fixation is performed in oxic ecosystems (Fowler et al., 2013), especially in surface waters (Jayakumar et al., 2017; Voss et al., 2013) and in the rhizosphere of leguminous and actinorhizal plants (Vitousek et al., 2013), it will be discussed in the next section.
1.5.2 H2production in oxic ecosystems
Nitrogen fixation
The main biological process responsible for H2production in oxic ecosystems is biological N2 fixation (BNF). BNF is performed by the nitrogenase complex according to the following reaction:
N2+ 8H++ 8e- → 2NH3+ H2 (Burris, 1991; Hunt et al., 1988; Postgate, 1982) (1) BNF requires a tremendous amount of energy, i.e. a minimum of 16 ATP per fixed N2 molecule (2 ATP per electron transferred (Burris, 1991)), thus it is strictly regulated and used only in the absence of bioavailable N (Mylona et al., 1995). Since nitrogenases are irreversibly inactivated by O2 (Berman-Frank et al., 2001; Burris, 1991), microbes can avoid O2 via temporal or spatial separation strategies: separation of N2 fixation and oxygenic photosynthesis (Berman-Frank et al., 2001); avoidance of O2; high respiration rates and the use of O2 transporters to buffer local O2 concentrations (Brewin, 1991; Burris, 1991; Poole & Hill, 1997; Stal & Krumbein, 1987). H2is an obligate by-product of the BNF reaction, requiring approximately 35% of the electron flux used towards BNF (Hunt & Layzell, 1993) and leading to local accumulations in environments such as legumes rhizosphere (Witty, 1991; Witty & Minchin, 1998). BNF and hydrogen oxidation are often linked due to their complementary outcomes, since H2oxidation coupled to O2 reduction recovers part of the ATP used towards N2 fixation and leads to a reduction of O2pressure and H2buildups, both of which would prevent nitrogen fixation (Bothe et al., 2010; Dixon, 1972). Furthermore, three BNF strategies are used by microbes, including symbiotic N2fixation (Mus et al., 2016; Mylona et al., 1995), plant-associated N2fixation (Steenhoudt & Vanderleyden, 2000) and free-living N2fixation (Postgate, 1982; Tschapek & Giambiagi, 1955). Unlike other nitrogen fixers, most leguminous plants symbionts do not possess the genetic capability to recycle H2 produced through nitrogen fixation (i.e.
Hup- genotype) (Uratsu et al., 1982). Studies have hypothesized that the additional energy input provided by H2exerts a fertilization effect promoting growth of the host plant (Dong et al., 2003; Maimaiti et al., 2007).
1.5.3 H2uptake in anoxic ecosystems
In anoxic ecosystems, numerous microbial functional groups use H2as an electron donor to reduce terminal electron acceptors according to their availability and underlying thermodynamic constraints (Thauer et al., 1996). This section discusses some of them in increasing redox potential order, from acetogenesis to denitrification, although other electron acceptors can be coupled to H2 oxidation, such as MnO2 and CrO4. Many of those microbes are facultative anaerobes, yet these processes are only performed in
anoxic ecosystems since the reduction of O2would be favored thermodynamically over alternative electron acceptors. These functional groups are not mutually exclusive, i.e. numerous bacteria and archaea are able to perform H2oxidation using more than one electron acceptor.
Acetogens
Acetogenesis is performed by several strict anaerobes from the bacterial and archaeal domains of life (He et al., 2016). Acetogens are found in a wide variety of ecosystems: wetlands (Rosencrantz et al., 1999), the gastrointestinal tract of animals (Breznak, 1994; Rey et al., 2010), oceans, subsurface sediments (Liu & Suflita, 1993), hypersaline waters (Ollivier et al., 1994) and oxic soils (Peters & Conrad, 1995). While the latter sounds counterintuitive, several acetogens and methanogens can survive in presence of O2due to different mechanisms (Karnholz et al., 2002; Küsel et al., 2001). Most acetogens, namely Clostridium spp., are comprised within the Firmicutes (Ragsdale & Pierce, 2008), yet some are also found among other phyla, including archaeal phylum Bathyarchaeota (He et al., 2016). The acetogenesis reaction follows the Wood-Ljungdahl pathway to convert C1 inorganic compounds (CO2) into C2 organic compounds (acetate):
2 CO2+ 4H2⇌ CH3COO−+ H++ 2 H2O (2) (Fischer et al., 1932)
Acetogens scavenge H2generated through the degradation of organic matter. They face fierce competition from methanogens; the latter having a lower threshold for H2utilization and a higher energy yield (Le Van et al., 1998; Schink, 1997). Acetogens can overcome methanogens in some ecosystems—such as in termites gut (Pester & Brune, 2007)— since the production of acetate consists of an ecological advantage in its animal host. Acetogens are inherently involved in H2 and C cycling processes by coupling the utilization of CO2and H2. In turn, this leads to the generation of acetate, a bioavailable C source for the surrounding microbial community. As strict or facultative anaerobes, acetogens can also use dissolved organic matter (DOM, also known as labile) through fermentation and produce their own H2 and CO2. Additionally, some of them; e.g.
degradation, polymeric organic matter (POM, also known as recalcitrant) turnover (Koeck
et al., 2014) and humic acids decomposition (Ueno et al., 2016).
Methanogens
Methanogenesis is only performed by methanogenic archaea; which are common in wetlands, in the intestinal tract of animals, in extreme environments such as hot springs and hydrothermal vents (Conrad, 2009) and even in oxic soils (Peters & Conrad, 1995). Methanogens consist of the only functional group harbouring [Fe]-hydrogenases, which enables them to use H2 as a reducing agent for the ferredoxin-dependent reduction of CO2to CH4, according to the simplified reaction:
CO2+ 4 H2→ CH4+ 2H2O (3) (Stephenson & Stickland, 1933; Thauer, 1998)
Methanogens thrive in ecosystems or layers within those ecosystems where electron acceptors with higher redox potential—such as sulfate and nitrate—are depleted due to the low redox potential of CO2(Thauer et al., 1996). They scavenge CO2and H2derived from the degradation of organic matter, of which they can ferment on their own. Hydrogenotrophic methanogens using electron bifurcation are considered obligate autotrophs (Jablonski et al., 2015); Methylotrophic methanogens using oxidative phosphorylation consume a wider variety of substrates (Singh et al., 2005). Recent studies, however, have shown that hydrogenotrophic methanogens—such as the marine methanogen Methanococcus maripaludis (phylum Euryarchaeota) (Costa et al., 2013)— might in fact have a greater flexibility than initially thought by using a combination of CO and formate rather than only CO2 and H2. The assumption that methanogens are strict anaerobes has also been challenged with the discovery of “Candidatus” Methanothrix paradoxum (phylum Euryarchaeota) (non-hydrogenotrophic) (Angle et al., 2017). The involvement of methanogens in the C cycle also includes their ability to reduce humic acids, e.g. in Methanosarcina barkeri (phylum Euryarchaeota) (Bond & Lovley, 2002), which temporarily decreases their methanogenesis potential. Studies even suggest that anaerobic methanotrophic archaea (ANME) could be methanogens as well (Sebastian et
Sulfate-reducing bacteria and archaea
Sulfate-reducing bacteria (SRB)—such as Desulfovibrio spp. and Desulfotomaculum spp. (phylum Firmicutes)—as well as sulfate-reducing archaea (SRA)—such as
Archaeoglobus spp. (phylum Euryarchaeota)—are anaerobic microbes coupling the
oxidation of H2 (or organic compounds) to the reduction of sulfate (SO42-) into sulfide compounds (Muyzer & Stams, 2008; Thauer & Kunow, 1995).
While they are found in oxic environments such as coastal sediments (Jørgensen, 1977), sulfate-reducing microbes are more common in marine and freshwater sediments, deep subsurface environments and in the gastrointestinal tract of animals (Muyzer & Stams, 2008). They are also found in acid mine drainages and alkaline environments such as soda lakes (Muyzer & Stams, 2008). H2-utilizing sulfate reducers can outcompete acetogens and methanogens within the same ecosystem due to their higher growth kinetics (Muyzer & Stams, 2008). Species of Desulfitobacterium (phylum Firmicutes) are also able to perform the reduction of humic acids and polyaromatic compounds (Cervantes et al., 2002; Gorny & Schink, 1994). Studies have also shown their potential ability to fix CO2(Kim et al., 2012; Schauder et al., 1987) and oxidize CO (Parshina et al., 2010). Sulfate-reducing microbes are thought to be the main drivers of carbon cycling in marine sediments (Muyzer & Stams, 2008). H2-oxidizing SRB also act as syntrophs in consortia performing the anaerobic oxidation of CH4(Boetius et al., 2000).
Iron oxide reducers
Iron oxide-reducing bacteria and archaea (Fe(III) reducers) are found in soils, acid mine effluents (Das et al., 1992), aquatic sediments (Lonergan et al., 1996), hot springs (Kashefi et al., 2002) and subsurface ecosystems. Since Fe(III) is insoluble in water, microbes need a direct contact with Fe(III) to reduce it (Gorby et al., 2006). Microbes such as Shewanella spp. (phylum Proteobacteria), Geobacter spp. (phylum Proteobacteria)
![Figure 1.1 Consensus tree of 25 [Fe]-hydrogenases sequences, with an alignment length of 389 amino acids.Protein sequences were imported from a study by Greening et al.](https://thumb-eu.123doks.com/thumbv2/123doknet/5004684.124701/29.918.194.740.137.693/consensus-hydrogenases-sequences-alignment-protein-sequences-imported-greening.webp)
![Figure 1.3 Consensus tree of 1988 [NiFe]-hydrogenases sequences, with an alignment length of 1850 amino acids, computed as described in Fig](https://thumb-eu.123doks.com/thumbv2/123doknet/5004684.124701/33.918.139.782.143.716/figure-consensus-hydrogenases-sequences-alignment-length-computed-described.webp)