HAL Id: hal-00296846
https://hal.archives-ouvertes.fr/hal-00296846
Submitted on 6 Apr 2005
HAL is a multi-disciplinary open access
archive for the deposit and dissemination of
sci-entific research documents, whether they are
pub-lished or not. The documents may come from
teaching and research institutions in France or
abroad, or from public or private research centers.
L’archive ouverte pluridisciplinaire HAL, est
destinée au dépôt et à la diffusion de documents
scientifiques de niveau recherche, publiés ou non,
émanant des établissements d’enseignement et de
recherche français ou étrangers, des laboratoires
publics ou privés.
2-D spatial distribution of rainfall rate through
combined use of radar reflectivity and rain gauge data
F. Cuccoli, L. Facheris, D. Giuli, M. Casamaggi
To cite this version:
F. Cuccoli, L. Facheris, D. Giuli, M. Casamaggi. 2-D spatial distribution of rainfall rate through
combined use of radar reflectivity and rain gauge data. Advances in Geosciences, European Geosciences
Union, 2005, 2, pp.93-95. �hal-00296846�
Advances in Geosciences, 2, 93–95, 2005 SRef-ID: 1680-7359/adgeo/2005-2-93 European Geosciences Union
© 2005 Author(s). This work is licensed under a Creative Commons License.
Advances in
Geosciences
2-D spatial distribution of rainfall rate through combined use of
radar reflectivity and rain gauge data
F. Cuccoli, L. Facheris, D. Giuli, and M. Casamaggi
CNIT c/o Dept. of Electronics & Telecommunications, University of Firenze, Firenze, Italy
Received: 18 November 2004 – Revised: 9 February 2005 – Accepted: 16 February 2005 – Published: 6 April 2005
Abstract. This paper describes and comments the results
obtained applying a data processing method to a joint set of radar and a rain gauge data for estimating the 2-D rainfall field at ground averaged over a given observation time T and over a radar coverage area that includes a rain gauge network. The estimate of the rainfall field is based on the processing of a data set composed by rain gauge and horizontal reflectivity radar data gathered during a rainfall phenomenon. The pro-cedure has been tested on an experimental data set collected in Tuscany in 1999.
1 Introduction
It is recognised that rainfall rate estimate based on radar mea-surements is affected by an high degree of uncertainty due to several sources: space-time variability of drop size dis-tribution (from one rainfall event to another and within the same event), variations in space and time of reflectivity with height, radar signal attenuation due to propagation in the pre-cipitation rainfall, etc. (Anagnostou, 1999). Moreover, the way commonly used to assess the reliability of the rainfall radar estimates is to “compare” them with data provided by an ensemble of raingauges placed in the radar coverage area (Anagnostou, 1999; Aydin, 1990; Scarchilli, 1999). A novel raingauge-radar data processing method was proposed by the authors (Cuccoli et al., 2003) for the estimate of the spatial distribution of the rainfall rate RT (x, y) over an area covered
by a meteorological radar and a raingauge network during a given observation time T . Such method processes the (in-stantaneous) absolute reflectivity Z (H polarization, in the case of the system used here) as provided by the radar and the estimates of rainfall R as provided by raingauges, both collected during a given observation time T , in order to com-pute the rainfall rate RT (x, y) as:
log (RT(x, y)) = AT (x, y) + BT (x, y)log (ZT (x, y)) (1)
Correspondence to: F. Cuccoli ([email protected])
where ZT (x, y) is a space-time average function of the
in-stantaneous horizontal reflectivity maps (PPI scans) gathered during the observation time T , while AT (x, y) and BT (x,
y) are coefficients that are determined by means of ad hoc correlation functions between space-time “average” values of raingauge data and absolute reflectivity data. In this paper we discuss some results obtained applying the method to a radar and rain gauge data set acquired during a 1999 storm over Tuscany.
2 Description of the data processing procedure
Once defined the extension of the precipitation volume to be correlated to the raingauges, the procedure developed allows the estimation of the rainfall rate on a time interval basis T , in order to obtain a number of pairs Z-R through which the coefficients AT(xk, yk)and BT(xk,yk)are computed,
corre-sponding to any given raingauge location (xk,yk).
The method does not make use of a priori parameters and the relationship between reflectivity and rainfall rate is vari-able in both time and space. This kind of approach allows to account for the evolution of the precipitation phenomenon since the simultaneous and time-continuous use of raingauge and radar reflectivity time series allows to modify in real time the relationship between the rainfall rate and the radar obser-vation.
Here a synthesis of the data processing procedure is re-ported, which is described in better detail in (Cuccoli et al., 2003). First of all, a reference radar volume is pre-assigned for all the rain gauge positions. Such volume is defined as the number of adjacent radar cells above the ground rain gauge position. Then a set of time parameters, the process-ing time Twand the shift time Ts, is assigned together to the
observation time T . Tw and Ts allow the management of
a mobile processing window inside the observation time T . For the k-th raingauge, a number np of time averaged rain rate values RWp(k)(p=1. . . np) and a corresponding time
94 F. Cuccoli et al.: 2-D spatial distribution of rainfall rate
6
Fig. 1 - Example of Z-R regression computation: (left) linear regression, (center) least square,
(right ) effective variance method
Fig. 2 – Geographical disposition of the 22 raingauges with respect to the radar position.
Fig. 3 – Estimation error of the rainfall rate considering all the possible validation ensembles,
composed by 4 raingauges, and the calibration ensembles, composed by 18 raingauges. Black
line: time-spatial bilinear interpolation, gray line: spatial interpolation.
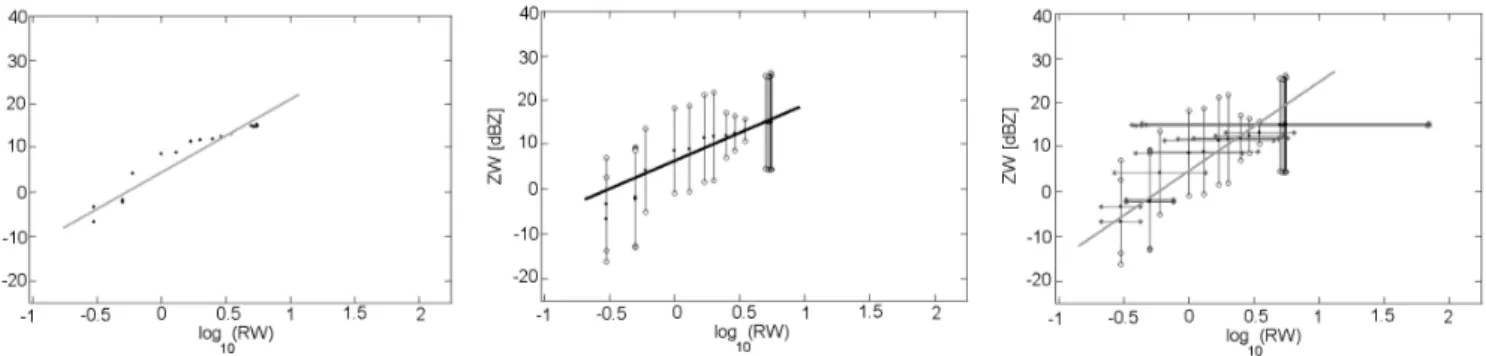
Fig. 1. Example of Z-R regression computation: (left) linear regression, (center) least square, (right ) effective variance method.
6
Fig. 1 - Example of Z-R regression computation: (left) linear regression, (center) least square,
(right ) effective variance method
Fig. 2 – Geographical disposition of the 22 raingauges with respect to the radar position.
Fig. 3 – Estimation error of the rainfall rate considering all the possible validation ensembles,
composed by 4 raingauges, and the calibration ensembles, composed by 18 raingauges. Black
line: time-spatial bilinear interpolation, gray line: spatial interpolation.
Fig. 2. Geographical disposition of the 22 raingauges with respect to the radar position.
number np of averaged reflectivity radar values ZWp(k) are
computed together with their space time uncertainty param-eters σZp(k). Therefore, for each rain gauge a number np of (ZWp(k), RWp(k)) pairs with their uncertainty parameters are
generated in the observation time T . The number np depends on T , Ts and Tw (i.e. the combination T =240, Tw=120 and
Ts=60 min gives np=4). The uncertainty parameters σRp(k)and
σZp(k)respectively account for non homogeneity and non sta-tionary of the precipitation phenomenon over the kth rain-gauge location.
To relate ZWp(k)and RWp(k) three approaches can be
fol-lowed. In the first, both are ideally supposed to be not af-fected by uncertainty for all the np pairs, namely they are considered equally reliable and no uncertainty indexes are needed, and therefore a standard linear regression method is sufficient. In the second approach, ZWp(k)and RWp(k)are
as-sumed without and with uncertainty, respectively, for all the np pairs; then the uncertainty index σZp(k) is used as a score
for the conditions of non homogeneity and non stationariety on the radar dataset. In this case, a standard least squares method is used.
In the last approach, both ZWp(k)and RWp(k)are assumed
with uncertainty for all the np pairs, and σRp(k) and σZp(k) are used in order to account for the conditions of non homogene-ity and non stationarhomogene-ity on the RWp(k)dataset and for the non
stationarity on the ZWp(k)dataset, respectively. In this case,
the effective variance method (Orear, 1982) is used. Figure 1 shows an example of Z-R regression computation consider-ing such approaches.
The result of the regression is a straight line for every rain-gauge location whose parameters, the slope and the intercept, are the coefficients AT and BT of the Eq. (1) for the location
(x, y) of the kthraingauge.
3 Performance analysis
The performance analysis of the proposed method has been made on the whole radar and raingauge data set related to the rainfall phenomenon occurred over Tuscany (Italy) on 21 October 1999 from 11:40:00 to 22:20:00 local time, observed by the dual polarization radar POLAR 55C sited in Montag-nana (Firenze, Tuscany). The sampling time is 15 and 10 min for the raingauges and the radar data, respectively. Figure 2 shows the spatial disposition of the 22 raingauges used in this paper assuming the radar located in (0, 0).
We considered several combinations of time parameters (1 to 20 h step 20 min for T , 10 min to 3 h step 10 min for Tw, 5
to 20 min step 5 min for Ts)and all the three regression
com-putation methods discussed in the previous section. For each combination, we selected 18 raingauges for the computation procedure and 4 raingauges for comparison. For each obser-vation time value, we selected the parameters Twand Ts that
give regression errors lower than 20% among all the possible combinations of time parameters.
In order to make the test statistically significant, all possi-ble combinations of computation and comparison raingauge ensembles, among the available 22 raingauges, were consid-ered. About 350 different combinations of comparison cases were obtained for each set of time parameters.
F. Cuccoli et al.: 2-D spatial distribution of rainfall rate 95
6
Fig. 1 - Example of Z-R regression computation: (left) linear regression, (center) least square,
(right ) effective variance method
Fig. 2 – Geographical disposition of the 22 raingauges with respect to the radar position.
Fig. 3 – Estimation error of the rainfall rate considering all the possible validation ensembles,
composed by 4 raingauges, and the calibration ensembles, composed by 18 raingauges. Black
line: time-spatial bilinear interpolation, gray line: spatial interpolation.
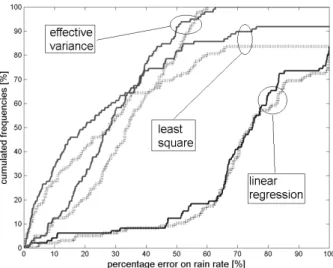
Fig. 3. Estimation error of the rainfall rate considering all the possi-ble validation ensempossi-bles, composed by 4 raingauges, and the com-putation ensembles, composed by 18 raingauges. Black line: time-spatial bilinear interpolation, gray line: time-spatial interpolation.
The values of the coefficients AT and BT corresponding
to a comparison raingauge site are computed considering two different 2-D interpolation methods: the first is a standard bi-linear interpolation on the AT and BT of the 4 computation
raingauges that are closer to the comparison raingauge, the second is still based on a spatial bilinear interpolation, but accounts also for a time correlation index between the radar sequences over the locations of the comparison and compu-tation raingauges. The complete results are summarized in Fig. 3 in terms of percentage error of the rainfall rate esti-mation over the comparison raingauge site, versus the cumu-lated frequencies. Notice in particular that:
a) the effective variance method performs best to find the slope and intercept coefficients, independently of the 2-D interpolation method used;
b) of the two 2-D interpolation methods, that based on the time correlation index is slightly better;
c) when using the effective variance method, the estima-tion error of the rainfall rate is always lower than 60%, independently of the set of time parameters chosen for the processing procedure and of the ensembles of com-parison/computation raingauges.
4 Conclusions
The procedure proposed in this paper allows the estimation of the rainfall rate over an area covered by a meteorological radar and a raingauge network. Such procedure is based on the local space-time comparison of the radar horizontal re-flectivity through the raingauge data. The procedure has been applied on an a solid radar-raingauge data set obtained during a precipitation event occurred in Tuscany (Italy) in 1999. The results show that the 2-D distribution of the rainfall rate can be estimated always with error lower than 60%. Many other tests with different data set corresponding to different precip-itation phenomena must be done in order to quantify the gen-eral performance. Such tests will allow the refinement and the tuning of all the parameters involved in the data process-ing procedure, especially concernprocess-ing the relationship among
TW, Ts and the observation time T . After that a profitable
comparison to other existing radar processing techniques will be possible in order to quantify the potential of the proposed procedure.
Acknowledgements. The authors would like to thank L. Capannesi
for his technical support. This work was sponsored by the CNR-GNDCI (National Group for the Defence from Hydrogeological disasters of the Italian National Research Council).
Edited by: L. Ferraris
Reviewed by: anonymous referees
References
Anagnostou, E. N., Krajewski, W. F., and Smith, J.: Uncertainty Quantification of Mean-Areal Radar-Rainfall Estimates, J. At-mos. Oceanic Technol., 16, 206–215, 1999.
Aydin, K., Lure, Y. M., and Seliga, T. A.: Polarimetric radar mea-surements of rainfall compared with ground-based gauges during maypole’84, IEEE transactions on geoscience and remote sens-ing, 28, 4, 443–449, 1990.
Cuccoli, F., Facheris, L., Giuli, D., and Mossa ,F.: Estimating the spatial distribution of rainfall rate through the combined use of radar reflectivity and rain gauge data, Proc. of 5-th Plinius Con-ference on Mediterranenan Storms, Aiaccio, Corsica, France, 1– 3 October 2003, 385–392, 2003.
Orear, J.: Least squares when both variables have uncertainties, Am. J. Physics, 50(10), 912–916, 1982.
Scarchilli, G., Gorgucci, E., and Chandrasekar, V.: Detection and estimation of reflectivity gradients in the radar resolution volume using multiparameter radar measurements, IEEE transactions on geoscience and remote sensing, 37, 2, 1122–1127, 1999.