HAL Id: hal-00305615
https://hal.archives-ouvertes.fr/hal-00305615
Submitted on 17 Jan 2007HAL is a multi-disciplinary open access archive for the deposit and dissemination of sci-entific research documents, whether they are pub-lished or not. The documents may come from teaching and research institutions in France or abroad, or from public or private research centers.
L’archive ouverte pluridisciplinaire HAL, est destinée au dépôt et à la diffusion de documents scientifiques de niveau recherche, publiés ou non, émanant des établissements d’enseignement et de recherche français ou étrangers, des laboratoires publics ou privés.
groundwater in the Plynlimon area of mid-Wales
C. Neal, M. Neal, S. Hughes, H. Wickham, L. Hill, S. Harman
To cite this version:
C. Neal, M. Neal, S. Hughes, H. Wickham, L. Hill, et al.. Bromine and bromide in rainfall, cloud, stream and groundwater in the Plynlimon area of mid-Wales. Hydrology and Earth System Sciences Discussions, European Geosciences Union, 2007, 11 (1), pp.301-312. �hal-00305615�
under a Creative Commons License.
Bromine and bromide in rainfall, cloud, stream and groundwater
in the Plynlimon area of mid-Wales
Colin Neal
1, Margaret Neal
1, Steve Hughes
2, Heather Wickham
1, Linda Hill
1and Sarah Harman
11Centre for Ecology and Hydrology, Maclean Building, Crowmarsh Gifford, Wallingford, OXON, OX10 8BB, UK 2Centre for Ecology and Hydrology, Orton Building, Deiniol Road, Bangor, Gwynedd, LL57 2UP, UK
Email for corresponding author: [email protected]
Abstract
Bromine in rainfall, cloud water, stream water and groundwater were measured in the upper River Severn catchments at Plynlimon in mid-Wales using two analytical procedures for bromide determination: a colorimetric method and, later, ion chromatography. Discrepancies between the methods indicated that the colorimetric method was measuring more than just bromide so it was dissolved labile bromine (DLBr) (Neal et al. 2007). This paper reports the variation in DLBr and bromide across the Plynlimon region and assesses the differences between these two measures. The average DLBr concentration in the streams ranges between 18.3 and 27.8 mgl-1 compared with a rainfall
average concentration of 15.6 mg l1. The corresponding bromide concentrations in the streams are 13.818.6 mg l-1 and 13.2 mg l-1 in rainfall.
For cloud water, throughfall and stemflow, DLBr concentrations are an order of magnitude higher than in rainfall and the concentrations are strongly correlated with chloride. Average values of bromide in rainfall and cloud water are similar to those of DLBr and are strongly correlated with chloride: unfortunately, no bromide measurements were taken in throughfall and stemflow. These results indicate that marine aerosol inputs are high and that the DLBr in these inputs is dominated by bromide. For cloud water, DLBr was correlated with dissolved organic carbon (DOC) as well as with chloride; hence, there may well be an organic-associated component. Within the streams draining the forested areas, DLBr increases with time as DOC increases. DLBr concentrations in the streams are correlated with DOC in most cases and, to a lesser degree, with chloride. However, for bromide there is no correlation with DOC, but a weak correlation with chloride remains and the gradient is higher than for the DLBr case. Increasing concentrations of both DLBr and DOC may well reflect the wetting up of the catchments as transpiration diminshes as the trees age as well as through felling. In groundwater, only DLBr has been measured, and its concentration is similar to that for the streams. However, in the groundwater zone, DLBr is poorly correlated with DOC concentrations, in which DOC is largely converted to CO2. Atmospheric inputstream output flux estimates indicate a net uptake of bromide by the catchment
of around 30%, matched by a corresponding release of DOC-associated bromine.
Keywords: bromide, cloud water, chloride, dissolved labile bromine, dissolved organic carbon, organobromine, Hafren, Hore, groundwater,
mist, organobromine, Plynlimon, rainfall, stemflow, Tanllwyth, throughfall, river
Introduction
In nature, bromine, one of the key halogens, occurs mainly in the inorganic form of bromide (Greenwood and Ernshaw, 2005). Although bromine is the 46th most abundant element in the Earths crust (2.5 ppm), because of its high solubility, bromine is found predominantly, as bromide, in sea water, (65 000 mg l1) and in brines (Greenwood and Ernshaw,
2005). The level of bromide in groundwaters varies considerably and is usually linked with chloride concentration (Edmunds, 1996). For potable groundwaters of low salinity, bromide concentrations are typically less than 400 mg l1 (Edmunds, 1996; Davis et al., 2004).
Although, in nature, bromide is usually considered as a relatively conservative ion, often used as a tracer for water movement, it can also sorb onto sediments and be involved in biogeochemical cycling (Davis et al., 1998; Korom, 2000; Huggenberger et al., 1998; Neal et al., 1990). Bromine can occur in various oxidation states from 1 up to +7 (1, 0, 1, 3, 4, 5, 7) but, of these higher oxidation states, dissolved inorganic bromine is of environmental concern as the ion bromate. Bromide is oxidised to bromate when water is disinfected using ozone or chlorine dioxide: bromate is a suspected carcinogen and, within the Drinking Water Directive, a statutory limit of 10 mg l-1 has been proposed
(EA, 1997). Natural organic matter can influence the rate of such bromide oxidation to bromate and can lead to the formation of organobromine compounds as well (Rathburn, 1996; Nicolaou et al., 2004; Westerhoff et al., 1998). The organobromines formed during the chlorination (Rook, 1974) constitute three of the four main trihalomethanes (THMs) of critical concern: bromodichloromethane, chlorobibromomethane and bromoform (the other trihalomethane being chloroform). In drinking water, the maximum contaminant level of THMs is being set at a total of 40 mg l1 although there may well be issues over setting a
level based on total concentration as the organobromines may be more hazardous than chloroform (Rathburn, 1996). Strategic work has been undertaken in examining the potential of surface and groundwaters for generating trihalomethanes (Rathburn, 1996; Stuart et al., 2001) and there can be marked costs to the water industry (Batjer et
al., 1980). There is also a wide range of organobromines in
the environment. For example, methyl bromide is an effective nematocide and general pesticide (herbicide, fungicide and insecticide). Correspondingly, ethylene dibromide and dibromochoropropane are used as pesticides and the former was used extensively as a gasoline additive for scavenging lead from the anti-knock PbEt4 before lead
additives were phased out of some 20 years ago. Organobromine compounds are also used extensively as fire retardants: in 1990, the primary usage of bromine was 29% as flame retardants, 16% as ethylene dibromide in agriculture, 16% as drilling fluids, 11% as bromides and 5.5% as water treatment chemicals (Greenwood and Ernshaw, 2005). Indeed, the use of organobromines as fire retardants has led to contamination of the ecosphere on a widespread scale (Santillo and Johnson, 2003). Certainly, there can be a wide range of organobromine contaminants in river, lake and estuarine/marine environments (Bedard
et al., 1998; Hashimoto et al., 1998; Manninen and Hasanen,
1992; Weigel et al., 2005). Nonetheless, a range of organobromines occurs naturally in the environment; for example, almost 4000 organohalogen compounds containing mainly chlorine or bromine (about 50% of each) are produced by living organisms or formed during natural abiotic processes. These organobromines can be transferred from the sea to the atmosphere and can be involved in global biogeochemical processes (Cloern, 1996; Gribble, 1989; 2000, 2003; Laturnus et al., 2000; Quack and Wallace, 2003).
Over the past 20 years, detailed hydrobiogeochemical studies have been undertaken for the Plynlimon catchments in upland Wales (Reynolds et al., 1986; Neal et al., 1997a,b, 2001). Within these studies, a wide range of chemicals has been determined in rainfall, cloud water (mist), throughfall,
stemflow, stream water and groundwater. Included in the assessment has been what was originally thought of as bromide and the earlier findings have been presented by Neal et al. (1990). However, since that time, much more extensive data have been collected, including measurements in groundwater. Clear, long-term temporal variations are now much more marked with increasing concentrations consistent with increases in dissolved organic carbon (DOC) (Neal et al., 1997a, 2005). Furthermore, and most critically, a change in methodology in the late 1990s has revealed that what was originally thought of as a measurement of bromide, is in fact a measure of dissolved labile bromine (DLBr) which may well comprise a sum of the bromide and bromine bearing labile organic carbon. The method was then changed in 1999 to measure bromide directly as the DLBr methodology had to be decommissioned due to age (Neal
et al., 2007).
Hughes et al. (1996, 1998) in the Plynlimon area showed, as did Vinogradov in 1959, that bromide is correlated strongly with organic matter in soils and is especially enriched in peat. Rewetting organic-rich soils can result in marked increases in bromide and dissolved organic carbon (DOC) in solution, an issue of importance for drinking water, especially in areas such as Plynlimon in the UK uplands because of their primary importance in relation to water resources. Also, a study in Chile, on the role of halogen retention and cycling in two peat bogs, found that up to 91% of bromine is bound in an organic form (Biester et al. 2004). In the UK, Wilkins (1978) surveyed the distribution of bromide in topsoil of north-west Pembrokeshire and found a range of 10 to 515 µg/g Br, with a mean of 54 µg/g Br. Such high concentrations of Br in topsoil are to be expected since the west of Wales receives high inputs of sea salts in precipitation. Yuita et al. (1991) studied the effects of a range of physical and chemical variables on the dissolution rates of the halogens iodine, bromine and chlorine from a range of Japanese soils, which contain large amounts of bromine and iodine. They concluded that soil moisture content was the most important environmental factor affecting the dissolution of bromine and iodine, the values of which increased markedly under flooded conditions. This is consistent with the results of a study of bromide dissolution in peat following experimental rewetting of naturally drained gully mire at Plynlimon; in the peat-water the bromide concentrations increased substantially on flooding (Hughes et al., 1996). Moreover, bromide release was highly seasonal, with the largest concentrations observed in early autumn (Hughes et al., 1998). In this paper, the findings for DLBr and bromide are described (a) to update and, in places, correct the earlier interpretations, (b) to examine the relationship between
DLBr and bromide and (c) to assess how important dissolved labile organobromine might be, based on a comparison of DLBr, bromide and DOC.
Study area and sampling programme
DLBr and bromide data have been amassed both from long-term (10 to 25 years) and more recent shorter long-term monitoring programmes (1 to 5 years); rainfall, cloud water (mist), throughfall, stemflow, stream water and groundwater were measured in the headwaters of the River Severn. Weekly monitoring began in May 1983 for the atmospheric inputs and most of the stream outputs. Rainfall was the accumulation of the catch in two rainfall collectors about 1 km apart, one near the top and the other near the bottom of the catchment. Cloud water was collected near the top of the catchment using a specialised collector (Wilkinson et
al., 1997), while throughfall and stemflow were collected
using a network of collectors further down the catchment. There were five primary stream water monitoring points with catchment areas varying between 50 and 300 ha. One stream site represents the upper moorland area (upper Afon Hafren) while the other four sites, all afforested to different degrees, were the lower Afon Hafren, including the moorland drainage from the upper Hafren, the Nant Tanllwyth, the upper Afon Hore and the lower Afon Hore. More recently, additional sites examined the interaction between soil type and forest harvesting on water quality. They were smaller catchment areas (usually much less than 5 ha); four of them were paired with control and manipulated forested catchments (the south-east, SE, and Tanllwyth, Tan, sites): the fifth site is south2Hore. The sites represented two of the main soil types of concern, peaty podzols (South2Hore, SE1, SE3) and peaty gleys (TanN, TanS). The manipulated sites at Plynlimon are South2Hore, SE1, and TanS. The SE and Tan streams drain into the Afon Hafren while South2Hore drains into the Afon Hore. The site names for the paired catchments are given the suffix f for felling and c for control. For the paired sites, shallow groundwater was monitored for water quality and stream and groundwater was monitored fortnightly. Two additional borehole sites provided information on the influence of felling (HA4bf and quarry). Groundwater was collected by grab using a down-borehole sampler, i.e. the borehole was not purged prior to sampling
Details of the period of monitoring at each site and of the areas and timing of felling are in Neal and Kirchner (2000): from 2001, measurements have been restricted to rainfall, cloud water, the upper and lower Afon Hafren and Afon Hore, and the Nant Tanllwyth. The overall water quality of the area is described by Neal et al. (1997a,b, 2001).
Chemical analysis
The samples were filtered in the field (0.45mm cellulose acetate membranes) and stored in the dark at 4oC in highly
cleaned glass bottles prior to analysis to minimise sample contamination and deterioration. DLBr (formerly and incorrectly denoted as bromide) was determined using an automated procedure based on the catalytic effect of bromide on the oxidation of iodine to iodate by potassium permanganate in sulphuric acid solution (Moxon and Dixon, 1980; Neal et al., 2007). The unreacted iodine was extracted into carbon tetrachloride and measured spectro-photometrically at 0.5oC, with correction for chloride which
also catalysed the reaction. This analysis was undertaken from the start of the study in May 1983 up to January 1999. Thereafter, bromide was determined by ion chromatography (IC) using a Dionex system (Neal et al., 2007). For the colorimetric and IC determinations, the samples were assayed in duplicate and singularly, and the detection limits were 2 and 10 mg l1, respectively. The DLBr measurement
may contain colloidal material that passes through the filter papers and this may be similar for DOC.
Results
The results for DLBr and bromide are presented in Tables 1 and 2 and Figs. 1 to 4. In Table 1, a comparison is made between DLBr and bromide for those sites where measurements have been taken consecutively with monitoring for DLBr from May 1983 to January 1999 and for bromide thereafter). Table 2 contains information on DLBr which has been monitored at many more sites than bromide. In particular, additional information on DLBr is provided on throughfall, stemflow, groundwater and the paired catchments. The Tables include information on DOC and chloride concentrations which indicate linkages of DLBr and bromide with an organic and a sea-salt component, respectively. For both Tables, means and flow weighted values are provided the latter are more appropriate when flux is considered (here annual flux is taken as the sum of the flow weighted average concentration and the annual average flow). Figures 1 to 4 provide time series for DLBr, bromide and DOC for the long-term monitoring stream sites. They show the temporal changes and the difference between the DLBr and bromide concentrations. DOC measurements show the relationship with DLBr and bromide and DOC concentrations have increased over time (Neal et al., 2005). Chloride does not change uniformly over time (Neal et al., 2001) and, hence, has not been plotted.
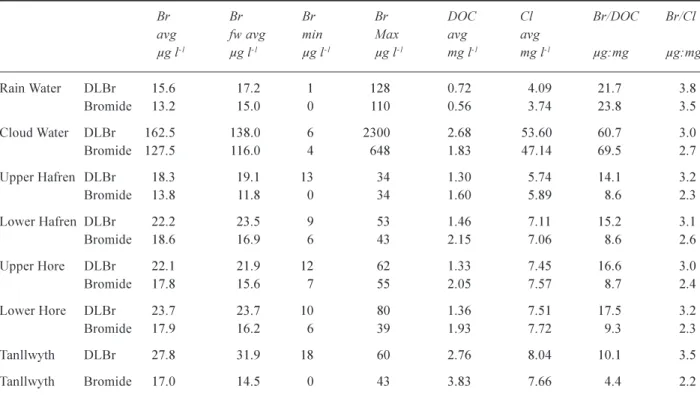
Table 1. Dissolved labile bromine, bromide, dissolved organic carbon and chloride in Plynlimon waters.
Br Br Br Br DOC Cl Br/DOC Br/Cl
avg fw avg min Max avg avg
µg l-1 µg l-1 µg l-1 µg l-1 mg l-1 mg l-1 µg:mg µg:mg Rain Water DLBr 15.6 17.21 128 0.72 4.09 21.7 3.8 Bromide 13.215.0 0 110 0.56 3.74 23.8 3.5 Cloud Water DLBr 162.5 138.0 6 2300 2.68 53.60 60.7 3.0 Bromide 127.5 116.0 4 648 1.83 47.14 69.5 2.7 Upper Hafren DLBr 18.3 19.1 13 34 1.30 5.74 14.1 3.2 Bromide 13.8 11.8 0 34 1.60 5.89 8.6 2.3 Lower Hafren DLBr 22.2 23.5 9 53 1.46 7.11 15.23.1 Bromide 18.6 16.9 6 43 2.15 7.06 8.6 2.6 Upper Hore DLBr 22.1 21.9 12 62 1.33 7.45 16.6 3.0 Bromide 17.8 15.6 7 55 2.05 7.57 8.7 2.4 Lower Hore DLBr 23.7 23.7 10 80 1.36 7.51 17.5 3.2 Bromide 17.9 16.26 39 1.93 7.72 9.3 2.3 Tanllwyth DLBr 27.8 31.9 18 60 2.76 8.04 10.1 3.5 Tanllwyth Bromide 17.0 14.5 0 43 3.83 7.66 4.4 2.2
Table 2. Dissolved labile bromine, dissolved organic carbon and chloride in Plynlimon waters.
Br Br Br Br DOC Cl Br/DOC Br/Cl
avg fw avg min max Avg avg
µg l-1 µg l-1 µg l-1 µg l-1 mg l-1 mg l-1 µg:mg µg:mg ATMOSPHERICINPUTS Rainfall 15.6 17.21 128 0.724.09 21.7 3.8 Cloud 162.5 138.0 6 2300 2.68 53.6 60.7 3.0 Throughfall 110.7 77.4 22 600 11.4 28.5 9.7 3.9 Stemflow 148.2143.6 24 475 19.2 30.9 7.7 4.8 STREAMS Upper Hafren 18.3 19.1 13 34 1.30 5.74 14.1 3.2 Upper Hore 22.2 23.5 9 53 1.46 7.11 15.23.1 Lower Hafren 22.1 21.9 12 62 1.33 7.45 16.6 3.0 Lower Hore 23.7 23.7 10 80 1.36 7.51 17.5 3.2 Tanllwyth 27.8 31.9 18 60 2.76 8.04 10.1 3.5 South2Hore 26.6 22.1 4 66 1.74 6.97 15.3 3.8 SE1f 40.8 42.0 16 70 1.16 8.36 35.2 4.9 SE3c 30.7 28.2 15 50 0.62 7.54 49.8 4.1 TanNc 68.0 55.29 148 15.24 8.06 4.5 8.4 TanSf 52.6 40.5 8 174 12.76 6.25 4.1 8.4 GROUNDWATER Ha4B 36.4 na 14 128 0.64 9.78 57.3 3.7 Quarry 32.1 na 16 70 0.42 12.1 76.0 2.7 SE1bf 34.9 na 17 60 0.59 8.86 58.7 3.9 SE3bc 37.7 na 20 80 0.42 11.1 89.7 3.4 TanNbc 16.6 na 12 30 0.50 10.233.3 1.6 TanSbf 46.1 na 14 103 1.48 9.27 31.1 5.0
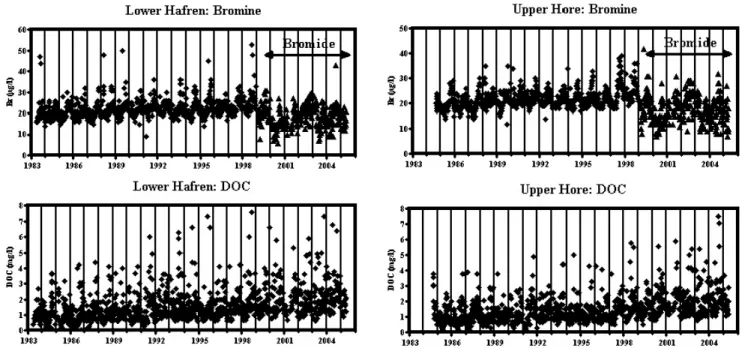
Fig. 1. Dissolved labile bromine, bromide and DOC concentration
time series for the lower Afon Hafren. Fig. 2. Dissolved labile bromine, bromide and DOC concentrationtime series for the upper Afon Hore.
Fig. 3. Dissolved labile bromine, bromide and DOC concentration
time series for the lower Afon Hore. Fig. 4. Dissolved labile bromine, bromide and DOC concen-tration time series for the upper Afon Hafren and the Nant Tanllwyth.
ATMOSPHERIC INPUTS
Values of DLBr show a large range of concentrations in rainfall, cloud water, throughfall and stemflow. For example, the DLBr concentrations in rainfall varied between 1 and 128 µg l1 while the corresponding range for cloud water
was 6 to 2300 µg l1. In all cases, the values were skewed
towards lower concentrations. Compared with rainfall
(average 15.6 µg l1), average DLBr concentrations in cloud
water, throughfall and stemflow were an order of magnitude higher (average 162.5, 110.7 and 148.2 µg l1, respectively).
In the case of bromide, a similar pattern is observed for rainfall and cloud water although the average concentrations are about 20% lower than their DLBr counterparts.
DLBr concentrations were highly linearly correlated with chloride concentration and similar results were found for bromide with rainfall and cloud water (Tables 3 and 4) no bromide data were available for throughfall and stemflow. The regression gradients range from 2.78 to 3.37 µg:mg, a value slightly lower than that for bromide in sea water (3.42µg:mg). Further, sodium shows a strong linear relationship with chloride in rainfall at Plynlimon and the gradient dNa/dCl is also slightly lower than that in sea water (Neal and Kirchner, 2000) i.e. there is a moderate
enrichment of chloride in the atmospheric deposition. Thus, atmospheric inputs of DLBr and bromide originate in the sea and bromide is the dominant component of the DLBr. In the case of cloud water and stemflow, DLBr and DOC are also correlated.
The similarity in gradient for DLBr and bromide with respect to chloride in rainfall and cloud water indicates that the difference in their average concentrations reflects the difference in bromide concentrations between the two monitoring periods. Such variability is to be expected since
Table 3. Regression of dissolved organic carbon and chloride with dissolved labile bromine for Plynlimon waters. Concentration units are µg l-1 for DLBr and mg l-1 for dissolved organic carbon and chloride.
GradDOC 2*std GradCl 2*std Const 2*std r2 N
Rainfall -0.61 0.74 2.78 0.10 5 11 0.836 625 Cloud 3.58 1.58 2.99 0.08 -7 100 0.937 380 Throughfall 0.33 0.25 3.11 0.19 18 60 0.884 142 Stemflow 1.99 0.29 2.88 0.21 21 62 0.889 132 Upper Hafren 2.38 0.29 0.58 0.30 12 5 0.385 435 Upper Hore 1.43 0.36 0.54 0.17 16 7 0.104 752 Lower Hafren 2.56 0.25 0.36 0.20 16 7 0.322 852 Lower Hore 1.81 0.40 0.58 0.19 17 8 0.101 859 Tanllwyth 2.86 0.24 0.49 0.27 16 8 0.634 349 South2Hore -1.00 0.65 0.62 0.20 24 14 0.100 638 SE1f 1.58 1.69 0.27 0.67 37 18 0.023 174 SE3c -0.21 1.85 1.37 0.58 21 8 0.161 124 TanNc 3.28 0.59 -0.13 0.97 19 34 0.619 106 TanSf 3.39 1.11 2.86 2.45 -9 63 0.230 152 Ha4B -0.29 3.97 -2.13 0.81 57 20 0.133 190 Quarry 1.14 2.17 1.83 0.82 9 11 0.138 136 SE1bf 6.825.08 -5.90 1.93 83 18 0.324 102 SE3bc -1.86 6.31 0.65 0.76 31 14 0.033 102 TanNbc 1.26 2.85 -1.88 1.98 6235 0.029 136 TanSbf 0.20 1.70 -1.34 0.37 30 4 0.314 132
Table 4. Regression of dissolved organic carbon and chloride with bromide for Plynlimon waters. Concentration units are µg l-1 for
bromide and mg l-1 for dissolved organic carbon and chloride.
GradDOC 2*std GradCl 2*std Const 2*std r2 N
Rainfall -0.02 1.36 3.37 0.14 0.6 8.5 0.922 210 Cloud -0.97 3.05 2.88 0.16 -7.2 69.1 0.910 140 Upper Hafren -0.620.50 1.67 0.60 4.5 9.20.116 303 Upper Hore -0.15 0.64 0.76 0.49 12.4 11.4 0.033 305 Lower Hafren 0.07 0.41 1.20 0.49 10.0 9.6 0.074 304 Lower Hore 0.35 0.69 0.87 0.49 10.5 10.8 0.042302 Tanllwyth -0.120.31 1.22 0.43 8.2 11.8 0.101 303
the marine signal (sodium and chloride) shows strong year to year variations that may be linked to the North Atlantic Oscillation in climate (Neal et al., 2001).
RIVER WATER
The DLBr and bromide concentrations in the stream waters are moderately higher than those in rainfall and their variation in concentration is much smaller, with a maximum range of 0 to 80 µg l1. For all the main river sites where
both DLBr and bromide have been measured (sequentially), average concentrations are between 18.3 and 27.8 µg l1 for
DLBr and 13.8 and 18.6 µg l1 for bromide; bromide
concentrations are 17 to 39% lower than DLBr.
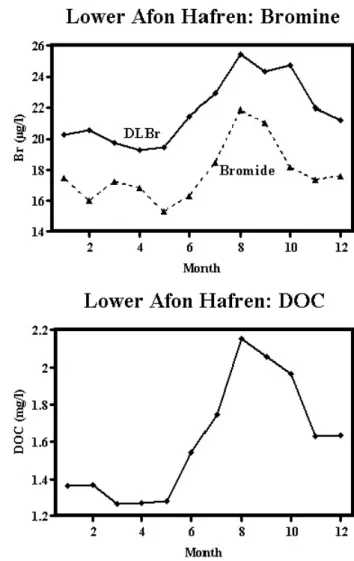
The DLBr and bromide concentrations vary seasonally; both are higher in autumn when DOC concentrations are also at their highest (Fig. 5). For the lower Hafren and the upper and lower Hore, where there is a 15-year continuous weekly record of values of DLBr, there are small longer term (decadal) changes in concentration, while for the lower Hafren and upper Hore, DLBr concentrations increase over time. For example, in the case of the lower Hafren, average concentrations in 1983, 1990 and 1998 are 21.1, 22.2 and 26.0 µg l1, respectively. The equivalent values for the upper
Hore in 1984, 1990 and 1998 are 20.4, 22.7 and 24.9 µg l1,
respectively. For the lower Hore, concentrations of DLBr increase over time between 1983 and 1989, with a bulge between 1987 and 1993: average concentrations in 1983, 1990 and 1998 are 20.9, 26.3 and 25.5 µg l1, respectively.
For the lower Hore, the bulge in DLBr corresponds with the period just after major clear-fell.
In the case of DLBr, concentrations have also been measured for the paired catchments and the south2Hore
streams. For the paired catchments, DLBr concentrations were higher than for the main streams with averages ranging between 30.7 and 40.8 µg l1 for the podzol and 52.6 and
68.0 µg l1 for the gley sites: for south2Hore, the average
DLBr concentration (26.6 µg l1) is within the range for the
main streams. In the case of the gley sites, DOC concentrations were particularly high (around 12.5 mg l1;
Table 2). Further, for all the streams other than the paired sites on podzol, the average DOC and DLBr concentrations were correlated linearly with a gradient of around 3.3 µg:mg and an intercept of DLBr for zero DOC was around 17µg l-1
(Fig. 6) i.e. a value close to that for the average bromide concentrations in the streams. This feature, coupled with approximately the same gradient for the Tan sites with particularly high DOC concentrations, indicates that the bromine component associated with the DOC has a bromine to carbon content of around 3.3 µg:mg that corresponds to a molar ratio of 0.5*103.
Fig. 5. The relationship between average concentrations of dissolved
While some statistically significant correlations occur (p<0.005) between DLBr and bromide with DOC and chloride, the correlations are much weaker than those for the atmospheric inputs. For the upper and lower Hafren and the Tanllwyth, there were marked statistically significant relationships for DLBr with both DOC (gradients 2.38±0.29 to 2.86±0.24 µg:mg) and chloride (gradients 0.49±0.27 to 0.58±0.30 µg:mg). For the Tanllwyth paired catchment only the relationship with DOC was significant statistically (gradients 3.28±0.59 and 3.39±1.11 µg:mg). Correlations for DLBr with DOC and chloride are lower for the other streams monitored.
Bromide had no statistically significant relationship with DOC and a poor, although statistically significant relationship with chloride, the gradient of which varies between 0.8±0.5 and 1.7±0.6 µg:mg.
FELLING EFFECTS
The patterns of DLBr concentration change over time for the upper and lower Hore, probably because of felling. Neal
et al. (1992) indicated that, for the felled area only, bromine
concentrations may have increased by around a third (from 24 to 32 µg l1) an increase which is also observed for DOC.
The current study indicates that the major enrichment of DLBr with felling ceases after about six years. Thus, breakdown of organic debris (brash) produced when the trees were felled, coupled with increased wetting (Hughes
et al., 1996, 1998; Marc and Robinson, 2007), led to
increased DOC and DOC-associated bromine until growth of the next generation of trees led to carbon/bromine retention by the soil. For the south2Hore and the paired
felling sites, there was no clear change in DLBr and hence the felling effects were not significant at these other sites.
TRENDS IN DLBR OVER TIME
To explore the trends in bromine over time, the DLBr concentrations have been examined using linear statistical analysis (Table 5) for the sites with the longest data runs for DLBr (rainfall, cloud water and the upper and lower Afon Hafren and Hore): bromide trends were not examined due to the more limited extent of the data. The regression took two forms. Firstly DLBr concentrations were regressed against time to obtain a general pattern of change. Secondly, DLBr was regressed against time and DOC concentration to factor out the effect of the increasing DOC concentrations over time for the lower Hafren and the upper and lower Hore.
Regression of DLBr with time
l No statistically significant relationship for rainfall, cloud
water and the upper Hafren.
l Statistically significant relationships for the lower
Hafren and the upper and lower Hore with a gradient of around 0.28 mg l1 yr1 (range 0.24 to 0.29 mg l1 yr1).
Regression of DLBr with time and DOC
l No statistically significant relationship for rainfall and
cloud water.
l A statistically significant relationship for the upper Hafren determined by the correlation with DOC (2.2±0.3 mg l1: mg l1); there was no statistically
significant relationship with time.
Table 5. Regression of DLBr (ìg l1) against time (year) and DOC (mg l-1).
Year DOC Constant r2 N
grad 2*std grad 2*std 2*std DLBr = a*year + c Upper Hafren 0.01 0.13 4 7 0.000 435 Upper Hore 0.28 0.06 -5427 0.104 751 Lower Hafren 0.29 0.06 -547 8 0.090 855 Lower Hore 0.24 0.06 -460 9 0.063 859 Tanllwyth 0.46 0.30 -890 120.027 349 DLBr = a*year + b*DOC + c Upper Hafren -0.03 0.10 2.23 0.28 78 5 0.364 435 Upper Hore 0.25 0.06 1.00 0.33 -475 7 0.146 751 Lower Hafren 0.16 0.06 2.30 0.26 -292 7 0.338 855 Lower Hore 0.19 0.07 1.15 0.40 -354 8 0.098 859 Tanllwyth 0.18 0.19 2.68 0.23 -346 8 0.625 349
l A statistically significant relationship for the lower
Hafren and the upper and lower Hore that is determined by the correlation with both time (0.2 mg l1 yr1 (range
0.16 to 0.25 mg l1 yr1) and DOC (1.5 mg l1: mg l1,
range 1.0 to 2.3 mg l1: mg l1).
Thus, temporal trends in DLBr occur not in the atmospheric inputs but only in the rivers, wherein DLBr is correlated with DOC and temporal changes occur only for those sites where the concentration of DOC increases over time (i.e. the streams draining the forested areas).
INPUT-OUTPUT MASS BALANCES
Although there are some differences in the concentrations of DLBr and bromide between rainfall and stream water, to compare the values for the atmospheric inputs and stream outputs, there is a need to compare input-output fluxes. There are two reasons for this. Firstly, cloud water input flux might be significant: although the cloud water volume is small compared with the rainfall, the concentration of DLBr and bromide in cloud water is an order of magnitude higher than that in rainfall. Wilkinson et al. (1997) estimated that, of the total flux of bromine at Plynlimon, cloud water accounts for around 12% and 34% for the moorland and forested catchments respectively. Secondly, evaporation and transpiration of the rainfall input is also important (Neal et
al., 1997a). Here, the input-output fluxes have been
compared using hydrological and hydrochemical approaches. In the hydrological approach, flow weighted concentrations for DLBr and bromide are combined with the rainfall, cloud water and stream water fluxes. Annual average rainfall is around 2518 mm while the average annual volumetric input from cloud water is 33 mm for moorland and 140 mm for forest. The evaporation and transpiration from moorland is 496 mm and from forest 627 mm (Neal
and Kirchner, 2000). In the hydrochemical approach, chloride is used as a conservative tracer and the ratios of DLBr and bromide to chloride in atmospheric deposition are compared with the ratios in the streams. The atmospheric ratio was calculated using the rainfall and cloud water fluxes, while, for the calculations, flow weighted DLBr, bromide and chloride concentrations were used.
The percentage retention of DLBr and bromide by the catchments, estimated using water and chloride balances (Table 6) indicate:
l that results using the hydrological and hydrochemical
approaches were similar, with in some cases moderately higher estimates of uptake using a chloride balance.
l the uptake of DLBr by the catchments was small
(average 5 to 12% with a range -10 to +20); the lowest uptake occurred for the highest forest cover (lower Hore and Nant Tanllwyth).
l a significant uptake of bromide across the catchments
(average 30 to 35% with a range of 14 to 42%).
GROUNDWATER
The average DLBr concentration in groundwater ranges between 16.6 and 46.1µg l1 across the monitoring sites (the
range of individual data points rather than averages is 12 to 103 µg l1). These ranges are similar to those found for the
streams.
DOC concentrations in groundwaters were low compared with those in the stream waters and DLBr in the groundwater is poorly correlated with DOC and chloride: only with SE1B is there a slightly significant positive relationship with DOC. While DOC concentrations are low in the groundwater, dissolved carbon dioxide levels can be very high (Neal et
al., 1997b). Within the groundwater zone, DOC supplied
from the soil zone decomposes to generate CO2 so that the
Table 6. Percentage retention of DLBr and bromide by the catchment as estimated using water and chloride balances. DLBr Bromide
% Retention % Retention
Water balance Chloride balance Water balance Chloride balance
Upper Hafren 18 19 4242 Lower Hafren -4 17 14 30 Upper Hore 15 20 30 36 Lower Hore 3 3 24 31 Tanllwyth -10 1 4238 avg 5 1230 35 min -10 1 14 30 max 18 20 42 42
link between DLBr and DOC in the soils and streams is broken within the groundwater zone.
For chloride, there can be weak positive or negative relationships with DLBr. Further, even for the average concentrations there is a very weak relationship between DLBr, DOC and chloride.
Discussion
The study shows that, while bromide might represent the main form of bromine in rainfall and the atmospheric inputs as well as in the streams and groundwaters, bromine associated with DOC can be significant within the streams. Felling can lead to small increases in bromine associated with DOC in the streams but not always. Also, there can be longer term changes in DOC-associated bromine in the streams but only in streams draining forests as opposed to moorlands. Hughes et al. (1996, 1998) noted that organic soils, on rewetting, release both DOC and bromide and one of the effects of tree harvesting (and, indeed of tree ageing: Marc and Robinson, 2007) is lower water usage. As such, the increase in both DLBr and DOC observed only in the forested catchments may well be related to this wetting-up process (Marc and Robinson, 2007). This increase may be associated with both organic associated bromine and with bromide, as indicated in the main streams (upper and lower Hafren and Hore) by the lower DLBr to DOC gradient (average of 1.87 mg:mg with range 1.00 to 2.30 mg:mg) when time is factored out compared with (a) The main streams where time is not factored out
(average of 2.05 mg:mg and range of 1.43 to 2.56 mg:mg).
(b) The high DOC and DLBr values in the Tanllwyth streams: 3.28 to 3.39 mg:mg for the small streams and an average of 2.86 mg:mg for the main stem of the Tanllwyth.
The same feature is also observed in the main stem of the Tanllwyth where factoring out of time reduced the gradient to 2.68 versus 2.86 mg:mg).
In the streams, the variation in DLBr and bromide concentration is less than in rainfall and cloud water, because the catchments damp the rainfall signal, not just for DLBr and bromide but also for many other components of low chemical reactivity and high atmospheric input (Neal and Kirchner, 2000). It reflects the highly heterogeneous nature of water and chemical flux through catchments with a wide range in water residence times (Kirchner et al., 2000, 2001; Feng et al., 2004).
While the major component of the DLBr in the
atmospheric input is bromide, in the streams there is probably a bromine component associated with DOC for the organic-rich soils of the area. Indeed, hill-top peats cover 52% of the Afon Hafren and 33% of the Afon Hore catchments (Reynolds et al., 1989). The linkage may be as organo-bromine or colloidal material; within the catchment, the loss of bromide from the atmosphere is approximately balanced by a gain in bromine associated with DOC.
The difference in bromide and bromine associated with DOC for the atmospheric inputs and the streams will not be connected with a straight conversion between inorganic and organic forms in the dissolved phase. There are four reasons for this conjecture. Firstly, the transport of DLBr and bromide and their interaction with the soil matrix will be complex and highly heterogeneous. Secondly, DLBr is weakly correlated with chloride. If there was just conversion in the water, the strong correlation observed in the atmospheric inputs would be maintained. Thirdly, seasonal changes in DLBr and bromide concentration are linked to the seasonal changes for DOC but not for chloride; this implies biogeochemical cycling. Fourthly, there are longer term variations in DLBr and DOC that probably reflect changes in biogeochemical functioning.
Within the groundwater zone, some DOC is broken down to produce CO2. In the stream, the water chemistry will
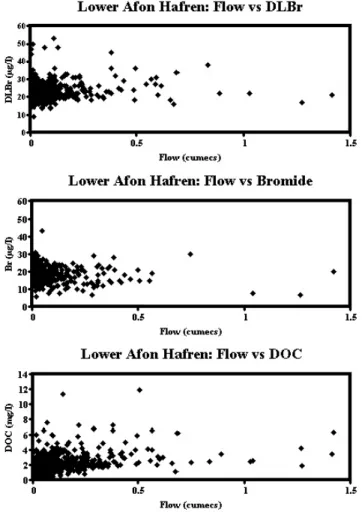
depend on the relative proportions of soil and groundwater inputs (Neal et al., 1997d). Generally, under baseflow conditions, the stream waters are derived from groundwater areas while, under stormflow conditions, the waters are mainly from the soil zone. However, there is no simple correlation between DLBr and flow just as there is no simple relationship between DOC and flow. Thus, at intermediate flows, there can be a high input of DLBr, bromide and DOC (Fig. 7). Further, the proportion of soil and groundwater inputs can vary considerably from site to site (Hill and Neal, 1997; Neal et al., 1997c). Indeed, in the case of the south-east sites (SE1f and SE3c) on podzol, the streams are perennial when they might be expected to be ephemeral; even at high flows, there is a large component of groundwater. This explains why the DLBr-DOC relationship for these sites differs from that for the other streams (Fig. 6). In contrast, for the Tan sites on gley, the low permeability of the soils means that the runoff comes essentially from the organic-rich soil zone. This explains why DLBr and DOC concentrations are particularly high and why there is the strong relationship between DLBr and DOC.
The present study cannot gauge the total input-output balance for bromine, because there is no certainty that the more refractory components for bromine are associated with DOC. Indeed, the evidence of a bromine association with DOC in the waters is only secondary as it is based on the
relationships between DLBr and DOC using an analytical procedure for DLBr that is only defined operationally. Despite this limitation, the study flags the need to monitor bromine speciation in upland waters, to examine the hydrogeochemical functioning and to determine what natural and anthropogenic forms of humic/fulvic acid-bromine and organoacid-bromines are present. This is necessary in assessing the pollution climate for the uplands with respect to organobromine contaminants as well as the role of natural humic and fulvic acids in determining bromine speciation and the applied issues of the formation and levels of trihalomethanes in drinking waters. The work is particularly relevant because, in many areas of the UK, there are organic-rich soils in which DOC is increasing over time (Neal et
al., 2005).
With regard to bromine in the streams and groundwaters, comparison can be made with data from other parts of the UK and further afield. For the main Plynlimon streams, the average DLBr and bromide concentrations are 46 and 35 µg l1, respectively, which compares with an average for
bromide in eastern UK rivers of less than 50 µg l1 for
relatively clean systems to up to 1716 µg l1 for industrial/
urban contaminated systems. Indeed, for the latter point source pollution under baseflow conditions, concentrations can reach up to 9500 µg l1 (Neal and Robson, 2000). In
this context, the bromide levels at Plynlimon must be classed as low and perhaps typical of UK upland areas. For the groundwaters at Plynlimon, the average bromide concentration is 34 µg l1 which compares favourably with
the range of 60 to 340 µg l1 for potable groundwaters in
the UK (Edmunds, 1996).
References
Batjer, K., Gabel, B., Koschorrek, M., Lahl, U., Lierse, W.K., Stachel, B. and Thiemann, W., 1980. Drinking water in Bremen trihalomethames and social costs a case study of bromoform formation during chlorination of river water highly contaminated with bromide ions. Sci. Total Envir., 14, 287291.
Bedard, D.L., Van Dort, H. and Deweerd, K.A., 1998. Brominated biphenyls prime extensive microbial reductive dehalogenation of Aroclor 1260 in Housatonic River sediment. Appl. Environ. Microbiol., 64, 17861795.
Biester, H., Keppler, F., Putschew, F., Martinez-Cortizas, A. and Petri, M., 2004. Halogen retention, organohalogens, and the role of organic matter decomposition on halogen enrichment in two Chilean peat bogs. Environ. Sci. Technol., 38, 19841991. Cloern, J.E., 1996. Phytoplankton bloom dynamics in coastal ecosystems: a review with some general lessons from sustained investigation of San Francisco Bay, California. Rev. Geophys.,
34, 127168.
Davis, S.N., 2004. Variations of bromide in potable groundwater in the United States. Ground Water, 42, 902909.
Davis, S.N., Whittenmore, D.O. and Fabrryka-Martin, J., 1998. The use of chloride/bromide ratios in studies of potable water. Ground Water, 36, 338350.
EA, 1997. The determination of bromate, chlorate and chlorite in waters by ion chromatography. Environment Agency, Rio House, Waterside Drive, Aztec West, Aldmondsbury, Bristol, BS32 4UD, UK. 18pp.
Edmunds, W.M., 1996. Bromide in British Groundwater. Min. Mag., 60, 275284.
Feng, X., Kirchner, J.W. and Neal, C., 2004. Spectral analysis of chemical time series from longterm catchment monitoring studies: Hydrochemical insights and data requirements. Water Air Soil Pollut., Focus, 4, 221235.
Gibble, G.J., 1999. The diversity of naturally occurring organobromine compounds. Chem. Soc. Rev., 28, 335346. Gibble, G.J., 2000. The natural production of organobromine
compounds. Environ. Sci. Pollut. Res., 7, 3749.
Gibble, G.J., 2003. The diversity of naturally produced organohalogens. Chemosphere, 52, 289297.
Greenwood, N.N. and Ernshaw, A., 2005. Chemistry of the elements. Elsevier, Amsterdam, The Netherlands. 1342pp. Hashimoto, S., Azuma, T. and Otsuki, A., 1998. Distribution,
sources, and stability of haloacetic acids in Tokyo Bay, Japan. Environ. Toxic. Chem., 17, 798805.
Hill, T. and Neal, C., 1997. Spatial and temporal variation in pH, alkalinity and conductivity in surface runoff and groundwater for the Upper River Severn catchment. Hydrol. Earth Syst. Sci.,
1, 697716.
Huggenberger, P., Hoehn, E., Beschta, R. and Woessner, W., 1998. Abiotic aspects of channels and flood plains in riparian ecology. Freshwater Biol., 40, 407425.
Fig. 7. The relationship of flow with DLBr, bromide and DOC
Hughes, S., Reynolds, B. and Hudson, J., 1996. Release of bromide following rewetting of a naturally drained acid gully mire. Soil Use Manage., 12, 6266.
Hughes, S., Reynolds, B., Brittain, S.A., Hudson, J.A. and Freeman, C., 1998. Temporal trends in bromide release following rewetting of a naturally drained gully mire. Soil Use Manage., 14, 248250.
Kirchner, J.W., Feng, X. and Neal, C., 2000. Fractal stream chemistry and its implications for contaminant transport in catchments. Nature, 403, 524527.
Kirchner, J.W., Feng, X. and Neal, C., 2001. Catchment-scale advection and dispersion as a mechanism for fractal scaling in stream tracer concentrations. J. Hydrol., 254, 81100. Korom, S.F., 2000. An adsorption isotherm for bromide. Water
Resour. Res., 36, 19691974.
Laturnus, F., Giese, B., Wiencke, C. and Adams, F.C., 2000. Low-molecular-weight organoiodine and organobromine compounds released by polar macroalgae the influence of abiotic factors. Fresenius J. Anal. Chem., 368, 297302.
Manninen, P.K.G. and Hasanen, E., 1992. Total organochlorine and organobromine in Finnish water courses. Hydrobiologia,
234, 475479.
Marc, V. and Robinson, M., 2007. Assessing the long-term water balance of upland grassland and forestry. Hydrol. Earth Syst. Sci., 11, 4460.
Moxon, R.E.D. and Dixon, E.J., 1980. An automatic method for the determination of bromide in water. J. Automat. Chem., 2, 139142.
Neal, C. and Kirchner, J.W., 2000. Sodium and chloride levels in rainfall, mist, streamwater and groundwater at the Plynlimon catchments, mid-Wales: inferences on hydrological and chemical controls. Hydrol. Earth Syst. Sci., 4, 295310. Neal, C., and Robson, A.J., 2000. A summary of river water quality
data collected within the Land Ocean Interaction Study: core data for Eastern UK rivers draining to the North Sea. Sci. Total Envir., 251/252, 587668.
Neal, C., Smith, C.J., Walls, J., Billingham, P., Hill, S. and Neal, M., 1990. Comments on the hydrochemical regulation of the halogen elements in rainfall, stemflow, throughfall and stream waters at an acidic forested area in Mid-Wales. Sci. Total Envir.,
91, 111.
Neal, C., Fisher, R., Smith, C.J., Hill, S., Neal, M., Conway, T., Ryland, G.P. and Jeffery, H.A., 1992. The effects of tree harvesting on stream water quality at an acidic and acid sensitive spruce forested area: Plynlimon, Mid-Wales. J. Hydrol., 135, 305319.
Neal, C., Wilkinson, R.J., Neal, M., Harrow, M.L., Wickham, H., Hill, L. and Morfitt, C., 1997a. The hydrochemistry of the headwaters of the River Severn, Plynlimon, Wales. Hydrol. Earth Syst. Sci., 1, 583618.
Neal, C., Robson, A.J., Shand, P., Edmunds, W.M., Dixon, A.J., Buckley, D.K., Hill, S. Harrow, M.L., Neal, M. and Reynolds, B., 1997b. The occurrence of groundwater in the Lower Palaeozoic rocks of upland Central Wales. Hydrol. Earth Syst. Sci., 1, 318.
Neal, C., Hill, T., Hill, S. and Reynolds, B., 1997c. Acid neutralization capacity measurements in surface and ground waters in the Upper River Severn, Plynlimon: from hydrograph splitting to water flow pathways. Hydrol. Earth Syst. Sci., 1, 687696.
Neal, C., Robson, A.J. and Christophersen, N., 1997d. Towards coupling hydrological, soil and weathering processes within a modelling perspective. In: Geochemical Processes, Weathering and Groundwater Recharge in Catchments, O.M. Saether and P. de Caritat (Eds.), Balkema, Rotterdam. 329380.
Neal, C., Reynolds, B., Neal, M., Pugh, B. and Wickham, H., 2001. Long term changes in the water quality of rainfall, cloud-water and stream cloud-water for moorland, forested and clear-felled catchments at Plynlimon. Hydrol. Earth Syst. Sci., 5, 459476. Neal, C., Robson, A.J., Neal, M., and Reynolds, B., 2005. Dissolved organic carbon for upland acidic and acid sensitive catchments in mid-Wales. J. Hydrol., 304, 203220.
Neal, M., Neal, C., Wickham, H. and Harman, S., 2007. Determination of bromide, chloride, fluoride, nitrate and sulphate by ion chromatography: comparisons of methodologies for rainfall, cloud water and river waters at the Plynlimon catchments of mid-Wales. Hydrol. Earth Syst. Sci., 11, 294 300.
Nikolaou, A.D., Golfinopoulos, S.K., Arhonditsis, G.B., Kolovoyiannis, V. and Lekkas, T.D., 2004. Modelling the formation of chlorination by-products in river waters with different quality. Chemosphere, 55, 409420.
Quack, B. and Wallace, D.W.R., 2003. Air-sea flux of bromoform: controls, rates, and implications. Global Biogeochem.Cycle.,
17, 1023.
Rathburn, R.E., 1996. Bromine incorporation factors for trihalomethane formation for the Mississippi, Missouri and Ohio Rivers. Sci. Total Envir., 192, 111118.
Reynolds, B., Neal, C. Hornung, M. and Stevens, P.A., 1986. Baseflow buffering of streamwater acidity in five mid-Wales catchments. J. Hydrol., 87, 167185.
Reynolds, B., Hornung, M. and Hughes, S., 1989. Chemistry of streams draining grassland and forest catchments at Plynlimon, mid-Wales. Hydrolog. Sci. J., 34, 667686.
Rook, J.J., 1974. Formation of haloforms during chlorination of natural waters. Water Treatment Exam., 23, 234243. Santillo, D. and Johnson, P., 2003. Playing with fire: the global
threat presented by brominated flame retardants justifies urgent substitution. Environ. Int., 29, 725734.
Stuart, M.E., Gooddy, D.C., Kinniburgh, D.G. and Klinck, B.A., 2001. Trihalomethane formation potential: a tool for detecting non-specific organic groundwater contamination. Urban Water,
3, 173184.
Vinogradov, A.P., 1959. The geochemistry of rare and dispersed chemical elements in soils, 2nd edn. Consultants Bureau, New
York, USA.
Weigel, S., Bester, K. and Huhnerfuss, H., 2005. Identification and quantification of pesticides, industrial chemicals and organobromine compounds of medium to high polarity in the North Sea. Mar. Pollut. Bull., 50, 252263.
Westerhoff, P., Song, R.G., Amy, G. and Minear, R., 1998. NOMs role in bromine and bromate formation during ozonation. J. Amer. Water Works Ass., 19, 8294.
Wilkins, C., 1978. The distribution of Br in the soils and herbage of north-west Pembrokeshire. J. Agr. Sci., 90, 109114. Wilkinson, R.J., Reynolds, B., Neal, C., Hill, S., Neal, M. and
Harrow, M.L., 1997. Major, minor and trace element composition of cloud water and rain water at Plynlimon, Mid-Wales. Hydrol. Earth Syst. Sci., 1, 557570.
Yuita, K., Tanaka, T., Abe, C. and Aso, S., 1991. Dynamics of iodine, bromine and chlorine in soil.1. Effect of moisture, temperature, and pH on the dissolution of the triad from soil. Soil Sci. Plant Nutr., 37, 6163.