HAL Id: hal-00304626
https://hal.archives-ouvertes.fr/hal-00304626
Submitted on 1 Jan 2001HAL is a multi-disciplinary open access archive for the deposit and dissemination of sci-entific research documents, whether they are pub-lished or not. The documents may come from teaching and research institutions in France or abroad, or from public or private research centers.
L’archive ouverte pluridisciplinaire HAL, est destinée au dépôt et à la diffusion de documents scientifiques de niveau recherche, publiés ou non, émanant des établissements d’enseignement et de recherche français ou étrangers, des laboratoires publics ou privés.
water and stream water for moorland, forested and
clear-felled catchments at Plynlimon, mid-Wales
C. Neal, B. Reynolds, M. Neal, B. Pugh, L. Hill, H. Wickham
To cite this version:
C. Neal, B. Reynolds, M. Neal, B. Pugh, L. Hill, et al.. Long-term changes in the water quality of rainfall, cloud water and stream water for moorland, forested and clear-felled catchments at Plynlimon, mid-Wales. Hydrology and Earth System Sciences Discussions, European Geosciences Union, 2001, 5 (3), pp.459-476. �hal-00304626�
Long-term changes in the water quality of rainfall, cloud water
and stream water for moorland, forested and clear-felled
catchments at Plynlimon, mid-Wales
C. Neal
1, B. Reynolds
2, M. Neal
1, B. Pugh
2, L. Hill
1and H. Wickham
11 Centre for Ecology and Hydrology, Wallingford, Oxon, OX10 8BB, UK 2 Centre for Ecology and Hydrology, Bangor, Gwynedd, LL57 2UP, UK
Email for corresponding author: [email protected]
Abstract
Long term changes in the water quality of rainfall, cloud water and stream waters draining acidic and acid sensitive moorland and forested catchments at Plynlimon, mid-Wales, are examined for the period 1983 to 2001. Atmospheric inputs of chloride and sulphate are influenced by the relative inputs of clean maritime and polluted land based air masses. There is no systematic increase or decrease over time for chloride and non-sea-salt sulphate. Rather, there is a decadal scale process possibly representative of the influence of the North Atlantic Oscillation that affects the maritime and pollution climate of the Atlantic seaboard of the UK. Over 17 years of study, there may be a small decrease in non-sea-salt sulphate of about 10 µeq l-1 and a small improvement in acid neutralising capacity of about 20 to 30 ìeq l-1 in rainfall. There is a
clear improvement in cloud water chemistry with respect to pollutant components (ammonium, nitrate, non-sea-salt sulphate) and acidity (acid neutralising capacity improved by about 300 µeq l-1) through the study period. Many of the changes in cloud water chemistry are similar
to rainfall over the same period except the magnitude of change is larger for the cloud water. Within the streams, there is some evidence for reductions in acidity as reflected by acid neutralising capacity becoming less negative. For one stream, deforestation occurred during the sampling period and this led to large increases in nitrate and smaller increases in aluminium midway through the study period. However, the climate and hydrological variability largely masked out other changes. The current analysis provides only a start to identifying trends for such a complex and variable environmental system. The need for strong statistical tools is emphasised to resolve issues of: (a) hydrological induced water quality variability, (b) changing soil and groundwater “endmember” chemistry contribution to the stream and (c) the non-linear patterns of change. Nonetheless, the analysis is enhanced by examining trends in chemistry for yearly averages and yearly average low catch and high catch rainfall and cloud water events as well as low and high flow stream chemistry. This approach allows trends to be examined within the context of endmember mixing.
Keywords: Calcium, aluminium, ammonium, pH, Gran alkalinity, ANC, nitrate, chloride, sulphate, Plynlimon, cloud, mist, rainfall, stream,
acidification, North Atlantic Oscillation, trends
Introduction
Acidification of the acidic and acid sensitive areas of the UK in association with atmospheric deposition of pollutants from industry (SOx and NOx), farming (NH3) and vehicles (NOx) has been of considerable environmental and management concern for the last 20 years or more (UKAWRG, 1988). This acidification is accentuated by forests which enhance the capture of acidic oxides and which incorporate base cations into the growing biomass thereby increasing the acidity of the soil and the stream (Jenkins et
al., 1990). In the case of forestry, particular concerns relate
to conifer plantation forestry that was a major development
during the first half of the last century. Such concerns have been accentuated by the plantations nearing maturity or being harvested; during harvesting, perturbation of the system can also lead to nitrate (NO3)releases over a few years’ time-span. These releases can lead to release of more acidic and aluminium (Al) bearing waters (Neal et al., 1992a,b; Neal and Reynolds, 1998). Currently, there are major issues regarding the effectiveness of reductions in the emissions of acidic oxides following the 1970s environmental legislation requiring reduction in soil and stream acidity and Al concentrations (Evans et al., 1998, 2001; Ferrier et al., 2001). Further, there is a need to clarify
the role of conifer plantation policy with regards to the acidification process itself and the influence that forestry will have in affecting improvements in soil and surface water acidity associated with the emissions reductions (Neal and Reynolds, 1998).
In this paper, changes in rainfall, cloud water and stream water chemistry data are examined from a major long-term programme of measurements in acidic and acid sensitive moorland, conifer plantation/harvested catchments in mid-Wales. The object of this exercise is to address two issues: has stream water quality improved over the last 17 years; does conifer harvesting perturb acidification trends associated with emissions changes? The catchments used provide one of the longest and most detailed records for water quality in the UK (Neal et al., 1997a) and are perhaps the most actively researched with regards to hydrology, sedimentology and hydrochemistry (Neal, 1997, 2000).
Study area
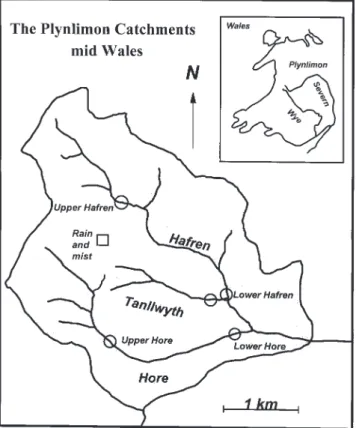
The study relates to two main tributaries of the upper River Severn, the Afon Hafren and the Afon Hore, that drain the moorland areas of the plateau top and forested southeastern slopes of Pumlumon Fawr in mid-Wales (Fig. 1). The bedrock geology comprises lower Palaeozoic mudstones,
greywackes and sandstones that are overlain by thin (typically 70 cm thick) acidic soils comprised mainly of peaty podzols with some deep peats, brown earths and gleys. On the upper parts of the Hafren and Hore catchments, vegetation is dominated by acid grassland and acid heath land. The Hafren Forest, comprising plantation forestry (mainly Sitka spruce Picea sitchensis), introduced in various phases between 1937 and 1964, dominates the lower parts of these catchments. Apart from minor thinning, the standing forest within the Afon Hafren catchment remained intact during the first 8 to 10 years of the study, although in recent years the forest has been progressively harvested. Within the lower half of the Hore catchment, however, the standing crop was clear felled in one operation between spring 1985 and autumn 1989 leaving extensive brash piles and tree stumps to decompose in situ. The slopes were replanted with Sitka spruce seedlings (< 0.3 m high) within two years of felling. The short harvesting timescale employed in the lower Hore cannot be considered as standard forestry practice but was an experimental treatment requested by the Forestry Commission to determine the maximum effects of felling on water resources, sediment transport and water quality (Kirby et al., 1991).
The altitude range for the upper Severn (from its source to the confluence of the Hafren and the Hore) is about 740 to 330 m.a.s.l. Rainfall averages about 2500 mm yr-1 for the two catchments and evaporation losses (canopy/soil evaporation plus transpiration) are typically between 500 and 800 mm yr-1 (Hudson et al., 1997). Evaporation rates vary from year to year and the moorland parts of the catchment have lower evaporation losses (Hudson et al., 1997). The stream flow response to rainfall is rapid and there is a strong “spiky pattern” to the hydrograph. Being adjacent to each other, the hydrograph responses are very similar with flows varying typically between 0.01 and 4.5 m3s-1 (Kirby et al., 1991).
Site locations, sampling
methodologies and chemical analysis
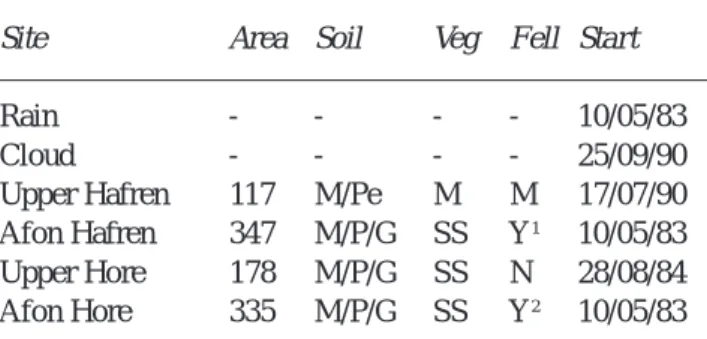
Details of the main sampling sites are as follows with a summary of the key features provided in Table 1.
z Rainfall. This has been collected weekly at two sites since May 1983 using continuously open plastic gauges draining into high-density polythene bottles. The sites span the altitudinal range for the catchments and samples are bulked for chemical analysis. Rainfall quantity was taken from detailed hydrometric records (Hudson et al., 1997). The integrity of the plastic collectors for sampling dissolved organic carbon (DOC)
Table 1. Catchment summary information. Veg = vegetation
type, Fell = felling, M = moorland, P = peat, G = gley, SS = Sitka spruce, N = no, Y =yes, c= = continuing. 1 = ongoing thinning with a total thinning of <25%, 2 = clear felling March 1985 to October 1989.
Site Area Soil Veg Fell Start
Rain - - - - 10/05/83
Cloud - - - - 25/09/90
Upper Hafren 117 M/Pe M M 17/07/90 Afon Hafren 347 M/P/G SS Y1 10/05/83 Upper Hore 178 M/P/G SS N 28/08/84 Afon Hore 335 M/P/G SS Y2 10/05/83
in rainfall was checked over a period of 35 weeks by comparing weekly samples with those from stainless steel collectors draining into glass bottles. There were no significant differences between the DOC concentrations measured in samples from the two types of collector.
z Cloud water. Cloud water has been collected weekly since September 1990. The collector is located near the top of the catchment (approximate altitude 585 m) using a passive lidded “harp type” system (Milne et al., 1988). Cloud water volumes were determined to estimate the weekly deposition on a relative basis (exact deposition could not be estimated as this will depend upon catch efficiency, wind speed, etc). Although passive cloud water collectors are prone to ‘contamination’ by rainfall at wind speeds greater than about 5 m s-1, they provide a useful qualitative estimate of cloud water chemistry.
z Upper Hafren. The chemistry of the Afon Hafren draining the moorland part of the catchment was determined from weekly grab samples collected approximately 200 m upstream of the forest edge. Sampling began in August 1990. There is no flow-gauging site at this point and for an assessment of flow relationships, data from the flow-gauging site on the lower part of the Hafren was used. Clearly, the volumes of water will be much greater lower down the catchment, although for the present study, flows have been expressed in terms of run-off in units of mm 15 min-1 and this will, to a large degree, compensate for areal differences.
z Afon Hafren. Grab samples have been collected weekly since May 1983 at the lower point of the Afon Hafren, just upstream of the confluence with the Hore and the Hafren flow-gauging flume. Flow measurements were made using “dip level” readings at the time of sampling and flume calibration relationships.
z Upper Hore. Originally, the Afon Hafren was to provide a control for the Hore clear felling experiment. Early on in the work, however, it was discovered that the Hore catchment had a greater calcium carbonate (CaCO3) content in the bedrock than the Hafren (Reynolds et al., 1986). Calcium carbonate is easily weatherable and hence the stream run-off for the Hore has higher pH, Gran alkalinity, acid neutralising capacity (ANC) and calcium (Ca) levels than the Hafren. Because of this, a site on the Hore upstream of the felled area was chosen as a control (Neal et al., 1992a,b). Grab samples have been collected weekly at this site, just upstream of a flow-gauging flume, since August 1984. The site is located about half way between the Afon Hore monitoring point and the source of the Hore. Flow measurements were made using “dip level” readings at the time of sampling and flume calibration relationships.
z Afon Hore. Weekly grab samples have been collected since August 1984 from a site just upstream of the Hore flow gauging flume and the confluence with the Afon Hafren. Flow measurements were made using “dip level” readings at the time of sampling and flume calibration relationships.
The stream samples were filtered in the field whilst rainfall and cloud water samples were filtered on return to the nearby field laboratory. Filtration for major cations, anions and trace metals was undertaken using 0.45 µM membrane filters whilst GF/F filters were used for samples analysed for DOC. Chemical analysis techniques have been described previously (Neal et al., 1997a) and only brief reference is made here. On the day of collection, pH, conductivity and Gran alkalinity were determined electrometrically. In the case of Gran alkalinity, measurements were made by acidimetric titration in the pH range 4.5 to 4.0 (Neal et al., 1999; Neal, 2001). The filtered samples were then stored in appropriate bottles (glass and polypropylene) at 4oC prior to further analysis. Subsequent analysis involved a variety of colorimetric, thermal decomposition and inductively coupled optical-emission and mass spectrometric techniques.
THE WATER QUALITY OF THE PLYNLIMON CATCHMENTS: EARLIER FINDINGS AND CHOICE OF DETERMINANDS FOR CURRENT ANALYSIS Before proceeding with an analysis of the data, it is of relevance to describe the general water quality of the Plynlimon catchments based on the extensive information already published. This will explain the choice of determinands examined here (over 30 determinands are
regularly monitored: for practical reasons and to maintain focus, only a key subset has been chosen).
General water quality variations in rainfall, cloud water and stream waters at Plynlimon
Atmospheric deposition at Plynlimon comprises three components: rainfall, cloud water and dry/gaseous inputs (Wilkinson et al., 1997; Reynolds et al., 1997). The chemical composition of the inputs varies over time and the relative variations represent two distinct types of situation:
z Air masses which have passed over the Atlantic Ocean. These air masses contain spray from the sea-surface. Such sea-spray is enriched in the “sea-salts”, sodium (Na), chloride (Cl), magnesium (Mg), strontium (Sr) and bromide (Br) and, hence, these components can enter the catchment as rain, mist and aerosols. All these ions are linearly correlated both in rainfall and in cloud water.
z Air masses which have passed over the UK mainland. These air masses are enriched in pollutant components from industrial, urban and agricultural emission sources. Thus, rainfall and cloud water are enriched in acidity, Ca, potassium (K), ammonium (NH4), heavy metals and nutrients and these determinands are highly correlated although there are at least three types of pollution input that affect the strength of the correlations (Wilkinson et al., 1997). An important factor in the deposition of pollutants in the uplands is the role of seeder-feeder scavenging which enhances pollutant deposition to upland areas such as Plynlimon (RGAR, 1997). In this process, relatively clean ‘seeder’ rain falling from above washes out ‘feeder’ hill cloud water droplets containing much higher concentrations of pollutants. The larger concentrations in hill cloud result from the advection of aerosols containing sulphate (SO4), NO3 and ammonium (NH4) into cloud droplets formed as the air cools on rising over the hills. The cloud droplets containing the pollutants are much larger (5 to 15 ìm) and more efficiently scavenged than the aerosols upwind of the hills that are too small (< 1 mm) to be washed out of the boundary layer by rainfall. Direct deposition of hill cloud also enhances inputs to upland areas (Dollard et al., 1983), particularly when these are covered by tall vegetation such as conifer forests (Gallagher et al., 1992). Direct deposition of gaseous NOx and SOx is relatively unimportant at Plynlimon as ambient air concentrations are very low. In the absence of point source emissions (e.g. animal and poultry
houses) and because of the low intensity of agricultural activity, deposition of ammonia (NH3) is much less certain although air concentrations are low (RGAR, 1997)
Due to the highly variable nature of the weather and the changing air mass trajectories, the chemical composition of rain and cloud water varies substantially over a range of timescales.
Rainfall primarily displaces stored water within the catchments during rainfall events as shown by the marked contrast between rainfall and stream water chemistry for Cl, a chemically conservative element: Cl shows high variability within the rainfall whereas the chemical signal in the stream is almost completely damped out (Neal et al., 1988; Neal and Kirchner, 2000). However, because of hydrological variations, large fluctuations in many chemical species occur in the stream and there is a great regularity in the changes in concentration and flow for many determinands. In particular, baseflow has higher Ca and silicon (Si) concentrations and alkalinities than stormflow, while stormflow waters have higher Al and transition metal concentrations as well as lower pH than their baseflow counterparts do. This difference reflects two contrasting hydrochemical “endmember” environments (Neal et al., 1997b,c) which can be considered conceptually as a two component-mixing scheme (Neal and Christophersen, 1989):
z The soil zone. There is an acidic soil endmember. The soil matrix is acidic, rich in organic matter and Al oxide/ hydroxide compounds but relatively depleted in divalent base cations. Thus, this zone produces base-poor, organic-rich, Al and transition metal bearing soil water of low pH, negative Gran alkalinity and negative ANC.
z Groundwater. This is the bedrock and shallow groundwater endmember. Its base rich and low acidity chemistry is determined by acid-soluble minerals that can dissolve and partly neutralise the acid soil waters causing the easily hydrolysable transition metals and Al to precipitate. Groundwater comprises a Ca bicarbonate water type of positive Gran alkalinity, positive ANC and it is carbon dioxide (CO2) enriched. On degassing, the groundwater has a pH close to that for the streams under baseflow conditions.
z A water-mixing zone. Under baseflow conditions, water drains mainly from the riparian zone and shallow groundwater areas while under stormflow conditions, a far greater proportion of the water comes from the soil. Ground and soil water components mix both within the catchment as fracture flow as well as within the streams.
Variations in the soil and bedrock composition induce differences in the soil and groundwater endmembers and this leads to variations in the high flow and low flow compositions of the stream. For example, the presence of calcite and lead/zinc sulphides in the Hore catchment leads to higher Ca concentrations and measurable lead (Pb) and zinc (Zn) concentrations in the Afon Hore compared to the Afon Hafren, the greatest difference being observed in the stream under low flow conditions (Reynolds et al., 1986). Superimposed on this behaviour are three other patterns (Robson and Neal, 1996; Neal et al., 1997a).
z Seasonal patterns are observed for the nutrients as their concentrations are linked primarily to the biological functioning of the catchment. The nutrients of concern are primarily NO3, Br, iodine (I) and boron (B); phosphorus (P) is usually below the detection limit and the biological productivity of streams will be limited with respect to this component. The seasonal patterns are not always very regular as there may be occasional extended dry periods or periods of temperature extremes where the catchment is perturbed to release NO3 and SO4.
z There are decadal term patterns for components such as the sea-salts, SO4 and heavy metals such as Zn that are probably linked to changing atmospheric loadings as influenced by changing weather patterns.
z Short to medium term changes occur in stream water nutrient concentrations associated with forest harvesting. This initially results in reduced nutrient uptake as growing biomass is removed and enhanced decomposition processes leading to releases to the stream for between one and about five years.
Determinand choice
For reasons outlined below, ten determinands have been chosen for analysis within this paper.
z Calcium. This is a key component of weathering. High Ca concentrations in the stream represent a strong groundwater component. However, one effect of acidification is to change the exchangeable cation fraction within the soil which in turn affects the flux of Ca to the stream and hence its concentration (Cosby et
al., 1996). Trends in Ca are examined to see if a change
in concentration is discernable.
z Aluminium. This is a key component released to the stream on acidification and is one of the main reasons why acidification causes ecological damage in the stream (Ormerod and Wade, 1990; Milner and Varallo, 1990). Reductions in soil acidity (i.e. increasing pH)
inhibit release of Al from the soil matrix and/or precipitate Al in the soil solution, which, in turn, leads to reduced Al concentrations in the stream (Cosby et
al., 1996).
z Ammonium. This is a key acidification input. Within the soil and groundwater zone as well as the stream, NH4 may be converted to NO3 and this leads to the generation of hydrogen (H) ions. However, upland forest soils also have the capacity to immobilise NH4 via uptake into the soil microbial biomass, by cation exchange and/or by fixation on to minerals in the subsoil with no net change in the proton balance (Aber et al., 1983; Fernandez and Rustad, 1990; Christ et al., 1995).
z PH, Gran alkalinity and ANC. These are the direct measures of the acidity of the stream. pH is equated to the H ion concentration/activity ([H+] = 10-pH). Gran alkalinity provides a measure of the difference between the concentrations of bicarbonate (plus, in part, organic anions) and H ions in the stream. ANC is a measure of the difference between the dissolved strong base cations (Na, K, Mg and Ca) and the dissolved strong acid anions (Cl, SO4 and NO3). It is also a measure of the difference between the dissolved weak acid anions (bicarbonate plus organic anions) and the dissolved weak base cations (NH4 and Al species). The two terms Gran alkalinity and ANC are closely related and they are presented in units of µeq l-1. A positive Gran alkalinity and a positive ANC both correspond to conditions considered healthy to aquatic biota in the stream while acid stress occurs when low or negative values are encountered (Lein et
al., 1992). Gran alkalinity and ANC are used to explore
groundwater and soil water-mixing relationships (Neal and Christophersen, 1989; Neal et al., 1997b).
z Nitrate. This is a key acidification input, taking part in many biological reactions (e.g. release of NO3 with felling can lead potentially to soil and stream acidification).
z Chloride. This represents the marine input from the atmosphere and a measure of water storage in the catchment as manifest by the degree to which the rainfall signal is damped by the time it has passed through the catchment to the stream (Neal et al., 1988; Neal and Kirchner, 2000).
z Sulphate and non-sea-salt sulphate. These represent major anion inputs from the atmosphere both in terms of marine and pollutant sources. The non-sea-salt component (essentially the pollutant fraction as weathering sources within the catchment are small plus marine biogenic S input) is calculated as the difference between the total SO4 measured and the sea-salt SO4 component (determined as the product of the Cl
concentration in the water and the ratio of SO4 to Cl in seawater). Non-sea-salt SO4 may be equated with the commonly used term “non-marine SO4” when the marine biogenic S is small. For the present study, we stick to the use of the more accurate term “non-sea-salt SO4”.
z Dissolved organic carbon. This is a measure of the dissolved organic molecules within the water. DOC represents a mixture of humic and fulvic acids which provide “weak anions” to the water and, like bicarbonate ions, they partly buffer the stream acidity.
Results
With a presentation of information on 10 determinands plus flow records for six sites, simplification of the results section is essential. As mentioned earlier, there is large variation in the data and this is related for many determinands to flow/ volume of catch. For example, solute concentrations in rainfalls will be strongly linked to the “washout” of chemicals from the atmosphere and this washout effect will be diluted out, in terms of concentration, as the volume of catch increases for a given storm event (Cryer, 1986). Correspondingly, within the streams, contrasting chemistry will be observed between low- and high-flows for many determinands of concern here due to the changing contribution of ground and soil water inputs as described above (Tables 2a,b; Fig. 2a). Hence, within the analysis, the data are examined not only in terms of average patterns and data scatter but also in terms of low-catch/baseflow and high-catch/stormflow concentrations to describe endmember chemistries and their temporal variations. In the process, much of the data scatter is resolved into a more manageable level. For the analysis, “catch” refers to the rainfall and cloud water information where integrated samples are taken over a week. Thus, “low” and “high” refer to small and large volumes of catch over the week in the case of rainfall and cloud water. For the streams, instantaneous flow data are used and hence baseflow and stormflow are referred to in terms of low flow and high flow, respectively (as opposed to “catch” for rainfall and cloud water). Two types of analysis are performed to describe broadly the water quality of the Plynlimon catchments:
z A statistical summary is provided in terms of arithmetic average, minimum and maximum concentrations for each determinand together with low-and high-catch/flow concentrations in rainfall, cloud water and the four streams, for the full record of sampling (Table 1). For the low- and high-catch/flow concentrations, the data were sorted in rank of increasing
catch/flow and average concentrations for the bottom 10% and the top 10% of the dataset was determined.
z Time series plots are given for the full dataset and for yearly average and yearly low- and high-catch/flow concentrations to show the scatter and trends in data for each determinand. For the study a hydrological year, from the beginning of March to the end of February the following year was used rather than a calendar year so as to cover the full storm periods for each winter season. In the case of the low- and high-catch/flow values, the average concentrations for samples corresponding to the bottom five and the top five flows were determined for each hydrological year. By doing this, it was hoped that the distorting influence of particularly dry and particularly wet years would be minimised. Thus, while different years would have different distributions of flow, the low and high flow chemistries would still be expected to be similar. By choosing the same number of low- and high-catch/flow events and averaging the
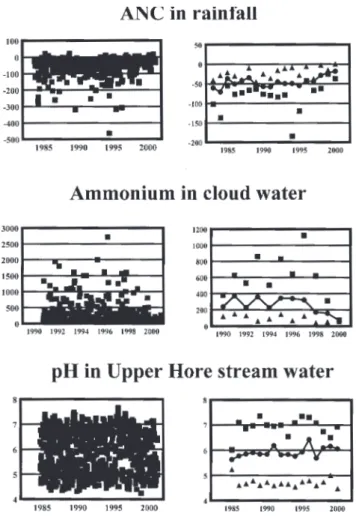
Fig. 2a. An illustration of the data scatter and averaging
methodologies for ANC in rainfall, NH4 in cloud water and pH in the upper Hore. Concentrations are in µeq l-1 except pH which is
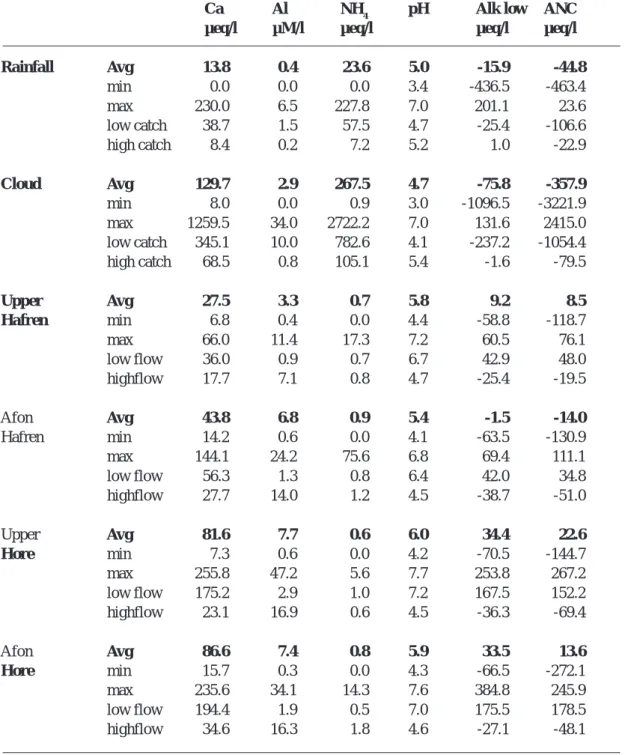
Table 2a. Water quality statistics for rainfall, cloud water and stream waters at Plynlimon, mid Wales.
For rainfall and cloud water, the data refer to weekly catches. For stream waters, instantaneous grab samples were used.
Ca Al NH4 pH Alk low ANC
µeq/l µM/l µeq/l µeq/l µeq/l
Rainfall Avg 13.8 0.4 23.6 5.0 -15.9 -44.8 min 0.0 0.0 0.0 3.4 -436.5 -463.4 max 230.0 6.5 227.8 7.0 201.1 23.6 low catch 38.7 1.5 57.5 4.7 -25.4 -106.6 high catch 8.4 0.2 7.2 5.2 1.0 -22.9 Cloud Avg 129.7 2.9 267.5 4.7 -75.8 -357.9 min 8.0 0.0 0.9 3.0 -1096.5 -3221.9 max 1259.5 34.0 2722.2 7.0 131.6 2415.0 low catch 345.1 10.0 782.6 4.1 -237.2 -1054.4 high catch 68.5 0.8 105.1 5.4 -1.6 -79.5 Upper Avg 27.5 3.3 0.7 5.8 9.2 8.5 Hafren min 6.8 0.4 0.0 4.4 -58.8 -118.7 max 66.0 11.4 17.3 7.2 60.5 76.1 low flow 36.0 0.9 0.7 6.7 42.9 48.0 highflow 17.7 7.1 0.8 4.7 -25.4 -19.5 Afon Avg 43.8 6.8 0.9 5.4 -1.5 -14.0 Hafren min 14.2 0.6 0.0 4.1 -63.5 -130.9 max 144.1 24.2 75.6 6.8 69.4 111.1 low flow 56.3 1.3 0.8 6.4 42.0 34.8 highflow 27.7 14.0 1.2 4.5 -38.7 -51.0 Upper Avg 81.6 7.7 0.6 6.0 34.4 22.6 Hore min 7.3 0.6 0.0 4.2 -70.5 -144.7 max 255.8 47.2 5.6 7.7 253.8 267.2 low flow 175.2 2.9 1.0 7.2 167.5 152.2 highflow 23.1 16.9 0.6 4.5 -36.3 -69.4 Afon Avg 86.6 7.4 0.8 5.9 33.5 13.6 Hore min 15.7 0.3 0.0 4.3 -66.5 -272.1 max 235.6 34.1 14.3 7.6 384.8 245.9 low flow 194.4 1.9 0.5 7.0 175.5 178.5 highflow 34.6 16.3 1.8 4.6 -27.1 -48.1
data for each year, a uniform series is presented which also overcomes the problem of flow-skewed data over time. One of the main advantages of the approach is that the temporal changes in “groundwater” and “soil water” endmembers can be examined for long-term trend. For the present paper, it is impractical to show
all the graphs obtained by this approach. Figure 2a illustrates the extent of scatter and the value of examining the data in terms of yearly values for low-and high-catch/flow low-and averages. Figure 2b illustrates that with increasing catch/flow, there is a marked change in scatter to the data. At low-catch/flows, small changes
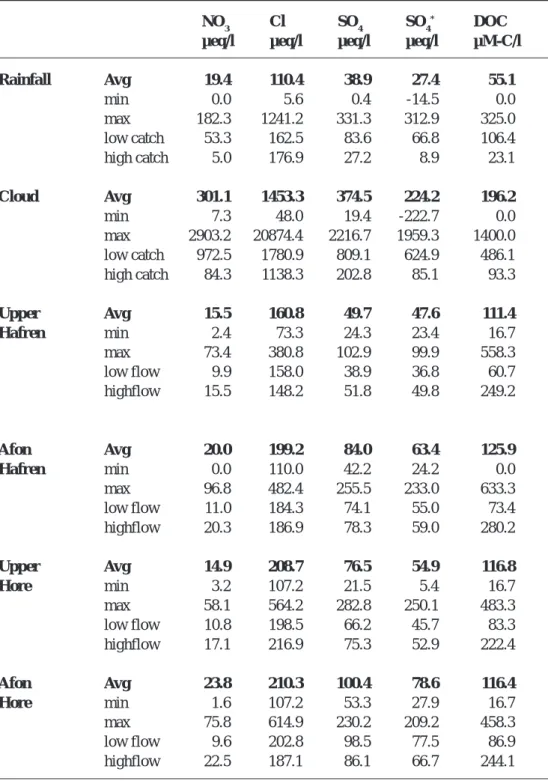
Table 2b. Water quality statistics for rainfall, cloud water and stream waters at Plynlimon,
mid Wales. Non marine SO4 denotes the non-sea-salt component of the SO4 concentration. For rainfall and cloud water, the data refer to weekly catches. For stream waters, instantaneous grab samples were used.
NO3 Cl SO4 SO4* DOC
µeq/l µeq/l µeq/l µeq/l µM-C/l
Rainfall Avg 19.4 110.4 38.9 27.4 55.1 min 0.0 5.6 0.4 -14.5 0.0 max 182.3 1241.2 331.3 312.9 325.0 low catch 53.3 162.5 83.6 66.8 106.4 high catch 5.0 176.9 27.2 8.9 23.1 Cloud Avg 301.1 1453.3 374.5 224.2 196.2 min 7.3 48.0 19.4 -222.7 0.0 max 2903.2 20874.4 2216.7 1959.3 1400.0 low catch 972.5 1780.9 809.1 624.9 486.1 high catch 84.3 1138.3 202.8 85.1 93.3 Upper Avg 15.5 160.8 49.7 47.6 111.4 Hafren min 2.4 73.3 24.3 23.4 16.7 max 73.4 380.8 102.9 99.9 558.3 low flow 9.9 158.0 38.9 36.8 60.7 highflow 15.5 148.2 51.8 49.8 249.2 Afon Avg 20.0 199.2 84.0 63.4 125.9 Hafren min 0.0 110.0 42.2 24.2 0.0 max 96.8 482.4 255.5 233.0 633.3 low flow 11.0 184.3 74.1 55.0 73.4 highflow 20.3 186.9 78.3 59.0 280.2 Upper Avg 14.9 208.7 76.5 54.9 116.8 Hore min 3.2 107.2 21.5 5.4 16.7 max 58.1 564.2 282.8 250.1 483.3 low flow 10.8 198.5 66.2 45.7 83.3 highflow 17.1 216.9 75.3 52.9 222.4 Afon Avg 23.8 210.3 100.4 78.6 116.4 Hore min 1.6 107.2 53.3 27.9 16.7 max 75.8 614.9 230.2 209.2 458.3 low flow 9.6 202.8 98.5 77.5 86.9 highflow 22.5 187.1 86.1 66.7 244.1
in catch/flow can result in large changes in concentrations. At high-catch/flow, however, the concentrations “flatten off” and data scatter is much reduced. As shown later in the paper, the year to year
patterns of change are much more variable at low-catch/ flow compared to average and high-catch/flow: this is due to this difference in the concentration to catch/flow response.
The results are presented separately in terms of rainfall, cloud water and stream water chemistry.
RAINFALL
Plynlimon rainfall is of variable chemistry (Tables 2a,b; Fig. 3) and is generally acidic with a average pH of around five and range 3.36 to 6.95. Because of this, Gran alkalinity and ANC values are predominantly negative. Of the major anions (Cl, SO4 and NO3), Cl predominates with a concentration on average of 110 µeq l-1 and this is followed by SO4 at 39 µeq l-1 and NO
3 at 19 µeq l
-1. For all three major anions, there is a high data scatter. In the case of SO4, on average 71% is present in non-sea-salt and essentially pollutant form. Isotope studies (McArdle et al., 1998) have shown that the marine biogenic contribution to S in rainfall in west Wales and the west coast of Eire is generally small (< 10%), although it can be as high as 40% in samples from marine air masses. Rainfall is also Ca, NH4 and DOC bearing with average concentrations of 14 µeq l-1, 24 µeq l-1 and 55µM-C l-1, respectively. Of these, about 85% of the Ca is of non-marine origin (pollutant plus terrestrial dust inputs) while the other two components are of almost 100%
non-marine, pollutant origin. Aluminium concentrations are low, averaging 0.42 µM l-1.
Within the data scatter for the various determinands, there are some clear “volumetric effects” between low- and high-catches (Fig. 3). Low high-catches of rainfall are particularly enriched in pollutants as would be expected from the low washout dilution effect. Furthermore, air laden in pollutants is often associated with anticyclonic conditions that produce small amounts of rain. For the low- versus high-catches, the concentrations of the pollutant components are Ca (39 versus 9 µeq l-1), Al (1.5 versus 0.2 µeq l-1), Al (57 versus 7µeq l-1), pH (4.7 versus 5.2 - a factor of almost 3 in terms of H ion concentration), Gran alkalinity (–25 versus 1µeq l-1), ANC (–107 versus –23 µeq l-1), NO 3 (53 versus 5 µeq l-1), non-sea-salt SO 4 (67 versus 9 µeq l -1) and DOC (106 versus 23 µM-C l-1).
In terms of trends, the clearest patterns of change are for low rainfall events where concentrations of pollutants increased between the start of the monitoring period in 1983 until about 1994 after which concentrations declined (Fig. 3). For example, low-volume NH4, NO3, non-sea-salt SO4
Fig. 2b. An illustration of the relationship between concentration
and catch/flow for ANC in rainfall, NH4 in cloud water and Ca in
upper Hore stream water. All concentrations are in µeq l-1 units.
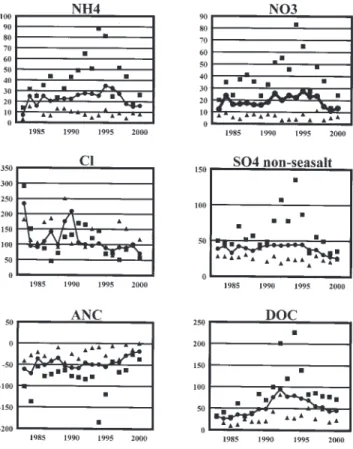
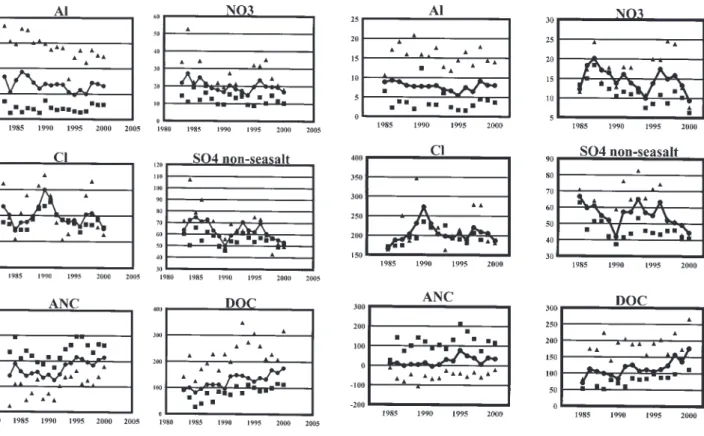
Fig. 3. Ammonium, NO3, Cl, non-sea-salt SO4, ANC and DOC in
rainfall: a time series. The solid line represents the average value for each year while the squares and triangle represent low and high catches, respectively. All concentrations are in µeq l-1 except DOC
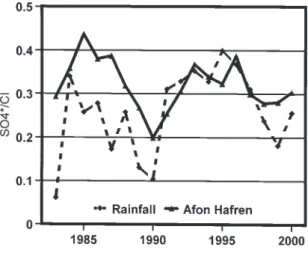
and DOC gradually increased from about 10 to 85 µeq l-1, 20 to 70 µeq l-1, 50 to 150 meq 1-1 and 20 to 150 µM-C l-1, respectively, and then gradually declined to about 20µeq l-1, 30 µeq l-1, 30 meq 1-1 and 80 µM-C l-1, respectively, by 2001. Calcium and Al showed a similar low-volume feature but with more “spiked” responses around 1993 of about 90 µeq l-1 (5 times background) and 2.5 µM l-1 (twice background), respectively. However, no obvious trend could be observed for pH, Gran alkalinity, ANC and Cl due to the high scatter to the data. For average and high flow values, the scatter is lower and, in most cases, there is no obvious pattern of change over time. The clearest pattern of change is for DOC at average and low volumes of catch where concentrations increase more or less uniformly during the first half to two thirds of the monitoring period of 1983 and 2001 and decline for the remaining time. For the DOC averages, concentrations increase from about 30 to 95 µM l-1 between 1983 and 1992 and then there is a slow decline in concentration thereafter to about 40 µM l-1 by 2001. Correspondingly, for low catches, DOC increases from about 40 to over 200 µM l-1 between 1983 and 1994 with a subsequent decline to about 80 µM l-1 by 2001. There may be a modest reduction in the acidity of the rainfall during the study period as observed particularly at high volumes of catch when pH and ANC increase by about 0.1 and 20 to 30 µeq l-1 over 17 years, respectively. The increase in pH may reflect small reductions in non-sea-salt SO4 and NO3. For Cl there are higher average concentrations for the first year of study (1983) and around 1990. Regarding the relative inputs from pollutant and marine air mass transfers, the ratio of non-sea-salt SO4/Cl in rainfall (Fig. 4) shows that the SO4*/Cl levels are on average lower during the first half of
the record and that maritime inputs were maximal during 1983, 1989–90 and 1999. Non-sea-salt SO4 is highest during the intervening years but the changes are small; average concentrations may show a small decline of about 10µeq l-1 over 17 years.
CLOUD WATER
Cloud water has by an order of magnitude or more, the highest Cl, NH4, NO3, SO4 and non-sea-salt SO4 concentrations of the waters sampled at Plynlimon (Tables 2a,b). Cloud water is also enriched in DOC and Ca, but to a lesser degree (a factor of two to five times) and the waters are the most acidic waters encountered with pH as low as 2.9, Gran alkalinity as low as –1096 µeq l-1 and ANC as low as –3222 µeq l-1. ANC is remarkably low and there is a major difference in Gran alkalinity due to the very high NH4 concentrations contributing to the weak cation component of the charge balance. The major anion present is Cl averaging 1453 µeq l-1, followed by NO
3 and non-sea-salt SO4 at 301 and 224 µeq l-1, respectively. For the pollutant components, Cl and SO4 are mainly present in cloud water in non-marine form (79% and 60%, respectively) and dominant (about 100%) for NO3, Al and DOC. As in rainfall, low-catch waters are highly enriched in pollutant components relative to their high-catch counterparts. Although not exclusively, the low-catch samples are likely to comprise cloud water samples relatively uncontaminated by rain water. The low versus the high-catch concentrations for the pollutant components are: Ca (345 versus 68µeq l-1), Al (10 versus 1 µM l-1), NH
4 (783 versus 105
µeq l-1), pH (4.1 versus 5.4 — a factor of about 16 in terms of H ion concentration), Gran alkalinity (-237 versus –2 µeq l-1), ANC (–1054 versus –79 µeq l-1), NO 3 (927 versus 84 µeq l-1), non-sea-salt SO 4 (625 versus 85 µeq l -1) and DOC (406 versus 93 µM-C l-1).
There are clear trends in the data over time for the low-catch samples with increases in concentration from the starting year of 1990 through to about 1995 and a subsequent decline thereafter up to 2001 (Fig. 5). For average and high-catch concentrations there seem to be clear tends:
z pH increases by about a 0.3 unit.
z Gran Alkalinity increases by about 70 µeq l-1 for the average catch and there is a much smaller increase for high-catch values (the first two lower values for the record may distort the pattern away from no significant change).
z ANC increases by about 300 µeq l-1 for the average concentration through the period with the major change occurring during the last three years of record when
Fig. 4. A time series of SO4*/Cl ratio (on a meq l-1/meq l-1 basis) in
NH4 in baseflow declines the most. There is a much smaller trend for the high-catch values and the first two lower data points for the record may distort the pattern away from no significant change.
z Sulphate and non-sea-salt sulphate concentrations have decreased by about 200 µeq l-1 for both determinands through the period (an approximate halving of concentrations) with a much smaller trend for high-catch concentrations.
z Chloride concentrations have approximately halved during the study period from about 200-300 and down to about 120 µeq l-1 in line with the rainfall trend over the same period of record.
The trends for ANC, SO4, non-sea-salt SO4 and Cl in cloud water are similar to those in rainfall, over the corresponding time period, except that they are much greater in size. STREAMWATERS
The streamwaters show a wide range in chemistry (Figs. 6 to 9) reflecting the differences between low- and high-flow within-catchment and atmospheric sources. The salient features are as follows.
Chloride, sulphate and non-sea-salt sulphate
concentrations show much lower fluctuations within the streams with respect to data scatter than the rainfall and cloud water and there is no marked separation between low-and high-flow values. This is expected as described above in relation to the low chemical reactivity of these components within the catchment and the physical dampening of the rainfall signal due to water storage. Chloride provides the dominant anion averaging around 200µeq l-1 with SO
4 and non-sea-salt SO4 concentrations averaging about 78 and 61 µeq l-1, respectively. About 78% of the SO4 is present in non-sea-salt form. For all three determinands, the lowest concentrations occur for the upper Hafren and this reflects differences in the scavenging of sea-salts and pollutants by moorland and forest vegetation (trees with their higher surface area, are more effective at scavenging mist and aerosols relative to shorter vegetation), as well as the larger evaporation losses from the trees.
With regards to trends, a similar pattern to rainfall is observed. For Cl there are higher average concentrations at the start of the record in 1983, around 1990 and, to a lesser extent, around 1997. Correspondingly, there seem to be dips
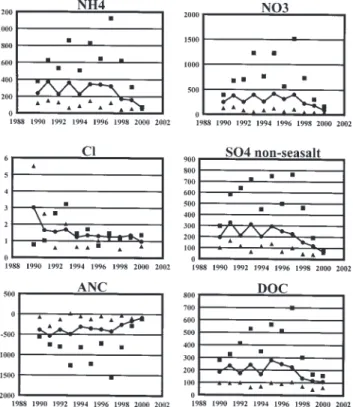
Fig. 5. Ammonium, NO3, Cl, non-sea-salt SO4, ANC and DOC in
cloud water: a time series. The solid line represents the average value for each year while the squares and triangle represent low-and high-catches, respectively. All concentrations are in meq l-1
except
DOC which is as mM-C l-1.
Fig. 6. Aluminium, NO3, Cl, non-sea-salt SO4, ANC and DOC in the upper Hafren: a time series. The solid line represents the average value for each year while the squares and triangle represent low and high flows, respectively. All concentrations are in meq l-1 except
in non-sea-salt SO4 at these times of high Cl concentrations (Fig. 4). Maritime inputs were maximal during 1983, 1989– 1990 and 1997–1998, while pollutant SO4 was highest during the intervening years. Nonetheless, the largest fluctuations seem to be for Cl and the oscillation for non-sea-salt SO4 is more damped in the stream relative to rainfall. The lack of a lower SO4*/Cl ratio in the streams during the first half of the monitoring period, in contrast to rainfall, illustrates how well the catchment is dampening the rainfall signal for SO4 relative to Cl even though Cl is highly damped.
Nitrate shows a strong seasonality reflecting seasonally
changing biological activity within the catchment, with peak concentrations during the winter months when uptake from the soil solutions into the growing vegetation is lowest. Average NO3 concentrations in the streams are similar to NO3 concentrations in rainfall at around 20 µeq l-1 with moderately lower values for the upper Hafren and upper Hore. In general, high-flow NO3 concentrations are higher than their baseflow counterparts by up to a factor of two. This links in part to the timing of high-flow events, which predominate during the winter months when NO3 uptake
by the vegetation is least as opposed to the low-flow periods during the summer when groundwater inputs from below the soil zone dominate.
In terms of trend in the streams a variety of responses occur:
z Upper Hafren. There may be declines in NO3 for this stream with perhaps up to a halving of concentrations for low-flow, high-flow and averages through the study period 1990 to 2001. Within this period, there is a secondary NO3 peak around 1996 for both the average and the high-flow data.
z Afon Hafren. There are no clear changes throughout the study period of 1983 to 2001.
z Upper Hore. Nitrate concentrations seem to have fluctuated around 20 µeq l-1 with no clear trend through the study period under high-flow conditions. In contrast, low-flow concentrations have reduced from about 15 to about 8 µeq l-1 while average concentrations show a similar decrease. There seems to be a secondary peak around 1996–1997, however, that masks what otherwise would be a uniform decline in concentration over time.
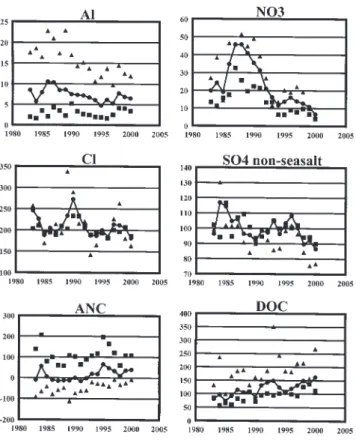
Fig. 7. Aluminium, NO3, Cl, non-sea-salt SO4, ANC and DOC in the
Afon Hafren: a time series. The solid line represents the average value for each year while the squares and triangle represent low and high flows, respectively. All concentrations are in meq l-1 except
DOC which is as mM-C l-1.
Fig. 8. Aluminium, NO3, Cl, non-sea-salt SO4, ANC and DOC in the upper Hore: a time series. The solid line represents the average value for each year while the squares and triangle represent low and high flows, respectively. All concentrations are in meq l-1 except
z Afon Hore. Nitrate concentrations have doubled from the start of the study period in 1983 to 1987 in terms of average (20 to 47 µeq l-1), low-flow (12 to 25 µeq l-1) and high-flow (20 to 50 µeq l-1) conditions. After this time, NO3 concentrations rapidly decline from 1987 to around 1994 and stabilize thereafter at around half the concentrations recorded during the first two years of record. This pattern reflects the impact of deforestation mentioned earlier in the paper. There seem to be two main features: (1) a gradual decline in background concentrations through the study period (a halving of average, low-flow and high-flow concentrations) and (2) a major increase in NO3 concentrations at the time of felling and for a few years thereafter.
DOC concentrations have increased uniformly over time at
all streams. The increases are for averages, low-flow and high-flows, respectively,
z Upper Hafren: 100 to 140, 45 to 80 and 160 to 300
µM-C l-1 for the study period 1990 to 2001. In the case of the high-flows, there are lower concentrations for
1997 to 1999 with respect to the trend line.
z Afon Hafren: 100 to 180, 50 to 100 and 150 to 300µM-C l-1 for the study period 1983 to 2001.
z Upper Hore: 60 to 100, 50 to 110 and 160 to 230µM-C l-1 for the study period 1985 to 2001.
z Afon Hore: 70 to 150, 60 to 110 and 150 to 300µM-C l-1 for the study period 1983 to 2001.
Ammonium concentrations are low (typically about
1µeq l-1) relative to rainfall as the atmospheric input is immobilised within the soil, assimilated into the biomass and/or oxidized to NO3.
Calcium, pH, Gran alkalinity, ANC and Al
The low-flow, high-flow and averaged chemistries show some similar features although the contrasting weathering and soil derived sources under different flow conditions lead to differences among the three measures. In general, the following patterns are observed:
z Averaged data. The average stream water quality is one of moderate acidity (pH 5.4 to 5.9, Gran alkalinity, –2 to 34 µeq l-1 and ANC –14 to 22 µeq l-1). The waters are Ca and Al bearing (average 27 to 87 µeq l-1 and 3.2 to 7.7 µM l-1, respectively) compared to rainfall reflecting the within-catchment sources. For Ca, concentrations are highest for the Hore, while Al does not vary significantly from catchment to catchment other than for the upper Hafren, where values are about half the mean.
z Baseflow waters. These are of moderately high pH with positive Gran alkalinity and ANC values and they are Ca bearing relative to rainfall and stream high-flow. The pH, Gran alkalinity and ANC of the baseflow varies from site to site in relation to the within-catchment weathering sources as for the averaged values. The upper and lower parts of the Afon Hafren have baseflow pHs of around 6.6 and the corresponding Ca concentration, Gran alkalinity and ANC baseflow values are about 35, 42 and 30 µeq l-1, respectively, with the upper Hafren having slightly more acidic and less calcium bearing waters. The upper and lower parts of the Hore are much more Ca bearing (about 83 µeq l-1) and less acidic with higher values for pH, Gran alkalinity and ANC at around 7.3, 170 and 160 µeq l-1. As with the Afon Hafren, the upper part of the catchment has slightly more acidic and less Ca bearing waters.
z Stormflow waters. These have lower Ca concentrations and they are much more acidic than the low-flow counterparts, with Ca averaging 27 µeq l-1, pH around
Fig. 9. Aluminium, NO3, Cl, non-sea-salt SO4, ANC and DOC in the
Afon Hore: a time series. The solid line represents the average value for each year while the squares and triangle represent low and high flows, respectively. All concentrations are in meq l-1 except DOC
4.6, Gran alkalinity –36 µeq l-1 and ANC –50 µeq l-1. The upper Hafren is slightly more acidic with less Ca bearing waters than the rest but the differences in concentration are much smaller in general than the baseflow counterparts are.
With regards to trends, the most noticeable changes are for the Afon Hafren, the upper Hore and the Afon Hore, where Al concentrations have decreased whilst Gran alkalinity and ANC have increased thus showing some improvements over time. The changes observed are most marked in these cases because of the longer data run. The changes observed are clearest at high flows where:
z Aluminium concentrations have declined uniformly from about 17 to 13 µM l-1 at the Afon Hafren between 1983 and 2001. For the Afon Hore, there is also a uniform decrease in concentration (25 to 12 µM l-1) from 1986 to 2001. However, earlier than this (1983-1984) lower high-flow concentrations (about 17 µeq l-1) occurred. The changes in Al concentration at high flow follow that of NO3 ([Al] = (0.19±0.08)*[NO3] + (10.2±5.3), N= 18, r2 = 0.57). It seems that, with felling, NO3 release has promoted Al solubilisation in the soil and mobilisation to the stream. The relationship between Al and NO3 has been observed for other sites across Wales, not just in association with felling (Neal and Reynolds, 1998), and it may well mark a separation between Al and H ion production, the former occurring in the lower soils, the latter occurring in the upper soils. It may also be linked, however, to acid hydrolysis of organically bound (pyrophosphate extractable) Al in the B-horizon. This would arise through generation of nitric acid in the forest floor as NH4 released by decomposition of felling debris is nitrified followed by leaching of the acid to the subsoil from where Al is released (Mulder and Stein, 1994; Berggren and Mulder, 1995; Berggren
et al., 1998). For the upper Hore, small Al concentration
declines have occurred through the study period (from about 17 µM l-1 in 1985 to about 14 µM l-1 in 2000.
z Gran alkalinity has increased uniformly from about -40 to –25 µeq l-1 and –20 to –2 µeq l-1 for the Afon Hafren and upper Hore/Afon Hore, respectively.
z ANC has increased from about –60 µeq l-1 in 1983 to about –30 µeq l-1 by 1992, as a “step” function, for the Afon Hafren. For the upper Hore and Afon Hore, a similar pattern of change occurs but with a range of about –70 to –30 and –60 to –20 µeq l-1, respectively, and in these cases there are no clear step functions. For the Afon Hore, high-flow pH has possibly increased from 4.5 to 4.2. In the case of ANC, the changes
observed are paralleled within the baseflow and averaged data, but with a more pronounced “step”.
z Calcium shows no clear trend.
For the upper Hafren, a similar pattern is observed for ANC through the 1984 to 2001 study period again with a step change of around 30 µeq l-1 in the early 90s. This step change occurred for low-flow, average and high-flow data.
Discussion
The Plynlimon dataset provides a major resource for the study of acidification trends within Wales and more generally for the acid impacted areas of the UK uplands. The study presented here shows the complexity of examining environmental datasets for dynamic river systems where concentrations vary strongly as a function of flow. Within the paper, simplifications have been made to describe trends by examining yearly variations in relation to average and average low-flow and average high-flow concentrations. By this route, some clear linear features are observed while in other cases, curvilinear, step and cyclical changes are seen. The confounding factors of water quality fluctuations and non-linear trends make descriptive methods of analysis appropriate but unsatisfying in terms of rigour. Statistical analysis is difficult and new approaches are required (e.g. Robson and Neal, 1996; Evans et al., 2001; Cooper and Evans, 2001). The broad features of the study in terms of trends are as follows.
z Atmospheric inputs: rainfall. For the three driving anions critical for acidification research, Cl, SO4 and NO3, there is no consistent trend with respect to rainfall. Rather, there seems to be a pattern with some years having higher maritime inputs (Cl) and other years with higher pollutant component (non-sea-salt SO4, NO3, NH4 and DOC) that presumably reflects the year-to-year variations of weather patterns. These patterns fit well with the observations for other western UK sites in North Wales and Scotland (Evans et al., 2001) where high Cl concentrations occur around about 1990. This pattern also fits well with the fluctuation of the North Atlantic Oscillation (NAO), which may strongly influence winter precipitation and temperature patterns in regions bordering the North Atlantic (Hurrell, 1995; Evans et al., 2001). There are some clear patterns of change with the pollutants and these are mainly for low rainfall events where the concentrations of pollutants (NH4, NO3, non-sea-salt SO4, DOC, Ca and Al) have increased between 1983 and 1993 after which concentrations then declined. For non-sea-salt SO4, this
pattern is broadly consistent with temporal changes in UK S emissions (Goodwin et al., 2000) which increased slightly between 1984 and 1987, remained roughly constant until 1991 at 1600 to 1800 kT-S per annum and then declined sharply from 1572 kT-S in 1993 to just over 800 kT-S in 1998. The change in the emissions signal, however, with over a 50% reduction in S emissions over the monitoring period, is much larger than the observed change in rainfall chemistry. This suggests a non-linearity in the spatial relationship between S emissions and deposition in the UK that is explored in detail in NEGTAP (2001). One significant conclusion from this report concerns the importance of S emission sources from outside the UK and Europe. It is proposed that increases in S emissions from North Atlantic shipping, due to both increased traffic and fuel oil S content coupled with a relatively constant background of North American emissions, may have offset anticipated reductions in rainfall non-sea-salt SO4 concentrations at remote western UK sites (NEGTAP, 2001). No obvious trend was observed for pH, Gran alkalinity and ANC in rainfall due to the high scatter to the low-catch data. For average and high-catch values, there is no obvious pattern of change over time other than for DOC. DOC increased between 1983 and 2001 at high-catches while average concentrations increased up to 1992 and slowly declined thereafter. There may be a modest reduction in the acidity of the rainfall during the study period as observed particularly at average and high-catches when pH and ANC increase by about 0.1 and 20 to 30 µeq l-1 over the 17-year study period.
z Atmospheric inputs: cloud water. Cloud water is salt laden, acidic and polluted. The levels of pollution are most clearly marked under low-catch conditions, where NH4 provides both high concentrations and a driving determinand for ensuring very low ANCs. Overall, there seems to be a marked reduction in the pollutant components through the study period 1990 to 2001 particularly with regards to average and high-catch conditions during the last five years of record. For non-sea-salt SO4, this is again consistent with long-term changes in UK S emissions, although the decline in non-sea-salt SO4 concentration in cloud water is more pronounced than for rainfall. This reflects a decrease in cloud water aerosol SO4 concentrations due to changes in atmospheric chemistry close to UK emission sources brought about by the sharp decline in the air concentrations of SO2 and a probable increase in NH3. Chloride also reduces over this period and, in general, cloud water chemistry changes follow rainfall, but they are more pronounced.
z The streams. As with rainfall, two of the major driving anions, Cl and SO4, show no clear trends in concentration in the streams, rather there is more of a cyclical pattern between 1983 and 2001, as for rainfall. In the case of Cl, the rainfall-stream signals are similar in terms of yearly average and low and high flow extremes even though there is higher damping in the streams due to within catchment storage (Neal et al., 1988; Neal and Kirchner, 2000). For non-sea-salt SO4, there is a greater degree of damping within the stream compared to the rainfall. Thus, Fig. 4 shows a smaller change in the SO4*/Cl ratio in the stream compared to the rainfall. Indeed, during the 1980s, this ratio is about a third lower in rainfall than in the stream while in the 1990s the values are very similar. This means that within-catchment processes are dampening the SO4 signal even more than Cl. This seems reasonable since SO4 adsorption mechanisms are often present in acidic soils and associated groundwaters (Evans et al., 2001). Such increased damping is also observed for Na where cation exchange processes come into play for a base cation essentially derived from the atmosphere with no weathering component (Neal and Kirchner, 2000). Nonetheless, there are additional complicating factors such as the changing rates at which dry deposited S enters the catchment through the study period and these cannot be properly gauged at this stage. For NO3, there are clear seasonality patterns, but the largest change occurs with felling when stream water NO3 concentrations double before declining a few years later when uptake into the growing biomass is re-established. The peaks observed in NO3 concentration in the streams around 1996 have shown up across many of the UK acidification monitoring sites and this may be linked to the NAO with larger spring peaks following colder, low NAO, winters (Monteith et al., 2000). There are clear increases in DOC and this too seems to be a general feature for UK upland acidic and acid sensitive catchments (Monteith and Evans, 2000). For Al, there have been some reductions over time, but for the Afon Hore, the pattern may be obscured by NO3 release promoting Al solubilisation on felling part way through the monitoring period. In terms of acidification patterns over time, there seems to be a net reduction as particularly marked for ANC and the improvement often occurs as a step change between 1990 and 1995, about the time or just after the high sea-salt period when pollutant inputs might be expected to be at their lowest. Ironically, the onset of the steep decline in S emissions also coincides with this period, highlighting the difficulties in isolating cause and effect in trends in
highly dynamic systems subject to complex and interacting environmental drivers. In part, the improvement will be associated with increases in DOC as humic and fulvic anions will contribute, like bicarbonate, to a positive component to the ANC, by definition, but this does not explain easily the step change unless there is a marked change in the acid strength or H+/C ratio of the humic/fulvic acids generated over time.
There seems to be a clear increase in DOC in the streams through the study period. The upward trend in DOC in rainfall is unexpected and not properly explained at present. The DOC present in rainfall will not correspond to the humic and fulvic acids that make up the DOC within the stream. The implications are that pollutant organic components are entering the catchments and that these pollutants have increased over time (at least to the mid-record of the study period). If the hypothesis concerning the influence of increased North Atlantic shipping traffic and low fuel quality on non-sea-salt S deposition is sustained, this could also provide a source of organic pollutants in west coast rainfall. Overall, stream water acidity does seem to be declining through the study period in terms of ANC and Al although the changes are cryptic in nature and the levels of change may well not be sufficient to improve stream ecology. The improvements are odd in that there is no clear reduction in strong acid anion concentrations that would be needed, by conventional wisdom, to ensure improvements in stream water quality. However, it must be borne in mind that:
z The changes occurring are dynamic in nature and link to changes in fluxes in soil and groundwater systems that take decades to work through the catchment even with a uniform atmospheric input (Cosby et al., 1996).
z The oscillatory nature of the inputs coupled with changing patterns of pollution climate and acidifying emissions from industry and agriculture which span decadal perspectives, means that the 17 years of record presented here is only a short term perspective. This, in turn means that any recent improvements in acidification patterns shown in this paper cannot be simply extrapolated to the future.
Conclusion
In conclusion, the results of this study provide cautious optimism that stream water acidification is declining at Plynlimon as recovery starts to occur. Set against this, however, are background patterns of long-term change in response to long-term fluctuations in climate. Superimposed
on these are short-term responses to individual climatic and hydrological events that express themselves as noise in the system. The dynamic nature of flux transfers at both long and short timescales makes it difficult to interpret subtle trends in response to a single environmental driver such as acid deposition.
The increases in DOC over time coupled to changes in ANC as observed in this study are important with respect to assessing evolving environmental acidification trends in relation to reductions in acidic oxide emissions from industry and vehicles. There are three aspects to this. Firstly, current environmental impact models do not estimate how DOC levels will evolve over time as acidification changes and there is no clear mechanistic/thermodynamic set of equations that can be used to represent the potential changes within the model. Secondly, DOC behaves as an intermediate to strong acid anion more akin to Cl, NO3 and SO4 than to bicarbonate (Neal et al., 1999). In the formulation of the term ANC, however, it is effectively considered as a weak acid anion. Thirdly, there is no clear evidence that the acid strength or the acid base characteristics of the organics making up the DOC remains constant within the catchment as the degree of acidification changes. All of these aspects are critical to modelling long-term changes in stream acidification. Further, the issue of the acid strength of the organic acids is important for defining a clear index of acidification for operational environmental management practices: ANC is the critical term used at present to denote water quality status, but it is the H ion and inorganic Al concentrations that actually cause the ecological harm, not the ANC.
With regards to the influence of felling on water quality, earlier work clearly indicates a decline in water quality (Neal
et al., 1992a,b). The main observable effect is largely
confined to increases in stream water NO3 concentrations; the variability in the climate signal and the hydrology largely masks out other influences of forest harvesting: a feature seen across sites in Wales (Neal and Reynolds, 1998). The possible exception to this is for Al, which seems to parallel the NO3 signal at yearly levels of change.
Our analysis has shown that whilst 17 years of record is a start, long-term, high quality monitoring is still required and provides the only means of showing what is actually happening in a changing environment. There remains important structural uncertainty within the underlying mechanistic base to water quality models currently in use (Neal, 2000) and there is great uncertainty as to how the UK climate is changing and will change both in terms of general trend and climate instability (i.e. fluctuations in extreme events). Thus, it must be the measured response that provides the ground-truth for model predictions and