HAL Id: hal-00305612
https://hal.archives-ouvertes.fr/hal-00305612
Submitted on 17 Jan 2007HAL is a multi-disciplinary open access archive for the deposit and dissemination of sci-entific research documents, whether they are pub-lished or not. The documents may come from teaching and research institutions in France or abroad, or from public or private research centers.
L’archive ouverte pluridisciplinaire HAL, est destinée au dépôt et à la diffusion de documents scientifiques de niveau recherche, publiés ou non, émanant des établissements d’enseignement et de recherche français ou étrangers, des laboratoires publics ou privés.
groundwater in the Plynlimon area of mid-Wales
C. Neal, M. Neal, H. Wickham, L. Hill, S. Harman
To cite this version:
C. Neal, M. Neal, H. Wickham, L. Hill, S. Harman. Dissolved iodine in rainfall, cloud, stream and groundwater in the Plynlimon area of mid-Wales. Hydrology and Earth System Sciences Discussions, European Geosciences Union, 2007, 11 (1), pp.283-293. �hal-00305612�
© Author(s) 2007. This work is licensed under a Creative Commons License.
Dissolved iodine in rainfall, cloud, stream and groundwater in the
Plynlimon area of mid-Wales
Colin Neal, Margaret Neal, Heather Wickham, Linda Hill and Sarah Harman
Centre for Ecology and Hydrology, Maclean Building, Crowmarsh Gifford, Wallingford, OXON, OX10 8BB, UK
Email for corresponding author: [email protected]
Abstract
Iodine concentrations in rainfall, cloud water, throughfall, stemflow, stream water and groundwater are described for the upper River Severn Plynlimon catchments in mid-Wales. Iodine concentrations average 1.55 mg l1 in rainfall while the corresponding averages of iodine
concentrations in cloud water, throughfall and stemflow iodine concentrations are three to eight times higher. For the atmospheric inputs, there are both marine and anthropogenic sources while, for stemflow and throughfall, humic substances may be a dominant component. The average concentrations in the streams and groundwaters vary between 1.00 to 4.22 mg l1 and 0.57 to 8.51 mg l1, respectively. The higher
averages are for waters associated with gley soils that are high in dissolved organic carbon (DOC). For the streams draining forested catchments, iodine concentrations have increased over time, probably due to wetting up of the soils because of reduction in transpiration as the trees are maturing and felling activities. The increases vary between 0.025±0.003 and 0.044±0.010 mg l1 per year and are associated partly with an
increase in DOC concentration: adjusted for the effect of DOC, the increases range between 0.013±0.003 and 0.023±0.009 mg l1 per year.
For the moorland areas, no such trend is observed but the value is lower. For most of the Plynlimon catchments, a net uptake of iodine of around 40% is lower for streams draining gley soils with even a net export for the smaller streams. Within the streams, iodine concentrations are highly correlated with DOC and there is an annual cycle of iodine and DOC concentration change, with maxima between July and November. For the groundwaters, a loss of iodine and DOC relative to the streams probably reflects within catchment losses in the lower inorganic soils and bedrock areas. However, in one case, groundwater iodine concentrations were relatively high and this coincided with high DOC concentrations.
Keywords: dissolved organic carbon, Hafren, Hore, iodide, iodine, cloud, mist, rain, river, stemflow, Tanllwyth, throughfall, catchment
wetness
Introduction
Iodine is an important micro-nutrient in the environment and deficiencies are associated with health risks for both humans and wildlife (Jooste et al., 1992; Edmunds and Smedley, 1996; Phaneuf et al., 1999; Milewski and Diamond, 2000; Sack et al., 2000). Further, there are issues of radioactive iodine contamination from nuclear weapon testing, nuclear accidents and emissions from the nuclear power industry. A global distribution of radioactive iodine occurs because of the volatility of many of the iodine compounds involved and because particulate iodine in the atmosphere is frequently associated with very small aerosols (Radlinger and Heumann, 2000). Iodine is a relatively rare element in the earths crust averaging around 0.46 ppm and is usually found in minerals as the anion iodate (Greenwood and Ernshaw, 2005). Iodine concentration in seawater
averages around 50 mg l1 and the concentrations in rainfall
and river water are usually an order of magnitude lower (Moran et al., 2002). However, much higher concentrations can occur in brines associated with oil fields where concentrations can average 30 000 to 40 000 mg l1
(Greenwood and Ernshaw, 2005).
A major proportion of iodine in many surface fresh waters is generally thought to have been derived from the sea via the atmosphere (Moran et al., 2002); the transfer is complex, involving both inorganic and organic components and the processes include sea spray and biogenic production of organo-iodine (Radlinger and Heumann, 2000). Iodine is concentrated in soils, especially organic rich ones, but can be released back to solution under reducing conditions (Muramatsu and Yoshida, 1999; Yuita and Kihou, 2005). Iodine exists in a number of oxidation states: 1, 0, 1, 3, 5 and 7. However, it most often occurs in natural waters
inorganically in the -1 (iodide) and +5 (iodate) oxidation states which are the most stable thermodynamically (Jones, 1981; Jones and Truesdale, 1984; Truesdale and Jones, 1996; Moran et al., 2002). Iodine can also be present in significant concentrations as organo-iodine in waters and fixed onto humic substances (Warwick et al., 1993; Radlinger and Heumann, 2000; Andersen et al., 2002).
In this paper, the distribution of iodine in rainfall, cloud water (mist), stream water and groundwater is presented for the Plynlimon catchments in mid-Wales, to describe iodine water quality for a classic upland typology. The work develops from an earlier study of halogens in the area (Neal
et al., 1990) by showing longer term (decadal) patterns of
change that link to increasing dissolved organic carbon concentrations (Neal et al., 2005). It parallels the study of bromine concentrations in the Plynlimon area (Neal et al., 2007) and earlier studies of iodine species in rainfall and surface waters at Plynlimon and other parts of the UK (Jones, 1981; Jones and Truesdale, 1984; Truesdale and Jones, 1996). The work provides new information on iodine in groundwater at Plynlimon for a shallow fracture flow dominated aquifer in a hard rock terrain.
Study area and monitoring
programme
The study is based in the headwater areas of the River Severn in mid-Wales in the Plynlimon experimental catchments. Iodine concentrations in these catchments have been determined in rainfall, cloud water (mist), stemflow, throughfall, stream water and groundwater as part of ongoing long-term (10 to 25 years) baseline monitoring as well as one to five year more focussed monitoring programmes (Neal and Kirchner, 2000; Neal et al., 2007). Monitoring has typically been on a weekly to fortnightly basis.
The headwaters of the Severn comprise two main subcatchments, the Afon Hafren and the Afon Hore (areas 3.6 and 3.2 km2, respectively), and one smaller one, the Nant
Tanllwyth (0.9 km2). Details of the sites and durations of
the monitoring programme are in Neal and Kirchner, (2000) and in Neal et al., (2007), so only the salient features need be described here.
The upper Severn has relatively high rainfall of around 2500 mm year1 and runoff, typically about 2000 mm year1,
is rapid due to the hard rock geology (Silurian and Ordovician slates and shales) and thin acidic and acid sensitive soils (peat, podzols and gleys). The upper part of the catchment comprises the Plynlimon massif of acid moorland and hag peat, while in the lower half is acid moorland on which a Sitka spruce forest was planted up to
60 years ago. The forestry practice follows the cycle of a working plantation, and many parts of the forest have been cropped and replanted. The cropping of the forest has been gradual apart from that on the lower Hore where an experimental clear-fell occurred between 1985 and 1989.
Rain-gauges were sited one at the top and one at the bottom of each of the two catchments; also a cloud/mist collector was near the top and five primary stream water monitoring points were also distributed across the catchments. There were two stream monitoring points on the Afon Hafren, one at an upper site half way down the catchment where the moorland meets the forest and one at a lower site that includes the whole catchment. A further two sites were on the Afon Hore, one at an upper site half way down the catchment with a 5050% mix of moorland and forest cover and one at a lower site that monitors the whole catchment. The fifth stream monitoring site is on the forested Tanllwyth near its junction with the Afon Hore. Also, a further series of five small (less than 5 ha) catchment sites, including two pairs with fell (f) and control (c) streams, examines the effects of felling on podzolic and gley soils. The paired sites on podzol are SE1f and SE3c, while the gleys sites are TanNc and TanSf. A further small catchment has been monitored within the Hore catchment where felling has been undertaken (south2Hore with an area of 54 ha). In addition, a series of boreholes has been established across the catchment and at the paired stream sites; these have been sampled for shallow and in some cases deep groundwater.
Iodine analysis
After 0.45 mm cellulose nitrate membrane filtering of the water samples, the filtrates were stored cold (4oC) in the
dark prior to analysis. The river and groundwater samples were filtered in the field, while the rainfall, cloud, throughfall and stemflow samples were filtered in the laboratory, soon after return from the field. Sample storage was in chromic acid-cleaned glass bottles with glass stoppers.
Iodine analysis used an automated colourimetric (autoanalyzer 1) method based on the catalytic effect of iodide on the reaction between cerium IV and arsenic III (Truesdale and Smith, 1975; Jones et al., 1982). Duplicate analyses were undertaken with calibration in the range 0 to 5 mg l1 and a detection limit of 0.1 mg l1. Intermediate
cross-check standards were included every five samples in an analytical run and the analysis was repeated if the response for the duplicate samples differed visually from each other on the chart, or if peak shape was irregular in any way.
Previously, researchers have reported data using the present methodology as total iodine. However, because the waters are filtered, it corresponds to dissolved iodine
and, indeed, may include reactive material within the colloidal fraction that can pass through standard 0.45 mm filters. This dissolved total iodine measurement has been largely synonymous with the dissolved inorganic species (iodide plus iodate). However, as Jones et al. (2004) note, the method may also respond to organo-iodine compounds in the water, but the extent of the response varies substantially according to which particular organo-iodine compound is present in the water. Because of this, the dissolved total iodine measure is really a total dissolved labile iodine fraction. In this paper, the word iodine is used to describe this total dissolved labile fraction, to avoid the text becoming cumbersome.
Results
GENERAL FINDINGS
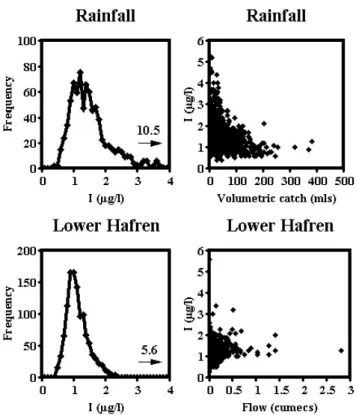
The iodine concentrations in the waters sampled were up to 66 mg l1 and usually much lower (Table 1). The highest
concentrations were observed for the atmospheric inputs, with data skewed to lower concentrations while the high concentrations occur at low volumes of catch (Fig. 1). Of the atmospheric sources, average iodine concentration in
Table 1. Iodine and DOC in Plynlimon waters.
Average I Average I, Minimum I Maximum I DOC I/DOC flow weighted µg l1 µg l1 µg l1 µg l1 mg l1 µg mg1 Rainfall 1.55 1.30 0.4 10.5 0.68 2.29 Cloud 10.55 8.43 0.8 66.0 2.42 4.36 Throughfall 5.46 4.40 1.2 33.3 11.40 0.48 Stemflow 8.16 6.40 1.4 42.0 19.15 0.43 Upper Hafren 1.00 1.08 0.5 4.5 1.42 0.71 Lower Hafren 1.15 1.29 0.4 5.6 1.64 0.70 Upper Hore 1.08 1.14 0.4 3.4 1.56 0.69 Lower Hore 1.07 1.18 0.3 3.2 1.51 0.71 Tanllwyth 1.89 1.83 0.9 4.8 3.25 0.58 South2Hore 1.34 1.30 0.7 6.4 1.74 0.77 SE1f 1.28 1.26 0.6 3.8 1.16 1.10 SE3c 1.05 1.20 0.7 2.5 0.62 1.71 TanNc 3.49 2.62 0.9 7.2 15.24 0.23 TanSf 4.22 3.34 0.9 14.1 12.78 0.33 HA4B 0.65 NA 0.4 1.4 0.63 1.02 Quarry 0.57 NA 0.3 1.3 0.42 1.34 SE1Bf 0.74 NA 0.4 2.3 0.59 1.25 SE3Bc 1.63 NA 0.8 3.0 0.42 3.87 TanNBf 1.10 NA 0.8 1.7 0.50 2.20 TanSBc 8.51 NA 0.6 21.0 1.48 5.74
Fig. 1. The distribution of iodine concentration for rainfall and the
rainfall is relatively low (1.55 mg l1) with cloud water,
throughfall and stemflow (10.55, 5.46 and 8.16 mg l1,
respectively) being three to eight times higher. Correspondingly, the stream waters have average concentrations lower than that for rainfall (typically 1.00 to 1.34 mg l1) although, in some cases, average concentrations
can be higher (1.89 to 4.22 mg l1). The data for the streams
are skewed but the skew is less than that for the atmospheric inputs (Fig 1). Also, the distribution of iodine in the streams is not linked systematically to flow. Rather, there is a particularly high scatter in iodine concentration to both high and low concentrations at low flows with concentrations levelling off to a value close to the average at high flows (Fig 1). For groundwaters, average concentrations are generally lower than those for the streams (0.57 to 1.10 mg l1) but two sites are outliers with higher average
concentrations (1.63 and 8.51 mg l1). For both the streams
and the groundwaters, the most pronounced outliers are for the small forested catchment systems on gley soils. For the groundwaters, the frequency distribution for iodine concentrations is similar to that for the streams and there is no clear link between the distribution of iodine concentration and groundwater level.
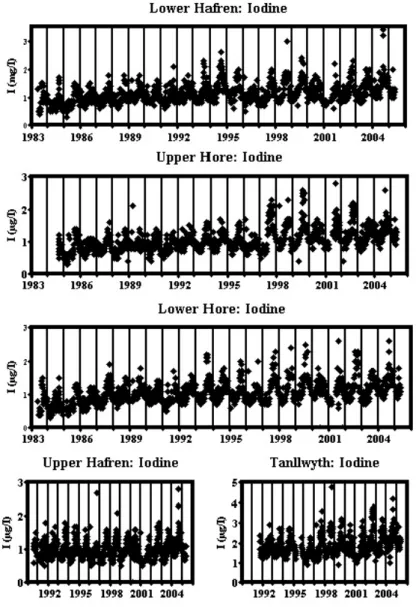
The stream waters show a marked seasonal pattern. Iodine concentrations are higher in autumn (Figs. 2 and 3) and, for the long-term monitoring sites on the river, the iodine concentration increases with time in the upper and lower Hore and the lower Hafren and the Tanllwyth that drain from the forested areas. However, there is no clear trend for the upper Hafren site that drains the moorland area only. Statistical analysis reveals linear gradients for iodine over time averaging around 0.03 mg l1 yr1 with a range of
0.025±0.003 to 0.044±0.010 mg l1 yr1 for the forested areas
and a gradient of 0.008±0.005 mg l1 yr1 for the moorland
(Table 2).
Table 2. Iodine variation over time for the main Plynlimon streams: linear regression relationships. The units are µg l-1
for iodine and years for time.
Study period Gradient 2*std Constant 2*std r2 N
Rainfall 1983 to 2005 0.011 0.008 23.3 1.4 0.009 835 Cloud 1990 to 2005 0.127 0.176 264.4 14.2 0.004 521 Upper Hafren 1990 to 2005 0.008 0.005 14.0 0.6 0.011 738 Lower Hafren 1983 to 2005 0.025 0.003 49.3 0.7 0.179 1168 Upper Hore 1984 to 2005 0.030 0.003 57.9 0.6 0.251 1062 Lower Hore 1983 to 2005 0.025 0.003 49.6 0.6 0.223 1168 Tanllwyth 1991 to 2005 0.044 0.010 86.6 1.0 0.113 653
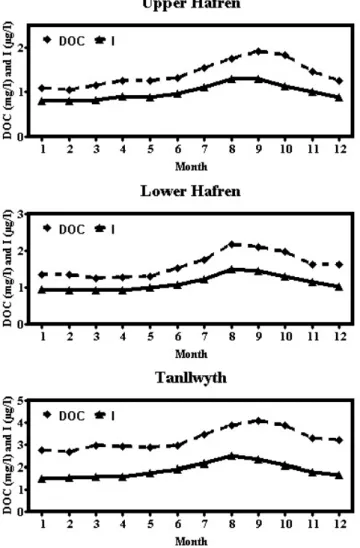
Fig. 3. The average monthly concentrations of iodine and DOC in
the upper and lower Hafren and the Tanllwyth.
IODINE CONCENTRATION RELATIONSHIPS WITH CHLORIDE AND DOC
Rainfall, cloud water, throughfall and stemflow
At Plynlimon, iodine concentrations in the atmospheric inputs and stream and groundwater outputs are mainly of marine origin, but there can be a micro-organic (pollutant) and humic (vegetative) component as well. To examine the linkage of iodine with these two sources, the iodine concentrations have been compared with those of chloride that represents the marine contribution and with DOC that provides a measure of the organic carbon constituents.
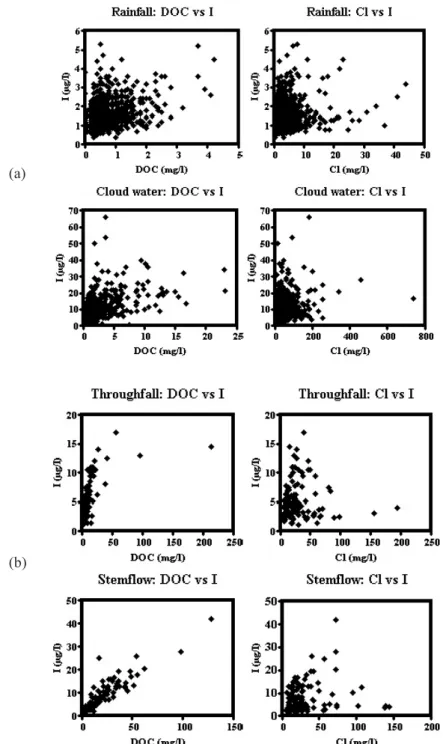
For rainfall and cloud water, there is a scattered relationship between DOC and chloride with iodine although there is some structure of a wedge-shaped pattern and a corner that passes through the origin (Fig 4a). There are two features to this. Firstly, there is a lower boundary line for chloride that probably reflects a largely marine component. Secondly, there is an upper boundary that represents a DOC component. The chloride and DOC concentrations are negatively related since chloride comes from Atlantic frontal systems that are relatively unpolluted, while the DOC comes from contaminant sources (Wilkinson
et al., 1997). Thus, the pattern is one of two-component
mixing with a dilution (washout) component superimposed. For throughfall and stemflow, the pattern is similar to that for chloride, but for DOC there is a much stronger relationship with iodine and a near linear feature was observed (Fig 4b).
To separate the influence of the marine and the organic component on the iodine signal, a multiple linear regression was undertaken. As there is an approximately inverse relationship between iodine concentration and volume of catch, the regression used the logarithm of the volume of the catch as this gave a more linear relationship. The results of this exercise show (Table 3):
Fig. 4. DOC and chloride concentration relationships with iodine in (a) rainfall and cloud water, (b) throughfall and stemflow.
Table 3. Multiple linear regression analysis for the logarithm of the volume of catch and dissolved organic carbon and chloride concentration
with total iodine. The units are µg l-1 for iodine, mg l-1 for DOC and chloride and ml for volume of catch.
log(catch) DOC Cl Constant r2 N
Grad 2*std Grad 2*std Grad 2*std Grad 2*std
Rainfall -0.97 0.13 0.13 0.09 0.033 0.010 2.92 1.25 0.329 827 Cloud water -1.08 0.79 1.14 0.19 0.028 0.009 9.72 12.00 0.286 583 Throughfall -2.79 1.45 0.07 0.02 0.006 0.017 9.17 4.96 0.405 118 Stemflow -1.82 2.17 0.28 0.03 0.027 0.021 5.15 6.15 0.779 112 (a) (b)
l The multiple regressions are all significant statistically
(p<0.001).
l For rainfall and cloud water, all three regression terms
are statistically significant, and the gradients are similar except for DOC where the rainfall gradient (0.13±0.09 mg:mg) is only about a ninth of that for the cloud water (1.14±0.19 mg:mg): for chloride, the respective gradients were 0.033±0.010 and 0.028±0.009 mg:mg.
l For throughfall and stemflow, the chloride coefficient
is statistically much weaker than that for rainfall and cloud water and, in the case of stemflow, so too is the logarithm of the volume of catch. The clearest correlation is between DOC and iodine although the gradients differ. For throughfall, the gradient dI/dDOC is 0.07±0.02 mg:mg and for stemflow it is 0.28±0.03 mg:mg, the values straddling that for rainfall.
DOC in the atmospheric inputs is linked to several pollutants. To test if the iodine trend relates specifically to DOC, another pollutant component, non-marine sulphate was included in the multiple regression analysis. This exercise showed that for rainfall and cloud water, the non-marine sulphate term was statistically significant (gradient 0.10±0.03 and 0.31±0.07 mg:mg-SO4, respectively) at the
expense of the DOC (gradient 0.08±0.09 and 0.20±0.33 mg:mg, respectively). The rainfall and cloud water gradients for chloride remain similar to those for the regression excluding the non-marine sulphate term (0.027±0.009 and 0.031±0.008 mg:mg, respectively). Correspondingly, for stemflow, non-marine sulphate correlates significantly with iodine within the regression equation (gradient 0.06±0.02 mg:mg), but barely for throughfall (gradient 0.02±0.02 mg:mg). However, for both throughfall and stemflow, the relationship between iodine and DOC is maintained and the gradient is very similar to that for the regression excluding the non marine sulphate term (0.07±0.02 and 0.024±0.04 mg:mg, respectively).
STREAM WATERS
Statistical analysis along the lines of that for rainfall, cloud water, throughfall and stemflow was undertaken for the stream waters. The analysis has been divided into two parts. Firstly, for the long term monitoring sites, multiple regression analysis has been undertaken for iodine with DOC, chloride and time. Time was included as the iodine concentration for most of these stream sites was increasing throughout the period of study (Fig. 2, Table 2). Secondly, multiple regressions have been undertaken for just DOC and chloride for all the monitoring sites: in the case of the shorter term sites, the longer term trends are not clearly marked the longer-term sites are included for comparative purposes.
Long term stream monitoring sites
In all cases, the multiple regression analysis gives results that are highly significant statistically; iodine concentrations are correlated positively with DOC and negatively with chloride. Of the two, the dI/dDOC term is statistically most significant (Table 4). The average dI/dDOC gradient is around 0.185 mg:mg with a range of 0.120±0.017 to 0.194±0.020 mg:mg. For chloride, the average gradient is 0.04 mg:mg with a range of 0.036±0.022 to 0.056±0.021 mg:mg. Iodine concentrations are positively correlated with time for the catchments draining forest (lower Hafren, upper and lower Hore and the Tanllwyth), but not for the catchment draining moorland (upper Hafren). For the forested areas, the increase in iodine over time is around 0.015 mg l1 yr1
with a range of 0.013±0.003 to 0.023±0.009 mg l1 yr1: the
corresponding gradient for the moorland is 0.001±0.005 mg l1 yr1. These values are similar to about a half of those
obtained by linear regression involving time only as the independent variable. Clearly the trend to increasing iodine concentrations over time is partly related to that for DOC increase.
Table 4. Multiple linear regression relationship between time (years), dissolved organic carbon and chloride (mg l1) with total iodine
(µg l1) in Plynlimon streams for the long term monitoring sites.
Year DOC Chloride Constant r2 N
Grad 2*std Grad 2*std Grad 2*std Const 2*std
U Hafren 0.001 0.005 0.173 0.020 -0.036 0.022 1.4 0.3 0.323 738 U Hore 0.021 0.003 0.175 0.019 -0.048 0.010 40.7 0.3 0.490 1057 L Hafren 0.013 0.003 0.185 0.016 -0.041 0.013 25.3 0.3 0.471 1155 L Hore 0.016 0.002 0.194 0.020 -0.042 0.010 30.2 0.3 0.480 1179 Tanllwyth 0.023 0.009 0.120 0.017 -0.056 0.021 44.2 0.4 0.370 652
Long and short term stream monitoring sites
For all the streams, the multiple regression analysis is significant statistically and the greatest component of that significance is DOC (Table 5). The gradient dI/dDOC averages around 0.20 mg:mg with a range of 0.082±0.027 to 0.287±0.062 mg:mg. Correspondingly, for chloride, there is a negative gradient between iodine and chloride in all but two cases. Where the relationship was negative, the average gradient dI/dCl was typically around 0.045 ìg:mg with a range of 0.036±0.022 to 0.271±0.144 mg:mg: the most negative value was atypical as DOC concentrations were especially high. For the two small streams draining podzolic soils (SE1 and SE3), iodine was related positively with gradient dI/dCl around 0.032±0.029 mg:mg but barely significant statistically.
For the long term sites, the exclusion of time from the regression analysis led to slightly higher but variable dI/ dDOC gradients (0 to 25%), but the dI/dCl gradient was largely unaffected.
Seasonal patterns between iodine and DOC
Both the iodine and the DOC concentrations change similarly through the year, with the highest concentrations occurring between July and November (Fig. 3). Superimposed on this pattern is a hysteresis effect (Fig. 5), where during the period May to August, iodine concentrations are relatively high for a given DOC
concentration. This feature indicates that during the growing season either iodine is enriched relative to DOC or there is a net loss of DOC relative to iodine.
Table 5. Multiple linear regression relationship between dissolved organic carbon and chloride (mg l1) with total iodine (µg l1) in
Plynlimon streams.
Year DOC Chloride Constant r2 N
Grad 2*std Grad 2*std Grad 2*std Const 2*std
U Hafren 0.001 0.005 0.173 0.020 0.036 0.022 1.4 0.3 0.323 738 U Hore 0.021 0.003 0.175 0.019 0.048 0.010 40.7 0.3 0.490 1057 L Hafren 0.013 0.003 0.185 0.016 0.041 0.013 25.3 0.3 0.471 1155 L Hore 0.016 0.002 0.194 0.020 0.042 0.010 30.2 0.3 0.480 1179 Tanllwyth 0.023 0.009 0.120 0.017 0.056 0.021 44.2 0.4 0.370 652
DOC Chloride Constant r2 N
Grad 2*std Grad 2*std Const Grad 2*std Grad
U Hafren 0.174 0.020 0.036 0.022 0.96 0.26 0.323 738 U Hore 0.231 0.019 0.033 0.011 0.95 0.28 0.387 1057 L Hafren 0.212 0.015 0.040 0.014 1.08 0.29 0.428 1155 L Hore 0.243 0.019 0.038 0.011 1.00 0.27 0.408 1179 Tanllwyth 0.132 0.017 0.059 0.022 1.92 0.43 0.342 652 S2Hore 0.082 0.027 0.049 0.008 1.53 0.29 0.287 637 SE1f 0.287 0.062 0.032 0.024 0.68 0.32 0.348 174 SE3c 0.237 0.091 0.031 0.029 0.67 0.21 0.193 124 TanNc 0.145 0.041 0.090 0.067 2.01 1.19 0.496 106 TanSf 0.201 0.065 0.271 0.144 3.45 1.74 0.526 133
Fig. 5. The relationship between DOC and iodine for monthly
averages for the lower Hafren. The data points are joined by lines for consecutive months through the years and the data point for each month is labelled by the month number.
GROUNDWATER
There is no clear statistically significant relationship for either DOC or chloride with iodine concentration in groundwater and no clear relationship with groundwater depth.
Mass balance input output
relationships
Previous studies at Plynlimon based on the early record indicate a net uptake of iodine by the catchment (Neal et
al., 1990; Durand et al., 1994). Here, the analysis is updated
using information on flow-weighted averaged iodine concentrations for rainfall, cloud water and stream water (Table 1) coupled with hydrological information on rainfall and cloud deposition and stream runoff (Neal et al., 2007). For both the upper and lower Hafren and the Hore, there is a net uptake of about 40% of the input. Correspondingly, the net uptake for the main stem of the Tanllwyth is around 22% and for the small Tanllwyth streams, TanNc and TanSf, there is a net release of 11 and 42%, respectively. The lower uptake for the main stem of the Tanllwyth and the net release of iodine from the catchment for the small Tanllwyth streams results from the higher flow-weighted iodine concentrations in the stream and is associated with a high DOC content in the waters (Table 1). For the Tanllwyth, with its gley soils and reducing conditions, both DOC and iodine would be expected to be mobilised.
Discussion
The average iodine concentration in rainfall at Plynlimon, ~1.55 mg l-1 is similar to that observed for the English Lake
District (Jones and Truesdale, 1984). It is also similar to other parts of the UK where iodine concentrations average 1.5 to 2.5 mg l1 in coastal areas and 1 mg l1 inland
(Whitehead, 1984; Fuge, 1989; Edmunds and Smedley, 1996). The iodine in rainfall is associated with both marine and anthropogenic sources and the inverse relationship between iodine concentration and volume of catch represents a wash out of mist and particulate components during rainfall events. For cloud water, throughfall and stemflow, iodine concentrations are enriched relative to rainfall; again, there is both a marine and an anthropogenic component. However, in the cases of throughfall and stemflow, there is a very strong linkage between iodine and DOC concentrations; it may well be that much of the iodine is associated with organic material cycled by the trees and washed from their surfaces. This organic carbon is brown in colour and linked to humic acids. For rainfall, cloud water,
throughfall and stemflow, even in the cases where iodine concentration is low and chloride concentration is high, the iodine to chloride ratio is still over an order of magnitude higher than that in seawater. For example, in rainfall, the ratio for the lower iodine to chloride bound is 0.04 mg:mg and that for the regression gradient is 0.033±0.010 mg:mg, which compares with a ratio for sea water of 0.0026 mg:mg. This illustrates that, for the atmospheric input, even the marine component is enriched in iodine relative to seawater. Stream water iodine concentrations averaged around 1.5 mg l1; this value is similar to that in the English Lake District
(Jones and Truesdale, 1984) but is perhaps on the low side for river systems in general. For example, Moran et al. (2002) reported that while iodine concentration across the rivers of the world was mostly < 20 mg l1, the median and
mean were 10.2 and 19.9 mg l1, respectively. Stream water
iodine concentrations have been increasing over time for the Plynlimon areas draining forest (with or without harvesting) and this increase has been observed for bromine, DOC and iron as well (Neal et al., 2005). With felling and tree aging, transpiration decreases (Marc and Robinson, 2007). The increases in iodine, bromine, DOC and iron over time are consistent with the effects of the forest soils wetting up and releasing these components. This feature also explains why the moorland system does not show similar hydrochemical changes. As to the extent of the felling effects, detailed analysis of the Hore clear-fell indicated previously that iodine increases from 0.8 to 1.2 mg l1 within
the forest streams (Neal et al., 1992). However, most of the signal seems to lie within the noise of the background trend and even with the paired catchment studies there is little discernable change. The original analysis of the felling effect for the Hore was undertaken for pre-1992 data; here, the data were reanalysed with more than ten years of additional information. To do this, the time series for the lower Hafren and the lower Hore were compared (the lower Hafren can be considered a control site for the lower Hore). Regression analysis revealed a strong linear relationship with no clear-felling effect. The relationship was
IHore = 0.80±0.03*IHafren + 0.15±0.37, r2=0.717, N = 1154.
Comparing annual average concentrations, between 1983 and 1990 (when the Hore was clearfelled), the iodine concentration changed approximately linearly from around 17% to around 6% (100*(Hore-Hafren)/Hafren). After that time, there was no systematic change with the differences fluctuating between 10 and +5%. Thus, in the light of the longer run of data, even for the lower Hore with the control clear-fell, the changes involved were small.
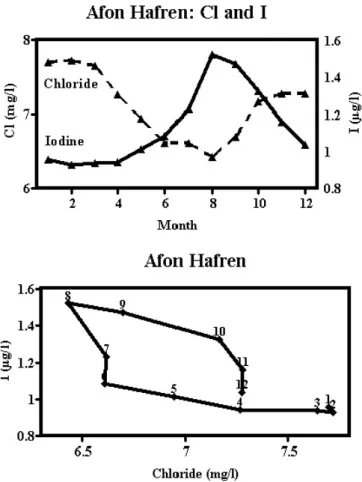
concentrations in the stream reflects the occurrence of Atlantic frontal systems enriched in sea salts that occur in winter when iodine concentrations are at their lowest. Figure 6, for the lower Afon Hafren, shows that monthly average chloride concentrations are lower in summer between April and October, while iodine concentrations peak from July to November. Correspondingly, a plot of iodine against chloride concentration for monthly averages shows a strong clockwise hysteresis.
Within the groundwater areas, DOC decomposes and the waters become high in dissolved carbon dioxide (Neal et
al., 1997). Because of this, the correlations of iodine with
DOC and chloride are largely lost. The lower iodine concentrations in the groundwaters relative to the stream imply a loss of iodine (as well as DOC) in the groundwater areas. At only one site was the iodine concentration in groundwater relatively high and, at this site, DOC was also relatively high. This situation occurred for the gley area and it probably reflects unusually wet and highly reducing conditions with increased iodine mobilisation. Even
including this outlier value, the concentrations of iodine in the groundwaters at Plynlimon are relatively low, and much lower than for many UK aquifers. For example, high iodine concentrations (median concentration 32 mg l1) occur within
the Chalk, probably due to oxidation of organic matter, while for non-carbonate aquifers, iodine concentrations are typically a quarter that for the Chalk (Edmunds et al., 1989; Edmunds and Smedley, 1996).
Overall, the present study extends the findings of Neal et
al. (1990) in respect of the iodine hydrochemistry of a major
upland research site in mid-Wales. It illustrates the need for long term studies to extend the patterns of change beyond the seasonal and year-to-year level. A gradual increase in iodine concentration in the streams seems to be related to catchment wetness. The work also provides a clear indication of the importance of maritime and pollutant components of iodine in the rainfall and cloud water inputs to the Plynlimon catchments and, potentially, of chemical cycling of iodine through the vegetation. Iodine accumulates in organic-rich soils and it is known that, over the last 50 years worldwide, the ratio of 129I/127I has increased by an order of
magnitude due to atmospheric atomic tests and point sources of pollution (e.g. Sellafield in the 1950s). Thus processes that lead to increased wetting (e.g. the habitat restoration of previously drained peat-lands by flooding, or tree harvesting) should be questioned within the vicinity of known point sources of radiological pollution and perhaps even some diffuse ones.
The method used for iodine assay is an operational one and it cannot be concluded that the method determines only inorganic iodine within the stream. In a companion study, issues of organo-halogen components within the Plynlimon inputs and stream and groundwater outputs have been raised in respect of bromine (Neal et al., 2007). There may well be a significant organic iodine component within the throughfall and stemflow monitored within the present study. For both iodine and bromine, the current Plynlimon studies provide an important baseline and key hydrochemical information. However, for further progress to be made, inorganic and organic speciation studies of the halogens are required.
References
Andersen, S., Petersen, S.B. and Laurberg, P., 2002. Iodine in drinking water in Denmark is bound in humic substances. Eur.
J. Endocrinology, 147, 663670.
Durand, P., Neal, C., Jeffery, H.A., Ryland, G.P. and Neal, M., 1994. Major, minor and trace element budgets in the Plynlimon afforested catchments (Wales): general trends, effects of felling and of climate variations. J. Hydrol., 157, 139156.
Fig. 6. Variations in average chloride and iodine concentration with
season for the lower Afon Hafren. The upper plot shows the variation of chloride and iodine with month. The lower plot is of chloride versus iodine: the data points are joined in monthly sequence with the months numbered.
Edmunds, W.M., and Smedley, P.L., 1996. Groundwater geochemistry and health: an overview. In: Environmental
geochemistry and health, J.D. Appleton, R. Fuge and G.J.H.
McCall (Eds.) Geol. Soc (London) special publ. 113, 91105. Edmunds, W.M., Cook, J.M., Kinniburgh, D.G., Miles, D.L. and Trafford, J.M., 1989. Trace-element occurrence in British
groundwaters. British Geological Survey, Research Report, SD/
89/3. Nottingham, UK.
Fuge, R., 1989. Iodine in the environment: its distribution and relationship to human health. In: Trace Substances in the
Environment, D. Hemphill (Ed.), Univ. Missouri, USA. 7487.
Greenwood, N.N. and Ernshaw, A., 2005. Chemistry of the
elements. Elsevier, Amsterdam, The Netherlands. 1342pp.
Jones, S.D., 1981. Speciation of iodine in rain and freshwaters. PhD thesis. University of Wales. 242pp.
Jones, S.D. and Truesdale, V.W., 1984. Dissolved iodine species in a British freshwater system. Limnol Oceanog., 29, 1016 1024.
Jones, S.D., Spencer, C.P. and Truesdale, V.W., 1882. Determination of total iodine and iodate-iodine in natural freshwaters. Analyst, 107, 14171424.
Jooste, P.L., Badenhorst, C.J., Schutte, C.H.J., Faber, M., Vanstaden, E., Oelofse, A. and Aabers, C., 1992. Endemic goitre among undernourished schoolchildren in eastern Caprivi, Namibia. S. Afr. Med. J., 81, 571574.
Marc, V. and Robinson, M., 2007. Assessing the long-term water balance of upland grassland and forestry. Hydrol. Earth Syst.
Sci., 11, 4460.
Milewski, A.V. and Diamond, R.E., 2000. Why are very large herbivores absent from Australia? A new theory of micronutrients. J. Biogeogr., 27, 957978.
Moran, J.E., Oktay, S.D. and Santschi, P.H., 2002. Sources of iodine and iodine 129 in rivers. Water Resour. Res., 38, 19. Muramatsu, Y. and Yoshida, S., 1999. Effects of micro organisms
on the fate of iodine in the soil environment. Geomicrobiol. J.,
16, 8593.
Neal, C., Smith, C.J., Walls, J., Billingham, P., Hill, S. and Neal, M., 1990. Comments on the hydrochemical regulation of the halogen elements in rainfall, stemflow, throughfall and stream waters at an acidic forested area in Mid-Wales. Sci. Total Envir.,
91, 111.
Neal, C., Fisher, R., Smith, C.J., Hill, S., Neal, M., Conway, T., Ryland, G.P. and Jeffery, H.A., 1992. The effects of tree harvesting on stream water quality at an acidic and acid sensitive spruce forested area: Plynlimon, Mid-Wales. J. Hydrol., 135, 305319.
Neal, C., Robson, A.J., Shand, P., Edmunds, W.M., Dixon, A.J., Buckley, D.K., Hill, S. Harrow, M.L., Neal, M. and Reynolds, B., 1997. The occurrence of groundwater in the Lower Palaeozoic rocks of upland Central Wales. Hydrol. Earth Syst.
Sci., 1, 318.
Neal, C., Robson, A.J., Neal, M., and Reynolds, B., 2005. Dissolved organic carbon for upland acidic and acid sensitive catchments in mid-Wales. J. Hydrol., 304, 203220.
Neal, C., Neal, M., Wickham, H., Hill, L. and Harman, S., 2007. Bromine and bromide in rainfall, cloud, stream and groundwater in the Plynlimon area of mid-Wales. Hydrol. Earth Syst. Sci.,
11, 301312.
Phaneuf, D., Cote, I., Dumas, P., Ferron, L.A. and LeBlanc, A., 1999. Evaluation of the contamination of marine algae (seaweed) from the St. Lawrence River and likely to be consumed by humans. Environ. Res., 80, S175S182.
Radlinger, G. and Heumann, K.G., 2000. Transformation of iodide in natural and wastewater systems by fixation on humic substances. Environ. Sci. Technol., 34, 39323936.
Sack, J., Kaiserman, I., Tulchinski, T., Harel, G and Gutekunst, R., 2000. Geographic variation in groundwater iodine and iodine deficiency in Israel, the west bank and Gaza. J. Paediatr.
Endocrinol. Metab., 13, 185190.
Truesdale, V.W. and Jones, S.D., 1996. The variation of iodate and total iodine in some UK rainwaters during 1980-1981. J.
Hydrol., 179, 6786.
Truesdale, V.W. and Smith, P.J., 1975. Automatic determination of iodide or iodate in solution by catalytic spectrophotometry, with particular reference to river water. Analyst, 100, 111123. Warwick, P., Zhao, R., Higgo, J.J.W., Smith, B. and Williams, G.M., 1993. The mobility and stability of iodine-humic and iodine-fulvic complexes through sand. Sci. Total Envir., 130, 459465.
Whitehead, D.C., 1984. The distribution and transformations of iodine in the environment. Environ. Int., 10, 321339. Wilkinson, R.J., Reynolds, B., Neal, C., Hill, S., Neal, M. and
Harrow, M.L., 1997. Major, Minor and trace element composition of cloud water and rain water at Plynlimon, Mid-Wales. Hydrol. Earth Syst. Sci., 1, 557570.
Yuita, K. and Kihou, N., 2005. Behaviour of iodine in a forest plot, an upland field, and a paddy field in the upland area of Tsukuba, Japan: vertical distribution of iodine in soil horizons and layers to a depth of 50 m. Soil Sci. Plant Nutr., 51, 455 467.