HAL Id: cea-01855310
https://hal-cea.archives-ouvertes.fr/cea-01855310
Submitted on 7 Aug 2018
HAL is a multi-disciplinary open access
archive for the deposit and dissemination of
sci-entific research documents, whether they are
pub-lished or not. The documents may come from
teaching and research institutions in France or
abroad, or from public or private research centers.
L’archive ouverte pluridisciplinaire HAL, est
destinée au dépôt et à la diffusion de documents
scientifiques de niveau recherche, publiés ou non,
émanant des établissements d’enseignement et de
recherche français ou étrangers, des laboratoires
publics ou privés.
Synthesis and characterization of Carbon/Nitrogen/Iron
based nanoparticles by laser pyrolysis as non-noble
metal electrocatalysts for oxygen reduction
Henri Perez, Virginie Jorda, Pierre Bonville, Jackie Vigneron, Mathieu
Frégnaux, Arnaud Etcheberry, Axelle Quinsac, Aurélie Habert, Yann Leconte
To cite this version:
Henri Perez, Virginie Jorda, Pierre Bonville, Jackie Vigneron, Mathieu Frégnaux, et al.. Synthesis
and characterization of Carbon/Nitrogen/Iron based nanoparticles by laser pyrolysis as non-noble
metal electrocatalysts for oxygen reduction. Journal of Carbon Research, MDPI, 2018, 4 (3), pp.43.
�10.3390/c4030043�. �cea-01855310�
C 2018, 4, x; doi: FOR PEER REVIEW www.mdpi.com/journal/carbon
Article
1
Synthesis
and
characterization
of
2
Carbon/Nitrogen/Iron based nanoparticles by laser
3
pyrolysis as non-noble metal electrocatalysts for
4
oxygen reduction
5
Henri Perez 1,*, Virginie Jorda 1, Pierre Bonville 2, Jackie Vigneron 3, Mathieu Frégnaux 3,
6
Arnaud Etcheberry 3, Axelle Quinsac 1, Aurélie Habert 1and Yann Leconte 1
7
1 CEA, IRAMIS, UMR NIMBE 3685, F-91191 Gif Sur Yvette, France; henri.perez@cea.fr,
8
virginie.jorda@cea.fr, axelle.quinsac@cea.fr, aurélie.habert@cea.fr,yann.leconte@cea.fr
9
2 CEA-Saclay DRF/IRAMIS//SPEC/LNO 91191 Gif sur Yvette, France; pierre.bonville@cea.fr
10
3 UVSQ, CNRS, UMR 8180, ILV, F-78035 Versailles, France; jackie.vigneron@uvsq.fr,
11
mathieu.fregnaux@uvsq.fr, arnaud.etcheberry@uvsq.fr
12
* Correspondence: henri.perez@cea.fr; Tel.: + 33 1 01 69 08 41 83
13
Received: date; Accepted: date; Published: date
14
Abstract: This paper reports original results on the synthesis of Carbon/Nitrogen/Iron-based ORR
15
electrocatalysts by CO2 laser pyrolysis. Precursors consisted in two different liquid mixtures
16
containing FeOOH nanoparticles or iron III acetylacetonate as iron precursors, being fed to the
17
reactor as an aerosol of liquid droplets. Carbon and nitrogen were brought by pyridine or a
18
mixture of pyridine and ethanol depending on the iron precursor involved. The use of ammonia
19
as laser energy transfer agent also provided a potential nitrogen source. For each liquid precursor
20
mixture, several syntheses were conducted through the step-by-step modification of NH3 flow
21
volume fraction, so-called R parameter. We found that various feature such as the synthesis
22
production yield or the nanomaterial iron and carbon content, showed identical trends as a
23
function of R for each liquid precursor mixture. The obtained nanomaterials consisted in
24
composite nanostructures in which iron based nanoparticles are, to varying degrees, encapsulated
25
by a presumably nitrogen doped carbon shell. Combining X-Ray diffraction and Mossbauer
26
spectroscopy with acid leaching treatment and extensive XPS surface analysis allowed the difficult
27
question of the nature of the formed iron phases to be addressed. Besides metal and carbide iron
28
phases, data suggest the formation of iron nitride phase at high R values. Interestingly,
29
electrochemical measurements reveal that the higher R the higher the onset potential for the ORR,
30
what suggests the need of iron-nitride phase existence for the formation of active sites towards
31
the ORR.
32
Keywords: laser pyrolysis; non-noble metal electrocatalyst; oxygen reduction
33
34
1. Introduction
35
The synthesis of nanoparticles or nanostructures with tailored properties is an important
36
challenge for a wide range of applications such as electronics, photovoltaics, sensors, catalysis and
37
electrocatalysis. The latter domain concerns in particular the sluggish Oxygen Reduction Reaction
38
(ORR). Indeed, a considerable research effort is currently observed over the world, in order to
39
replace the scarce and expensive platinum-based electrocatalysts. Within this frame, early studied
40
materials based on carbon incorporating nitrogen atoms with a transition metal are of particular
41
interest. The development of this kind of materials has been inspired by Jasinky et al [1] who
reported more than fifty years ago the ORR activity of Cobalt Phtalocyanine in basic media. About
43
ten years later Jahnk and co-workers showed that thermal treatments of N4-chelates significantly
44
improved both the stability and the performances of the catalysts [2]. Important step was then
45
achieved by demonstrating that ORR catalysts could be obtained by simply heat-treating a mixture
46
of polyacrylonitrile, metal salt and carbon black [3]. Introduction of ammonia as a nitrogen
47
precursor combined with the use of high specific area carbon and intimate mixing of precursors by
48
ball milling later lead to performances close to those of platinum catalysts [4]. Research on
non-49
noble Fe-N-C electrocatalysts for ORR is still currently very important aiming at the improvement
50
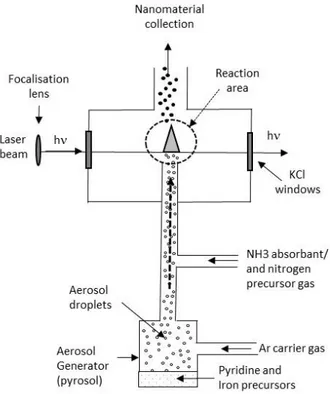
of performances and durability. Recent reviews provide precious compilation of latest
51
developments [5-9].
52
Among the various ways available to synthesize nanoparticles, laser pyrolysis is based on the
53
thermal decomposition of gaseous or liquid precursors through the absorption of a CO2 laser
54
wavelength by at least one component of the precursor mixture [10]. For example, laser pyrolysis
55
has been used for the synthesis of various kinds of materials such as carbides [11-12], nitrides [13],
56
oxides [14-17], or silicon [18], using ethylene, ammonia or silane as both absorbing and precursor
57
compound. Such materials covered numerous applications related to mechanical properties
58
enhancement, photovoltaics, energy storage, labelling for bio-medical application, and sensors. To
59
our knowledge, the only report involving laser pyrolysis regarding non noble metal ORR
60
electrocatalysts concerns the synthesis of Tantalum based carbonitrides and oxycarbonitrides [19].
61
The present paper reports on the synthesis and characterization of nanomaterials containing
62
carbon, nitrogen and iron by CO2 laser pyrolysis that could potentially show ORR capability in
63
acidic medium. The carbon source consists in pyridine that also provides hydrocarbon-based
64
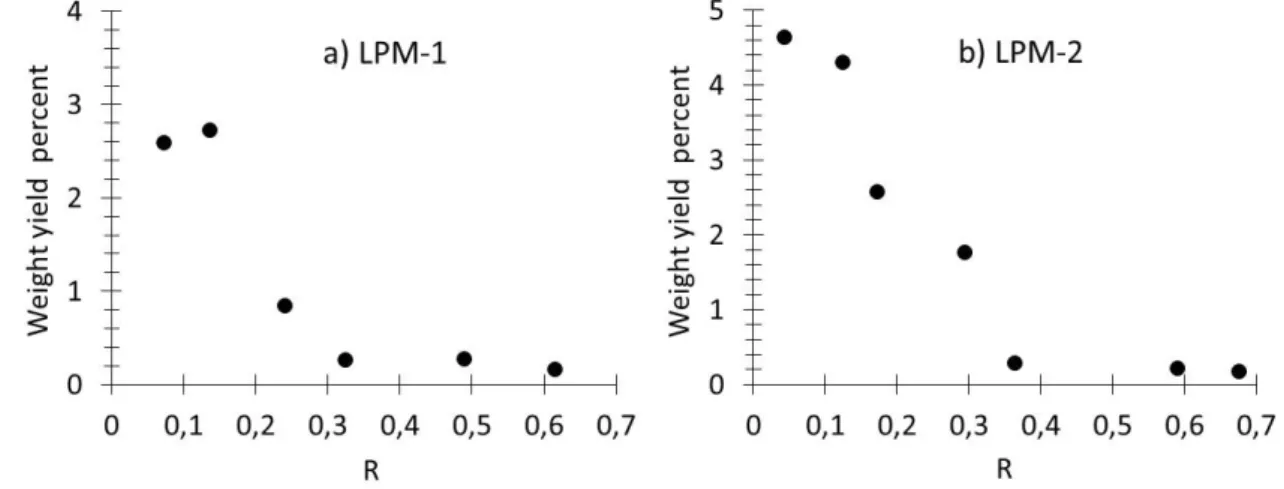
nitrogen source, while ammonia is used as both laser energy absorbent and additional nitrogen
65
precursor. With these carbon and nitrogen sources, we have chosen to investigate two different iron
66
precursors. The first one consists in an iron organometallic compound (iron III acetylacetonate)
67
which is dissolved in pyridine, the second one in iron oxyde–hydroxyde (FeOOH) nanoparticles,
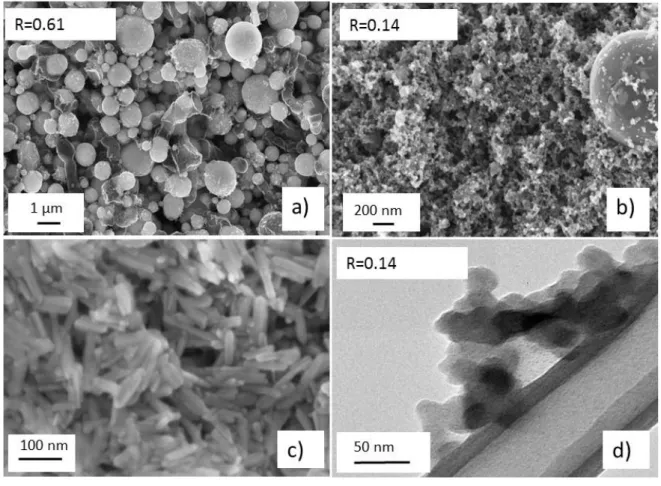
68
commercially available as a dispersion in ethanol, which is further mixed with pyridine. The paper
69
focuses on the trends observed as a function of the ammonia volume ratio (R) involved in the
70
synthesis and provides first electrochemical measurements of the ORR as a function of the latter.
71
2. Materials and Methods
72
2.1. Synthesis
73
Iron III oxide-hydroxyde (FeOOH) elongated nanoparticles suspension in ethanol 20 wt%, iron
74
III acetylacetonate (Fe(C5H7O2)3 referred as Fe(acac)3), and pyridine were purchased from Aldrich
75
and used as received. The CO2 laser (=10.6324 µm) was a 2200 W PRC, SL 2200 (USA). It was used
76
in continuous mode and the laser beam was focused in a horizontal plane by mean of a
77
hemispherical ZnSe lens. The first Liquid Precursor Mixture (referred as LPM-1) involved here is
78
prepared by mixing the commercial FeOOH nanoparticles suspension in ethanol with pyridine.
79
The volume ratio pyridine/ethanol is 50/50 giving a final FeOOH concentration of 25 g.L-1. The
80
second Liquid Precursor Mixture (referred as LPM-2) is an iron III acetylacetonate solution at 14
81
g.L-1 in pyridine. The liquid precursor media were nebulized using a pyrosol® 7901 type
82
piezoelectric aerosol generator from RBI (France).
83
2.2. Characterization
84
X-Ray diffraction was recorded using Cu Kwavelength. Mössbauer absorption spectra were
85
carried out at room temperature with 57Fe isotope and using a commercial Co* :Rh γ-ray source and
86
an electromagnetic drive with linear velocity signal. The different components present in the
87
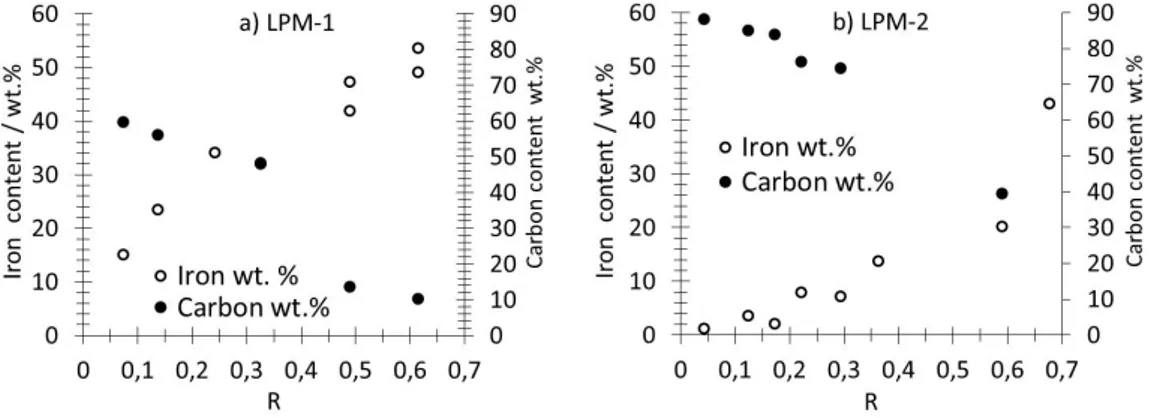
spectra were characterized by their hyperfine field and their isomer shift, which were obtained
88
from the experimental data using a least-squares fitting procedure. The iron content was measured
89
by X-ray fluorescence using a previously described procedure [20] that requires tiny amount of
90
materials : first, a collection of porous deposit of known loading was prepared on carbon felts
(Freudenberg H2415 I2C3) using carbon nanotubes (CNT’s) whose Iron content was previously
92
determined by thermogravimetric analysis. Then a calibration curve reporting the iron K line [20]
93
as a function of the iron content in the CNT’s electrodes was drawn. Second, porous deposit of
94
known loading were prepared on carbon felts with powders synthesized by laser pyrolysis. The
95
calibration curve was then used to convert the recorded iron K line intensity into an iron content.
96
The carbon content was measured using a Horiba carbon analyzer. Specific surface areas were
97
determined by single point BET measurements using a Micromeritics FlowSorb II 2300 instrument,
98
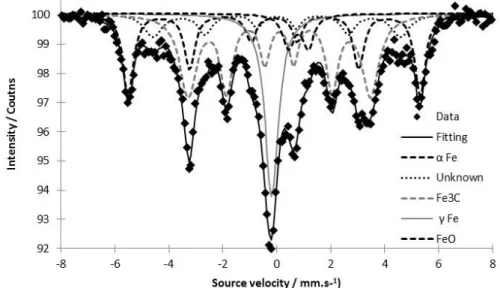
with a gas mixture of 30 vol% N2 in He. The sample was degassed at 250°C for two hours before
99
measurement.
100
2.3. Electrode Preparation and Electrochemical Measurement
101
Cyclic Voltammetry (CV) was recorded using a Bio-Logic VMP3 potentiostat. As described in
102
details in previous papers [20-23], CVs were recorded on porous electrodes prepared on carbon
103
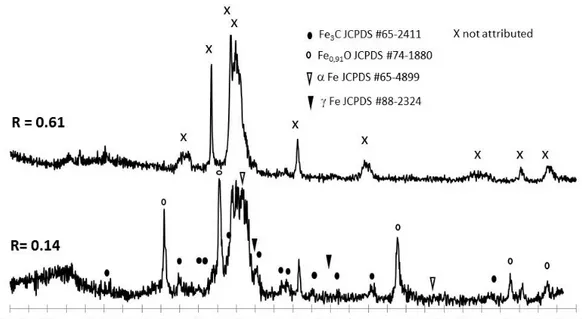
felts (Freudenberg) by filtration of liquid dispersion obtained by powder sonication in isopropanol.
104
Before CV recording, the porous electrodes were submitted to a conditioning step aiming at
105
electrolyte impregnation in the electrode porosity, as previously reported for porous electrodes
106
based on platinum electrocatalysts [21-23] as well as for non-noble electrocatalysts consisting of
107
nitrogen doped carbon nanotubes [20]. For the latter, cycling during the conditioning step resulted
108
in a loss of iron in the electrolyte as revealed by redox peaks that vanished under prolonged cycling.
109
CVs recorded in the present paper during the conditioning step were very similar to those observed
110
with nitrogen doped carbon nanotubes [20]. In the present paper, when such iron loss was
111
observed, it was verified that the oxygen reduction measurements were not affected by iron
112
dissolution by changing the electrolyte after iron loss. Potentials were measured using a
Sodium-113
Satured Calomel Electrode (SSCE radiometer analytical). On the CVs shown in the paper, potentials
114
are reported versus the Standard Hydrogen Electrode (SHE, -0.236 V vs SSCE). The ORR onset
115
potential is determined by the higher potential at which an ORR current is measured on the
116
background corrected cyclic voltametry.
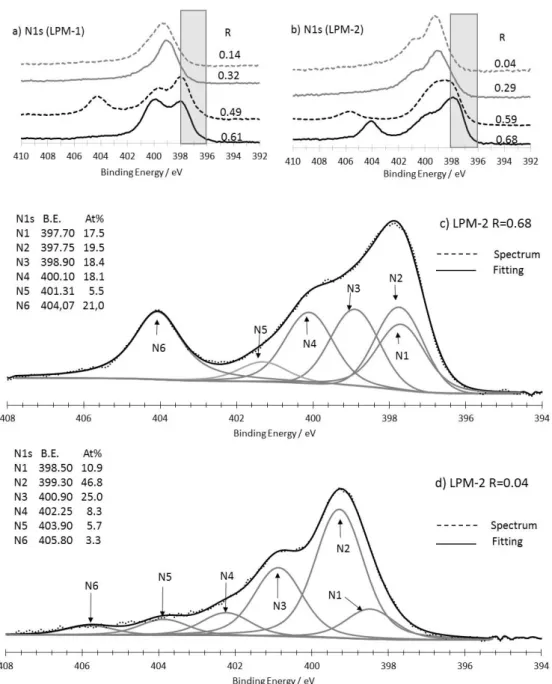
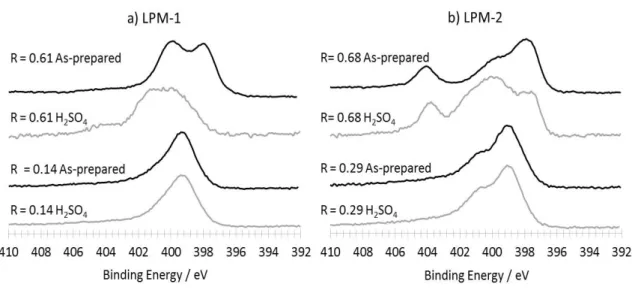
117
2.4. XPS Analysis
118
Surface analysis was performed with a Thermo Electron K-Alpha spectrometer. The X-Ray
119
excitation was the K-alpha aluminum line at 1486.7 eV. A constant analyzer energy (CAE) mode
120
was used for the electron detection (20 eV pass energy value was chosen). The detection of the
121
photoelectrons was perpendicular to the sample surface. This latter consisted in porous electrodes
122
formed by filtration on carbon felts on which a 30 nm gold layer was deposited by vacuum
123
evaporation before the formation of the nanomaterial layer by filtration. This gold deposit prevents
124
the potential collection of carbon and nitrogen photoelectrons from the carbon felt.
125
3. Results
126
3.1. Production, Morphology and Composition Data of the Materials as a Function of R
127
A scheme of the experimental set up is shown in figure 1. It consists in the aerosol generator
128
device (pyrosol®) filled with liquid precursor medium connected to the CO2 laser pyrolysis reactor.
129
Such generator usually produces droplets sizes in the 2 – 10 µm range.
131
Figure 1. Scheme of the experimental set up used in this work.
132
The aerosol obtained from the liquid precursor mixture is driven by argon as carrier gas and
133
is further mixed with ammoniac. It is important to note that in this configuration, even if the NH3
134
flow does not directly take part to the aerosol extraction from the generator, it contributes to the
135
total gas flow once mixed into the mainstream in the nozzle. This means that increasing NH3 flow
136
will accelerate the droplets velocity out of the nozzle and thus decrease their residence time in the
137
laser irradiated zone. The reactor is kept to a pressure of 740 Torr by pumping through a pressure
138
regulating valve and microporous filters (not shown on figure 1) where the products are collected.
139
All the gas flows are controlled by mass flowmeters. This allows parameter R defined by equation
140
(1) to be set and varied over a controlled range.
141
R = NH3 flow / (NH3 flow + Ar flow) (1)
This R parameter is expected to have a strong influence on the synthesis, as NH3 flow
142
modification will consequently affect three main parameters of the reaction. First, as previously
143
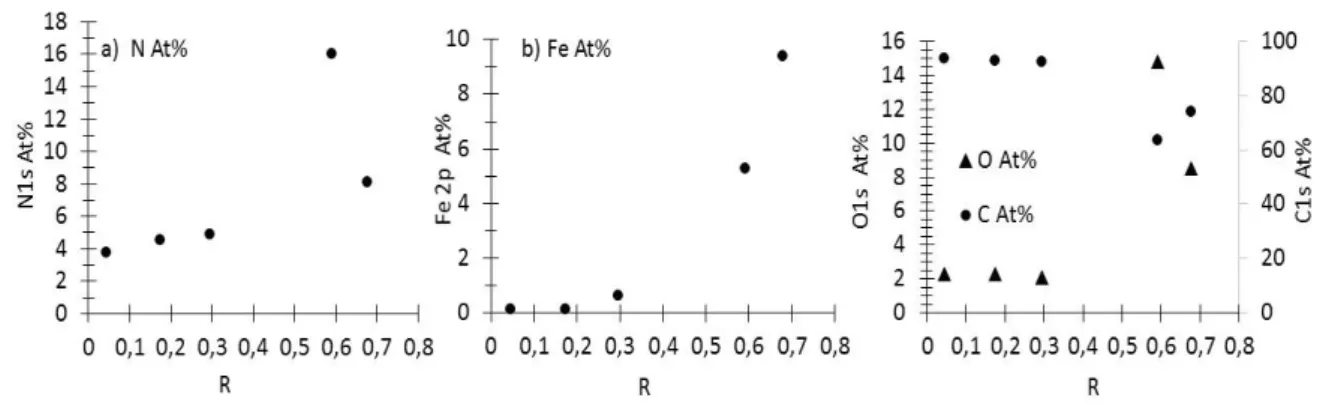
mentioned, it will change the reaction duration through residence time modification. It will also
144
affect the temperature by changing the amount of absorbed laser power (i.e. the amount of energy
145
available for the thermal reaction). Last but not least, it will also modify the chemical composition
146
of the precursor mixture in the reaction. For example, from R= 0.61 to 0.04 the residence time
147
increases by a factor ≈ 2 and the laser power absorption decreases by a factor ≈ 5 while the NH3
148
concentration in reaction media strongly decreases.
149
Several syntheses were thus conducted using for each liquid precursor mixture different R
150
values. The powders were black and more or less sticky for the different syntheses, because of the
151
generation, upon pyrolysis, of side products consisting in low molecular weight organics. To get
152
rid of these side products the collected powders were washed with acetone using a Soxlhet
153
extractor.
154
The amount of liquid precursor mixture was weighted before and after the end of the synthesis
155
in order to determine the precursor consumed mass. Then, taking into account the weight of
156
washed collected powders, chemical yield was estimated. Figure 2 reports the trends observed for
157
this chemical yield as a function of R for both FeOOH (LPM-1) and Fe(acac)3 (LPM-2) precursor
158
systems. It is seen that chemical yields are ranging from 0.15% to 5%, and that the higher Rthe
159
lower the yield.
The powders were systematically characterized by Scanning Electron Microscopy (SEM) and
161
to a lesser extent by Transmission Electron Microscopy (TEM). The most important changes in the
162
morphology of the nanomaterials were found for those produced from LPM-1. As shown in figure
163
3, modification of the R parameter resulted in strong modification of the particle sizes.
164
165
Figure 2. Production yield for different syntheses as a function of the R parameter for a) LPM-1
166
and b) LPM-2
167
For high values of R (0.61, figure 3a) the nanomaterial contains large particles which appear
168
bright on the micrograph, with diameters ranging from 1 µm to few hundreds of nanometers.
169
The material also contains smaller particles, but it was impossible to estimate the ratio between
170
large and small particles populations. EDX analysis achieved on large particles showed that they
171
consist in an iron rich phase. It has been known for a long time that iron acts as a catalyst for
172
hydrocarbon decomposition and in graphitization processes [24]. Consistently, the micrograph
173
(figure 3a) shows that some of the iron based particles are surrounded by a thin layer presumably
174
based on carbon that could be the result of such catalytic effect.
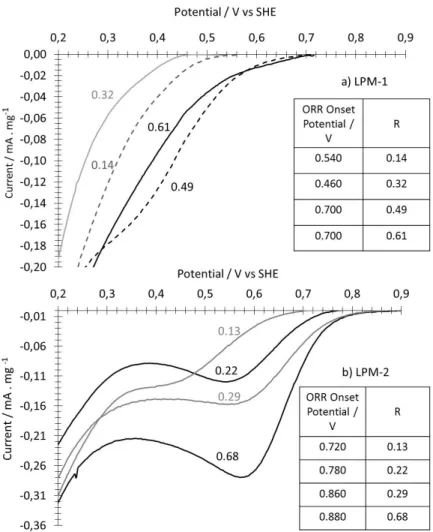
176
Figure 3. Scanning electron microscopy images of nanomaterials obtained from LPM-1: a) R = 0.61
177
b) R = 0.14, c) is the pristine FeOOH nanoparticles used in LPM-1, d) is a TEM image recorded for
178
R = 0.14.
179
Elongated structures of these latter layers are also clearly seen in some part of the sample, with
180
a particle sometimes located at the extremity. These observations suggest, at least partially, a
181
growth phenomenon of carbon based films from the iron-based particles. Finally, it is worth
182
pointing that the morphology of the iron-based particles is completely different from that of the
183
initial FeOOH rod-shaped nanoparticle (figure 3c). This illustrates the strong transformation of
184
these latter during the process.
185
For low R values (figure 3b, R= 0.14) the powder is mostly made of much smaller particles with
186
a diameter of few tens of nm, what is confirmed by TEM (figure 3c). It is worth noting that the TEM
187
micrograph can be compared to figure 3a assuming that dark spots seen in figure 3c are iron based
188
nanoparticles surrounded by a carbon component. Intermediate values of R lead to intermediate
189
situations with the formation of a mixture of large and small nanoparticles.
190
When LPM-2 was used, the trends in the morphology of the materials as a function of R were
191
not as marked as for FeOOH iron precursor. Indeed, in this case large particles are scarce. Specific
192
area was recorded for some of the materials obtained from Fe(acac)3 precursor as a function of R.
193
The decrease of the specific surface area with R value (figure 4) suggests a similar trend as the one
194
observed for materials obtained from FeOOH, i.e. the lower R the smaller the particles.
196
Figure 4. Trend for the specific surface area of the powders as a function of R parameter for
197
materials obtained from LPM-2.
198
Due to low chemical yield, an important part of the samples synthesized in this work was
199
produced in very tiny amounts, limiting the variety of achievable characterization. Therefore,
200
regarding bulk composition investigation, we chose to determine in priority iron and carbon
201
contents. Figure 5 reports the data obtained with each liquid precursor mixture as a function of R.
202
203
Figure 5. Carbon and iron contents as a function of R for nanomaterials prepared using a) FeOOH
204
(LPM-1) and b) iron III acetylacetonate(LPM-2). Empty and filled symbols correspond to iron and
205
carbon contents, respectively.
206
It is seen that the higher the Rparameter the higher the iron content, while the carbon content
207
exhibits the reverse trend (the higher R the lower the carbon content). As expected, the sum of
208
carbon and iron wt.% contents is not 100% since both nitrogen and oxygen are possibly
209
incorporated in the nanomaterials what will be confirmed by XPS analysis (section 3.3). The next
210
section addresses the difficult question of the nature of the iron phases formed during laser
211
pyrolysis.
212
3.2. Tracking the Nature of the Iron Phases
213
As explained above, all the nanomaterials contain iron, and the question about the nature of
214
the formed iron phases raised. Taking into account the elements involved in the synthesis (Fe, C,
215
N, O), the number of possible iron phases is very high: pure metal iron, iron carbides, iron oxides,
216
iron nitrides, carbo-oxynitrides. The task is even more complicated since several phases show
217
different stoichiometry, and non-stoichiometric ones are numerous, in particular for iron nitrides.
218
Mossbauer spectroscopy and XRD measurements were performed in an attempt to get insights on
these iron phases. This was achieved essentially on powders obtained from FeOOH since they have
220
higher iron content, what favors Mossbauer analysis, and contain larger particles what may favor
221
XRD analysis by avoiding too broad overlapped diffraction peaks. An example of Mossbauer
222
spectra fitting is shown in figure 6. It was performed with clearly identified phases, namely Fe,
223
Fe, Fe3C and possibly FeO. An additional component was added to refine fitting, which could not
224
be ascribed at this time. Although incomplete, the results obtained here are precious since they
225
allow three iron phases (Fe, Fe, Fe3C) to be identified, and suggest the presence of a fourth one
226
(FeO). The relative phase content was estimated on the basis of fitting, and showed a variable
227
amount of unknown phase as a function of R parameter (see appendix A for details on Mossbauer
228
spectroscopy data).
229
230
Figure 6. Example of Mossbauer spectra recorded on sample prepared using FeOOH (LPM-1) for
231
R=0.49 and corresponding fitting.
232
XRD was then recorded on powders. It is well known that information provided by XRD
233
analysis might be limited by poor crystallization and small crystallite size, which broaden
234
diffraction peaks. It is worth noting that materials obtained from LPM-2 gave XRD patterns with
235
no clearly defined peak, completely impeding phase identification. Therefore, the XRD data relate
236
here to materials obtained from LPM-1. Figure 7 shows two XRD patterns recorded on powders
237
synthesized with high and low R values. Iron phases identified by Mossbauer spectroscopy are
238
reported on these diagrams for comparison sake. These data are not easy to exploit but comparison
239
of both patterns shows that the regions centered at 2θ 44° are different from each other. Also, the
240
high R pattern exhibits additional unattributed peaks.The modification observed in the XRD
241
pattern at high R cannot be easily attributed to a given phase, but such synthesis conditions clearly
242
favors nitride formation. Indeed, among the diverse synthesis routes leading to nitrides, high
243
temperature treatment of iron precursors under NH3 or under a N2/H2 mixture is widespread [26].
244
In our case, higher concentration of NH3 provides a more nitriding atmosphere and also increases
245
the temperature through CO2 laser absorption.
247
Figure 7. XRD diffraction patterns recorded on powders synthesized using LMP-1 for high and low
248
R values. Phases identified by Mossbauer spectroscopy are indicated on the patterns, together with
249
unattributed peaks.250
3.3. XPS Analysis251
3.3.1. As-prepared Materials252
The XPS analysis was performed on the materials prepared from both iron precursors (LPM-1 and
253
LMP-2). N1s, Fe2p, C1s and O1s core levels were detected in all survey spectra and semi
254
quantitative analysis was conducted. It is worth pointing that analysis performed in different
255
regions of the same sample gave identical data thus ensuring that the XPS analysis reflects
256
nanoparticle feature. The gold deposited on the supporting carbon felt was most often not detected
257
on the survey spectra thus indicating that photoelectron collection originates from the material
258
itself and not from the carbon felt. Later on, the analysis is focused on the N1s core level spectra
259
and semi-quantitative analysis trends. Figure 8 a and b show the N1s spectra recorded with
260
different R values for materials synthesized using LPM-1 and LPM-2. Each of the latter shows a
261
similar marked trend as a function of R, i.e. a marked drop in the intensity in the low N1s energy
262
region of the spectra (396 eV-398 eV) when R decreases. The literature indicates that this low energy
263
region corresponds to iron nitrides or nitrided iron surfaces [27-30]. For each material collection,
264
the spectra recorded for low R are quite similar. In a same way, the ones recorded for high R values
265
appear similar as well, although less markedly for LPM-2. Spectra corresponding to LPM-2 with
266
R=0.68 and R=0.04 were selected as representative of their series and thus considered for tentative
267
peak fitting (figure 8 c and d). The N1s XPS spectrum in carbon based materials such as nitrogen
268
doped nanostructures [31,32], or simply chars generated from model molecules containing nitrogen
269
[33,34],is mainly described as N-graphitic, N-pyridinic, pyrrole-like, and oxidized nitrogen species.
270
In the present work fitting was conducted with a peak Full Width at Half Maximum (FWHM)
271
imposed and set at 1.5 eV. This choice was made using the fitting of the spectra of a reference
272
compound consisting in a polyphosphazen polymer network with two kind of well-separated
nitrogen atoms. This reference spectra (Appendix B) was recorded in the same experimental
274
conditions as those used in this work. The fitting provides 6 components which are labelled from
275
N1 to N6 and ranked in the order of increasing energy. For R=0.68 (figure 8 c) it reveals two
276
components N1 and N2 at low energy 397.70 and 397.75 eV corresponding to 37.0 At.% of the total
277
nitrogen atoms which lies in the binding energy range reported for iron-nitride species. N3 is found
278
at 398.9 eV with 18.4 At.% and falls in the energy range of pyridinic nitrogen. N4 is found at 400.1
279
eV and weighted 18.1 At.%, it falls in the range of pyrrole-like nitrogen. The N5 component at 401.3
280
eV with 5.5 % At.% can be attributed to graphitic nitrogen. The last component N6 (404.7 eV / 21.0
281
At.%) corresponds to oxidized nitrogen [31-33,35]
282
The same fitting procedure performed for R=0.04 does not result in a contribution which could be
283
attributed to iron nitride since the N1 component is now centered at 398.5 eV (10.9 At.%), while N2
284
appears at 399.3 eV (46.8 At.%), N3 at 400.9 eV(25.0 At%), and N4 at 402.25 eV (8.0 At.%). N5 and
285
N6 appear now at 403.9 eV (5.7At.% ) and 405.8 eV (3,3 %), respectively. Therefore N1 is now
286
attributed to N-pyridine, N6 and N5 are still attributed to oxidized nitrogen although such a high
287
binding energy for N6 (405.8 eV) can also be attributed to entrapped gaseous nitrogen [36]. The
288
attribution of N2 (399.3 eV) component is more difficult, since nitrogen types such as those found
289
in pyridone, amine, nitroso or nitrile may be found in this region [31,37]. However, N2 is also lying
290
in the range of binding energy recognized for FeNx sites that correspond to nitrogen as a ligand for
291
iron [38]. N3 located at 400.9 eV and weighted at 25 At.% falls in the range of pyrrole-like nitrogen
292
. N4 is now located at 402.25 eV and falls in a binding energy region being attributed possibly to
N-293
O type species [39],while graphitic nitrogen is also proposed as possible [33, 39-41].
294
295
296
Figure 8. a) and b) N1s core level features as a function of R for a) LPM-1 and b) LPM-2. Grey area
297
show the binding energy region in which nitride iron can be found. Intensities are normalized. c)
298
and d) are tentative peak fitting for LPM-2 at c) R=0.68 and d) R=0.04. Fitting components are
299
labelled N1 to N6 and relative weights and binding energies are listed in the figures.
300
Finally the main points suggested by the tentative peak fitting is that at high R iron nitride
301
could be present in significant amount (37.0 At.%), as well as pyridinic nitrogen (18.4%). Graphitic
302
nitrogen content is about 5.5 At%. In contrast at low R, no iron nitride can be found. The pyridinic
303
nitrogen content is only 10.9 At.%. The major contribution is clearly seen at 399.3 eV, in an energy
304
range close to those reported for FeNx sites, but which can also correspond to amines, nitriles or
305
nitroso nitrogen atoms. The attribution of one of the components to graphitic nitrogen is unclear.
306
307
The N1s spectra shown in figure 8 and tentative peak fitting suggest that nitrided iron is
308
possibly formed when high Rvalues are used. This point actually appears reinforced by
semi-309
quantitative analysis results (figure 9).
311
Figure 9. Trends for the XPS semi-quantitative analysis for powders obtained from LMP-2 as a
312
function of R parameter. a) N1s, b) Fe2p, c) O1s and C1s.
313
Indeed, elements contents for N1s, Fe2p, C1s and O1s were drawn as a function of R parameter
314
and showed marked trends: N and iron contents increase with R (figure 9 a and b) while carbon
315
and oxygen contents show reverse trend from each other (figure 9 c), i.e. oxygen content increases
316
and carbon content decreases with higher R.Data in figure 9 relate to materials synthesized with
317
Fe(acac)3 (LMP-2), but the observed trends for powders derived from LPM-1 are similar.
318
It is worth noting that for iron and carbon, surface analysis and bulk analysis show the same
319
trends as a function of R. Finally, the assumption suggested in the previous section seems
320
reinforced by the surface analysis results, i.e. the formation to some extent of an iron phase
321
containing nitrogen at high ammonia fraction. The oxygen content increases with R while carbon
322
content decreases. The reason for this might be surface oxidation of iron-based particles not (or only
323
partially) covered by carbon, especially in powders where nitrogen is assumed to be significantly
324
combined with iron. In an attempt to get additional information on the nature of the iron phase
325
formed during the process, acid leaching treatments were performed with sulfuric acid.
326
3.3.2. Characterization of the Materials Obtained from LPM-1 After Acidic Treatment
327
Acidic treatments (24 h in 1M H2SO4) were performed on some of the powders obtained from
328
LMP-1 and XRD pattern was subsequently recorded (figure 10).
329
330
Figure 10. XRD pattern of sample obtained from LPM-1 after acid leaching for R=0.14 and 0.61.
331
For the highest R value, the iron nitride Fe3N1.3 is present while for lowest R value the low
332
nitrogen content phase FeN0.056 is identified. These observations are in good agreement with the
above-mentioned suggestion of iron nitride phases formation at high R, and with the trends
334
recorded on the N1s XPS data for as-prepared materials as well.
335
336
Figure 11. XPS N1s core level spectra for powders obtained from a) LPM-1 and b) LPM-2 before
337
and after H2SO4 treatment, for low and high R values. Intensities are normalized.
338
Figure 11 shows the N1s spectra for FeOOH and Fe(acac)3 precursors derived powders before
339
and after H2SO4 treatment for high and low values of R. In contrast with materials prepared with
340
lower R value, strong modification of the spectra is induced by acidic treatment for both FeOOH
341
and Fe(acac)3 precursors and for high R. Indeed a clear drop in the intensity is observed in the low
342
N1s core level energy region of the spectra (397-398 eV) possibly related to iron-nitride or nitrided
343
iron. As expected, acidic treatment resulted in a drop of the iron content in the materials as
344
indicated by X-Ray fluorescence measurements. Data provided by XPS semi-quantitative analysis
345
are reported in table 1 for FeOOH and Fe(acac)3 derived samples at high and low R.
346
Table 1. XPS nitrogen and iron content for materials prepared from FeOOH (LMP-1) and Fe(acac)3
347
(LMP-2) for high (white areas) and low (grey areas) R parameter.
348
349
It is seen that for high R acid leaching results in concomitant loss of nitrogen and iron. At low
350
R the nitrogen loss is low, consistently with the small changes observed in the N1s core level spectra
351
(figure 11). The N1s spectra modifications in figure 11 require additional comments. The loss of
352
iron results from H2SO4 dissolution of iron based particles, what can indeed only append for
353
particles that are accessible to acid solution. With that respect it is worth pointing that in spite of
354
considerable spectral and composition changes the material obtained from LMP-2 at high R still
shows a significant contribution in the low energy N1s region, which is thought to originate from
356
iron nitride like contribution. The reasons for this might be an insufficient duration for H2SO4
357
treatment, or the fact that some iron nitride-like phases are covered by a very thin carbon based
358
component that allows photoelectron collection from the inner particle surface but impedes acid
359
attack.
360
4. Preliminary Oxygen Reduction Study
361
Electrochemical measurements on porous electrodes prepared from LPM-1 derived materials were
362
hard to achieve, presumably because of the high iron content and the presence of large iron based
363
particles. Indeed, immersion in the acid electrolyte resulted in a significant gaseous production
364
what led to a strong degradation of the layer homogeneity and detachment from the carbon felt.
365
Such difficulties were quite rare for electrodes prepared with materials obtained from LPM-2.
366
Nevertheless, cyclic voltammetry was recorded on porous electrodes at 5 mV.s-1 in HCLO4 1M for
367
materials synthesized with different R values from LPM-1 and LPM-2. Background current
368
correction was performed by subtracting CVs recorded in argon saturated electrolyte from those
369
recorded in oxygen saturated electrolyte. ORR catalyst efficiency was evaluated using the onset
370
potential for the ORR shown by the CVs.
371
372
Figure 12. Cyclic voltammetry recorded on porous electrodes prepared from materials synthesized
373
with LMP-1 (a) and LPM-2 (b) in HClO4 1M at 5mV.s-1. The inserted tables report the R values and
374
the corresponding onset potentials for the ORR.
375
Figure 12 a) relates to LPM-1, for which it is seen that the onset potential for the ORR does not
376
strictly rank the Rvalue, although it can be seen that the two materials with the two lowest R values
377
exhibit much poorer performances when compared to the ones with highest R values. Actually the
response recorded for R=0.14 and 0.32 are quite close to those recorded on the carbon felt support
379
itself. Figure 12b) shows the data related to LPM-2, for which a marked trend is observed i.e. the
380
higher the R parameter the higher the ORR onset potential. Finally, these data strongly suggest a
381
direct influence of the R parameter on the performances of the ORR electrocatalysts synthesized by
382
the CO2 laser pyrolysis method.
383
5. Discussion
384
This discussion session addresses the trends observed for the different feature of the materials,
385
particle morphology, yield and composition, and finally electrochemical performances, in
386
particular as a function of R. It must be mentioned that we are sometimes reduced to making
387
hypothesis since we have no direct indication that support a given explanation rather than another
388
one.
389
390
Particle Size And Morphology :
391
The particle size and morphology obtained is this work can be discussed in the frame of
well-392
documented literature related to the formation of nanoparticle materials in gas-fed flame synthesis
393
and flame spray pyrolysis (FSP) methods [42-46]. Indeed both methods involve the thermal
394
decomposition of a precursors flow (gas or atomized liquid) in a flame provided by the combustion
395
of a fuel. These methods are characterized by particular synthesis conditions which can be
396
summarized as follow: temperature as high as 3000 °C, short resident time of the precursors (< 1s),
397
rapid cooling of the materials after formation. These features are to some extent similar to the ones
398
encountered in laser pyrolysis, and enable the comparison in terms of nanoparticles growth
399
mechanisms. Discussion on the morphology and size of the particles reported in this paper
400
necessitates the different scenarios of particle formation in flame synthesis to be briefly described.
401
Thermophoretic sampling along the flame in gas-fed synthesis conditions for microscopy
402
observation triggered the understanding of particle formation [47], what finally resulted in the
403
following description for gas-fed flame synthesis processes [42-46]:
404
405
- Heating decomposes precursors to monomers which upon saturation grow by molecular
406
coagulation or nucleation, to critical/primary particles.
407
-Surface reaction of monomers on primary particles can contribute to their growth, while
408
evaporation/sublimation contribute to particle size decrease and forming monomers again.
409
- Further coagulation and/or coalescence process between primary particles may also
410
contribute to nanoparticles growth.
411
412
Finally, depending on the temperature value and profile, the final morphology can consist in
413
individual spherical particles, agglomerated particles, or aggregated particles when primary
414
particles form necks between them.
415
When FSP is involved, additional phenomena related to the drying of aerosol liquid droplet
416
influence the morphology [45]. One can briefly summarize the various pathways as follows:
417
1) Complete evaporation of droplet and solute, leading to the gas-fed flame particle formation
418
scenario
419
2) Solute precipitation in the droplet and reaction with surrounding reactants, ending in
420
sintering of small grains to form particles in the range of µm size.
421
3a) Surface precipitation of solute in the droplet, followed by reaction with surrounding
422
species in gas phase and gentle drying, leading to the formation of large hollow particles
423
Or, 3b) drying/melting allowing fragmentation/evaporation towards above mentioned gas-fed
424
flame particle formation scenario.
425
426
To summarize the main parameters influencing particle size and morphology, it can be
427
pointed that short resident time, high temperature and fast cooling rates reduce the particle size
428
and the extent of the aggregation. Of course, this main trends can be significantly modulated by the
feature of the solvent (here the liquid precursor) from which droplet are formed, as well as the size
430
of the droplet (in the range of few µm to 10 µm for the Pyrosol aerosol generator), the feature of the
431
solute (melting temperature), its concentration in the solution...
432
We can now comment on the size and morphology of the products we obtained in this work,
433
although at this time only assumptions can be made, based on the above-mentioned pathways
434
described for gas/liquid flame synthesis methods. It is also important to remind that for laser
435
pyrolysis, the chemical composition of the effective precursor media through ammonia
436
concentration is not disconnected from the temperature conditions. Indeed, as mentioned before,
437
changing the ammonia flow modifies the CO2 laser absorption and therefore the energy
438
(temperature) provided to the precursors.
439
First, it is seen that materials produced from LPM-1 (FeOOH particles as iron precursor) show
440
marked changes as a function of R. At high R the population of individual large particles (few
441
hundreds nm to few µm diameter) dominates. High R values correspond to higher temperature
442
(high laser absorption) and short residence time as explained in section 3.1). This result contrasts
443
with the scenario of gas-fed flame situation which favors in such conditions small primary particles.
444
Therefore one may assume that for high R values and LPM-1 the favored pathway for particle
445
formation is the one described in point 2), i.e., solute precipitation in the droplet and reaction with
446
surrounding reactants, then ending by sintering, and producing particles in the range of µm size.
447
These particles might be still hot enough for a given time to promote on their surface the formation
448
of carbon/nitrogen doped shell (figure 3a). Such a scenario is confirmed by scanning electron
449
microscopy images (Appendix B) recorded on acid leached materials synthesis with LPM-1 at high
450
R. The micrograph clearly shows films resulting from acid leached iron-based particles.
451
For LPM-2 the trends observed as a function of R for averaged particle size is suspected to be
452
the same as for LPM-1 since specific surface decreases when R increases (figure 4). Scanning
453
electron microscopy at high R values shows the presence of large particles, but not majority. The
454
differences observed between LPM-1 and LPM-2 could reflect the footprint of aerosol droplet
455
transformation during the process taking into account the following points: i) the concentration of
456
iron precursor in LPM-1 is higher (25 g.L-1 what correspond to a concentration of 15,7 g.L-1 of pure
457
iron) than in LPM-2 (14g.L-1, i.e. 2.21 g.L-1 of pure iron) ii) melting points for FeOOH is 350°C while
458
it is much lower for Fe(acac)3 (180°C). Therefore, it is likely that for the same R value (i.e. similar
459
flame temperature) larger iron-based particle should form in the case of LPM-1 due to higher Fe
460
concentration. Compared to high R value, low R conditions result in lower temperature and longer
461
resident time. Our results show that low R values favor the formation of small sized (few tens of
462
nm in diameter, see figure 3d) and aggregated particles for both, LPM-1 and LPM-2. Such a result
463
could be tentatively explained in both cases as follows: the residence time being longer and the
464
temperature being still high enough, pathway 3b) involving drying/melting and
465
fragmentation/evaporation leading to gas-fed flame synthesis conditions may occur. Finally, it is
466
worth noting that the morphology of the materials as discussed here, focusses on the iron-base
467
particle formation that promotes carbon based shell growth. However, this does not prevent
468
possible homogeneous formation of carbon based nanoparticles independently of iron-based
469
phases.
470
471
Chemical Yield And Composition:
472
The data recorded here show that the chemical yield of the synthesis decreases when R
473
increases. Such a trend could be tentatively explained by the fact that chemical yield is essentially
474
driven by the formation of the iron-based phase through the trends observed for the size of the
475
particles. Indeed, if iron-based particles diameter decreases with R, the overall area they provide
476
for catalytic growth of carbon phase strongly increases, thus favoring the increase in the overall
477
chemical yield. The same argue holds at high R (bigger particles offer a lower area). At high R this
478
surface area effect, that lowers the chemical yield in this case, could be accompanied by chemical
479
effect related to iron nitride formation. Such a chemical effect looks consistent with literature
480
dealing with nitrogen doped carbon nanotubes growth. Indeed, all things equal otherwise, it is
reported [48] that the addition of NH3 at various concentrations drops the growth rate of N-doped
482
carbon nanotubes by a factor 2 to 7 when compared to undoped ones.
483
Regarding composition of the materials, for both LPM-1 and LPM-2 a clear trend is also
484
observed for bulk composition and surface composition (XPS) as a function of R. The higher R, the
485
lower the carbon content and the higher the iron content for bulk composition. The same trends are
486
observed for surface composition which also indicates that the nitrogen content in the material
487
increases with R value. The trends observed for carbon and iron content could originate from size
488
effect and/or chemical effect suggested above for chemical yield trends. For nitrogen content that
489
increases with R, one may suggest the role of iron-nitride phase formation promoting the
490
incorporation of nitrogen in the carbon phase of the material.
491
492
Oxygen Reduction Performances :
493
Preliminary results on the electrochemical activity of the materials synthesized in this work
494
appear quite promising. In the literature dealing with the kind of electrocatalysts involved here,
495
the pathway leading to the formation of the active sites for ORR appears not well understood.
496
Furthermore, the nature of the active sites is still strongly debated. Different views conflict with
497
each other, and for example, some authors reported that iron species coordinated with nitrogen in
498
various configuration referred as FeNx or FeNxCy are mainly responsible for the electrochemical
499
activity [49-51], while others showed that iron-free electrocatalysts with CxNy sites have significant
500
activity [52-53]. Furthermore, recently, the ORR activity of iron based (Fe3C) core-shell particles in
501
which no nitrogen atoms are incorporated in the carbon shell was also reported [54]. Actually, the
502
situation is even more complicated by the fact that a given electrocatalyst most probably contains
503
different kind of actives sites towards the ORR. Such issues are indeed out of the scope of this paper.
504
We showed that the most active materials are obtained for high Rvalues. This is observed for both
505
kind of materials (LPM-1 and LPM-2), although the trend for ORR activity as a function of R is less
506
marked for LPM-1. It is worth reminding that the trends as a function of R for the whole set of
507
characterization performed on both material are exactly the same. Besides, the most active materials
508
towards the ORR have the highest initial iron content and they retain a significant iron content in
509
spite of acid leaching. Therefore, we believe that the active sites responsible for the ORR activity
510
are presumably related to the initial iron content in the materials. The iron nitride phases formed
511
at high R are not directly involved in the ORR activity because they are not stable in acidic media.
512
However, the X-Ray diffraction recorded after acid leaching (figure 10) suggests that iron nitride
513
particles are surrounded by a carbon shell which protects the core from acid leaching. Finally, it
514
can be tentatively assumed that the active site formation in our materials is related to iron nitride
515
phases, as already reported for the same family of materials addressed here, [55]. In this work
516
authors also show that acid leaching resulted in a moderate loss of activity.
517
The parameters that influence the activity are thus related to the nature and amount of the
518
active sites, but also to the specific surface area of the materials. Indeed, the higher the specific
519
surface area the higher the volume density of active sites in the catalyst layer and thus the ORR
520
activity. In the literature, materials that show the highest ORR performances have specific surface
521
areas in the range of several hundred m2.g-1 [5]. Our data show that the most active materials
522
obtained for high R values exhibit the lower specific surface area (Figure 4), and the higher surface
523
nitrogen content. As a result one may suggest that key parameters affecting the catalyst activity in
524
this work is not related to particle size but rather to the kind of nitrogen sites formed in the carbon
525
phase and to the amount of nitrogen species present at the surface of the particles. In this work, the
526
only data potentially giving indication on the type of nitrogen sites presents in the material are the
527
N1s XPS spectra shown is figure 8. The information given by the tentative peak fitting (figure 8 c
528
and d) suggest that the most active material exhibits the highest nitrogen content and the highest
529
content in pyridinic and graphitic sites which are responsible for ORR activity. Indeed, in the most
530
active material (figure 12 b, R=0.68) obtained here, the N1s peak fitting (figure 8 c) does not clearly
531
suggest the presence of FeNx sites expected in the 399.3-399.9 eV region. For the lowest R value the
most important component N2 at 399.3 eV (figure 8d, R=0.04) is most probably not related to FeNx
533
sites since the material exhibit a poor ORR activity.
534
The onset ORR potential which has been used here to rank the activity of the different
535
materials is explicitly mentioned and used in the literature as one of the significant criterion to
536
evaluate ORR performances [56] and finally, the highest ORR onset potential recorded in this work
537
is 0,880 V vs SHE. This is lower than the best performances reported in the literature for the kind
538
of catalysts considered here, for which onset potentials in the range of 0.900 to 0.950 V are reported
539
[5-56]. Such high performances have been obtained thanks to modification of synthesis processes,
540
which include together or separately, the use of template components in the precursors, ball milling
541
step, and thermal treatments under inert gases or ammonia. With that respect, it looks clear to us
542
that our results are quite encouraging since our elaboration process implies few synthesis steps and
543
quite simple liquid precursor media. Current work is now aiming at improving the chemical yields
544
through precursor modification, as well as improving the understanding and control of the
545
synthesis key parameters in order to improve the performances of the non-noble electrocatalysts
546
towards the ORR.
547
548
549
6. Conclusions
550
In this paper we have reported the synthesis and characterization of non-noble metal ORR
551
electrocatalysts based on carbon, nitrogen and iron by laser pyrolysis, using two different iron
552
precursors. The features of the materials show a monotonic behavior when drawn as a function of
553
the so-called R parameter, which is the ammonia flow volume fraction involved in the synthesis.
554
The materials were characterized using different methods and surface analysis of the materials
555
advantageously completed the information recorded on bulk materials. In particular, the N1s core
556
level spectra as well as the semi quantitative analysis tend to confirm the higher R the higher the
557
amount of iron nitride-like phase formed. This point appears comforted by the comparison of the
558
XPS and XRD data recorded for as-prepared materials and acid leached ones. Preliminary
559
evaluation of the ORR by cyclic voltammetry indicates that the performance is improved when the
560
R parameter is increased. Based on these trends and those recorded regarding the whole set of
561
characterization, it can be tentatively suggested that iron nitride formation during the CO2 laser
562
pyrolysis favors the formation of active sites for the ORR in these non-noble electrocatalysts.
563
Current work is dealing with the development of this new approach consisting of using CO2 laser
564
pyrolysis for the synthesis of carbon/nitrogen/iron based non-noble electrocatalysts, and will be the
565
subject of coming reports.
566
Author Contributions: Henri Perez proposed and guided this research, and wrote the paper. Virginie Jorda,
567
recorded XRD experiments and performed data analysis with Henri Perez. Pierre Bonville recorded the
568
Mossbauer experiments and aided with Virginie Jorda the data treatment and interpretation. Jackie Vigneron,
569
Mathieu Frégnaux, and Arnaud Etcheberry carried out the XPS experiments and aided interpretation and data
570
treatment with Henri Perez. Axelle Quinsac, Yann Leconte, Henri Perez and Virginie Jorda were involved in
571
laser the pyrolysis syntheses. Henri Perez and Virginie Jorda processed the as-prepared materials, prepared
572
porous electrode elaboration and performed electrochemical measurements. Virginie Jorda determined carbon
573
content on powders and recorded X-Ray fluorescence measurements. Aurélie Habert recorded scanning
574
electron microscopy and contributed to BET measurements with Virginie Jorda.
575
Acknowledgments: This work has been supported by the Region Ile-de-France in the framework of DIM
576
Nano-K.
577
Conflicts of Interest: The authors declare no conflict of interest.
578
579
580
581
Appendix A
582
Supporting information related to Mossbauer spectroscopy:
583
The table below reports the parameters involved in the fitting of the spectra shown in figure
584
6, for the identified phases, consistently with data reported in the literature [57-59]
585
Hyperfine field – H(T) Isomer shift mm.s-1 Area %
Fe 33.59 0.02 24.3 Fe _ -0.056 16.5 Fe3C 20.90 0.196 42.8 FeO _ 0.897 5.0 Unknown phase 28.33 0.11 11.4 Appendix B
586
Reference spectra of polyphosphazen used to set the peak Full Width at Half Maximum (FWHM)
587
at 1.5 eV.588
589
Appendix C590
Scanning electron microscopy image of a sample obtained from LPM-1 at R= 0.61 after acid
591
leaching. It shows collapsed carbon films resulting from the elimination of iron-based particles.
592
White spots in some part of the image are iron-based particles protected from acid leaching by
593
carbon shell.
594
595
596
597
References
598
1. Jasinski, R.; A New Fuel Cell Cathode Catalyst Nature 1964, 201, 1212-1213
599
2. Jahnke, H.; Schönborn, M.; Zimmermann, G. Organic dyestuffs as catalysts for fuel cells. Top. Curr.
600
Chem. 1976, 61, 133–181.
601
3. S. Gupta, D. Tryk, I. Bae, W. Aldred, E. Yeager, Heat-treated polyacrylonitrile-based catalysts for oxygen
602
electroreduction. Journal of Applied Electrochemistry. 1989, 19, 19-27
603
4. Lefèvre, M; Proietti, E.; Jaouen, F.; Dodelet, J-P. Iron-Based Catalysts with Improved Oxygen Reduction
604
Activity in Polymer Electrolyte Fuel Cells. Science 2009, 324, 71-74. doi: 10.1126/science.1170051
605
5. Shao, M.; Chang, Q.; Dodelet, J-P.; Chenitz, R. Recent advances in electrocatalysts for oxygen reduction.
606
Chem. Rev. 2016, 116, 3594-3657. doi:10.1021/acs.chemrev.5b00462
607
6. Masa, J.; Xia, W.; Mulher, M.; Schuhmann, W. On the role of Metals in the Nitrogen-doped carbon
608
electrocatalyst for oxygen reduction. Angew. Chem. Int. Ed. 2015, 54, 10102-10120. doi:
609
10.1002/anie.201500569
610
7. Wu, G.; and Zelenay, P. Nanostructured Nonprecious Metal Catalysts for Oxygen Reduction Reaction.
611
Account for Chemical research 2013 46, 1878–1889. DOI: 10.1149/1.3210598
612
8. Dombrovskis, J.K.; Palmqvist, A.E.C. Recent progress in synthesis and evaluation of non-Precious Metal
613
catalysts for the Oxygen Reduction Reaction. Fuel Cells 2016, 16, 4-22. DOI: 10.1002/fuce201500123
614
9. Liu, J.; Li,E.;Ruan, M.; Song, P.; Xu, W. Recent Progress on Fe/N/C Electrocatalysts for the Oxygen
615
Reduction Reaction in Fuel Cells. Catalysts 2015, 5, 1167-1192. Doi:10.3390/catal5031167
616
10. Russel, D. K.; Infrared laser powered Homogeneous pyrolysis. Chem. Soc. Rev. 1990, 19, 407-437. doi:
617
10.1039/CS9901900407
618
11. David, B.; Scheneeweiss, O.; Pizurova, N.; Klementova, M.; Bezdicka, P.; Alexandrescu, R.; Dimitrache,
619
F.; Morjan, I. Fe3C nanopowder synthesized by laser pyrolysis and its annealing behavior. Surf. Interface.
620
Anal. 2006, 38, 482-485. doi 10.1002/sia.2277