HAL Id: hal-02326257
https://hal.archives-ouvertes.fr/hal-02326257
Submitted on 25 Oct 2019
HAL is a multi-disciplinary open access archive for the deposit and dissemination of sci-entific research documents, whether they are pub-lished or not. The documents may come from teaching and research institutions in France or abroad, or from public or private research centers.
L’archive ouverte pluridisciplinaire HAL, est destinée au dépôt et à la diffusion de documents scientifiques de niveau recherche, publiés ou non, émanant des établissements d’enseignement et de recherche français ou étrangers, des laboratoires publics ou privés.
Synthesis and properties of multiscale porosity TiC-SiC
ceramics
A. Baux, L. Nouvian, K. Arnaud, S. Jacques, T. Piquero, D. Rochais, P.
David, Georges Chollon
To cite this version:
A. Baux, L. Nouvian, K. Arnaud, S. Jacques, T. Piquero, et al.. Synthesis and properties of multiscale porosity TiC-SiC ceramics. Journal of the European Ceramic Society, Elsevier, 2019, 39 (8), pp.2601-2616. �10.1016/j.jeurceramsoc.2019.02.031�. �hal-02326257�
Available at:https://doi.org/10.1016/j.jeurceramsoc.2019.02.031
Synthesis and Properties of Multiscale Porosity TiC-SiC Ceramics
A. Baux1, L. Nouvian1, K. Arnaud1, S. Jacques1, T. Piquero2, D. Rochais2, P. David2, G.
Chollon1
1 Laboratoire des Composites Thermostructuraux
UMR 5801 (CNRS-CEA-Safran-Univ. Bordeaux), 3, allée de La Boétie, 33600 Pessac, France
2 CEA-DAM, Le Ripault, 37260 Monts, France
Abstract: A process combining the pyrolysis of a lignocellulosic structure and reactive gas
treatments has been developed to prepare porous TiC-SiC ceramics for solar receivers. The natural micro-porosity of balsa was complemented by a high open macro-porosity by laser cutting a periodical arrangement of parallel channels. The lignocellulosic structure was first pyrolysed into carbon. This reactive carbon material was then converted into TiC by Reactive
Chemical Vapor Deposition (RCVD) using TiCl4/H2. After controlling the absence of cracks
due to volume changes, the TiC structure was finally infiltrated by the Chemical Vapor
Infiltration (CVI) of SiC using CH3SiCl3/H2. The density, porous structure, elemental and phase
compositions, oxidation behavior and crushing strength were assessed after pyrolysis, RCVD and CVI. The SiC CVI coating significantly improves the compressive strength, the oxidation resistance and the thermal properties. The SiC layer is no longer fully protective at high temperature but the mechanical properties remain reasonably high.
Keywords: Solar Power, Biomorphic Ceramics, RCVD, CVI, TiC, SiC
1. Introduction
The increasing problem of CO2 emissions and energy security concerns such as nuclear safety,
radioactive waste management and resource dependence, have given interest in alternative sources of energy. Solar energy is unlimited and clean, and Solar Thermal Power Plants (STPP) with optical concentration are particularly good candidates for providing a clean and renewable source of energy [1,2]. In SSTP, energy transfer from solar radiation to the cooling fluid (typically air) is achieved by solar receivers (Fig 1).
The most common types of receivers are tubular liquid and volumetric air receivers [3]. For the first ones, light absorption occurs at the outer surface of dark tubes inside which the transfer
fluid flows, the heat being transferred through the tubes walls [4]. In the volumetric receivers, the radiated energy and the heat transfer fluid both pass through the porous material. The high open porosity and the internal surface area allow the solar energy to be absorbed and transferred to the fluid, in the volume. Volumetric receivers with a proper choice of porous structure and solid constituent can collect a solar radiation power that is significantly higher than tubular receivers [5]. These high open porosity and specific surface materials can be for instance monolith honeycomb structures [6,7], isotropic reticulated foams [7-11] or non-extrudable 3D periodic lattices [10]. The diameter of the channels or pores typically ranges from 0.5 to 5 mm. While foams usually exhibit a higher permeability, architectures with parallel channels have higher strength and stiffness [12]. The solid material constituting the porous structure must resist high operating temperatures in air (typically around 1000 °C, but up to 1200-1300 °C [4,6,8]) and supposedly for very long periods of time. It has also to be dark to absorb light and to resist thermal shock and thermal gradients, i.e. to have a low coefficient of thermal expansion (CTE) and a high thermal conductivity. These strict requirements rule out oxides and suggest silicon carbide (SiC), which is still considered as the reference material for the application. SiC-based honeycombs and foams have the advantage of being commercially available and they have soon been considered for the design of volumetric solar receivers [4,6,7,11,13-15]. Honeycomb structures are strongly anisotropic and very regular due to the extrusion process. The high density of the sintered SiC body leads to a high macroscopic strength and stiffness, but also to a brittle behavior typical of a ceramic monolith. SiC reticulated foams are isotropic, usually more compliant (since more porous) and more tolerant to damage. On the other hand, replication processes based on slurry infiltration generate a variable amount of defects (closed cells, voids left by the polymer template) that may affect the properties of SiC-based ceramic foams [16]. One alternative to honeycombs and foams is porous ceramics directly derived from –or inspired by– natural cellular solids, often called biomorphic (or biomorphous) cellular ceramics [17-19]. Wood exhibits a true cell structure, some species such as balsa, pine or cork displaying nearly ideal honeycomb structures. The synthesis of SiC-based biomorphous ceramics from wood has been for years the subject of active research [17-27]. The process basically consists in carbonizing the lignocellulosic material and converting the resulting carbon material into SiC by siliconization. One main feature is that the pore structure is preserved –except a volume change– at both stages. There are several variants for the carbon to
SiC conversion, involving either solid-liquid (with Si(l)) [17-19,21,22,27] or solid-gas reactions
at high temperature (T > 1400 °C) with Si(g) [19,20,25,26] or SiO(g) [24,26] or CH3SiCl3(g)
Si(l) have a high density and a high strength [28,29], but they generally contain unreacted carbon
and silicon separated by the SiC layer formed at the interface [17]. The conversion rate is higher
when using Si(g) because of the high porosity of the SiC microstructure promoting gas diffusion
[19,20,25]. But the treatment has to be carried out at a higher temperature than with Si(l), while
free carbon [25] or even sometimes free silicon [20] can still be observed. SiO(g) is produced
and reacts at lower temperature than Si(g). The further release of CO(g) induces microcracks in
the converted SiC layer [19] that may be detrimental to mechanical properties. There is another technique based on reactive gas treatments of carbon materials leading to SiC or other carbides (mostly TiC), which is called Reactive Chemical Vapor Deposition (RCVD). Carbon reacts
with a halide gas (SiCl4, TiCl4...) in presence of H2 (to promote halide reduction) to form a
superficial carbide layer [30-34]. The reaction starts significantly from 1200 °C for SiC (a much lower temperature than for siliconization, typically carried out between 1450 and 1600 °C) and only 1000 °C for TiC. The initial growth rate of the carbide layer is thermally activated and depends on the carbon structure. The kinetics is usually parabolic since the growth rate is rapidly limited by solid-state diffusion through the carbide layer [30]. The resulting thicknesses are limited in practice to about 1 µm for SiC and a few microns for TiC, due to faster diffusion in the latter [35,36]. RCVD was successively applied to carbon fibers [32-34] and porous carbon materials [31], but the conversion is often partial due to the maximum carbide thicknesses allowed (especially for SiC). This means that complete conversion of a porous carbon structure by RCVD requires a fully open porosity (to let reactive gases diffuse through it) and cell-wall thicknesses of no more than one to a few microns. Such a constraint is apparently not tolerable in the case of pore sizes of the millimeter scale such as those required for solar receivers. For usual cellular solids such as honeycombs and foams, the relative density is indeed directly related to the wall-thickness-to-cell-edge ratio (t/l), respectively linearly and with the square [12]. Admissible wall thicknesses for solar receivers would be therefore several hundreds of microns, i.e. unsuitable for the RCVD process. The cell wall thickness (t) of pyrolysed balsa is about two orders of magnitude thinner and seem thus compatible with a full RCVD conversion into carbide. The t/l ratio of balsa corresponds to a low relative density that is expected to result in a moderate strength and stiffness. This structure is lightweight, flexible and suggests a high
specific strength. The cell diameter (2l) and the gas permeability are on the other hand far too
low for the application.
The first original aspect of this work is to create a macro-porosity in balsa wood by laser cutting in addition to the natural micro-porosity. The aim is indeed to combine different levels of
porosity in the same material to allow the carbon-to-ceramic conversion by RCVD and combine gas flow properties that are suitable for a use as volumetric solar receivers. The multiscale TiC-based ceramic obtained by RCVD being still too fragile and sensitive to oxidation, the second original aspect consists in a mechanical reinforcement with a SiC coating by Chemical Vapor Infiltration (CVI). The various steps of the process (pyrolysis, RCVD, CVI) are first examined in detail. Then the composition and the microstructure of solid, the porous structure and the properties of the cellular material (density, oxidation resistance, crushing strength, thermal expansion and thermal diffusivity) are characterized at each stage.
2. Experimental procedure
2.1. Processing
2.1.1. Creation of the macro-porosity by laser cutting or water jet cutting
The starting samples were plane-parallel balsa slabs that were cut from a 30x100x1000mm
batten, perpendicular to the fibers. The density of the balsa wood was 0.13 g/cm3 and the initial
open porosity 74%. The porous structure is relatively complex and consists of an arrangement of fibers, rays and vessels [37]. The arrangement of the fibers (the major volume fraction) itself resembles a honeycomb structure, with a mean cell diameter (2l) of about 40 μm and a thickness of the double cell wall (t) of approximately 1 μm [37]. A laser cutting machine (Trotec Speedy
300) was used to create the macro-porosity in the balsa slabs. A CO2 laser with a power of 100
W generated macro-pores by drilling parallel channels of controlled geometry. The cutting speed was set to a value of 3.3 cm/s. A hexagonal honeycomb structure was chosen as the
geometrical pattern of the channels(Fig. 2.a). It was designed with CorelDraw software that
was then used to create specific files compatible with the laser cutting system. The balsa slabs, with an initial total thickness of d = 5 mm, were polished on both faces and cut into 20 mm diameter discs. The hexagonal channel pattern was drilled through the discs using two different parameters: h, the side of the hexagons and w, the thickness of the double hexagon wall. The slab being cut perpendicular to the wood fibers, the laser drilling was performed parallel to the fiber direction. The different properties of the final material were studied as a function of these two parameters. For that, six samples of different geometries were prepared (Table 1). For each
sample, the relative density at the macroscopic scale (*/
and s the density of the solid cell walls) depends only on h and w. Considering the hexagonal
geometry, a simple calculation of the solid volume fraction leads to equation (1). *
/s=
(𝑤ℎ)2+ (𝑤ℎ) × 2√3 3+ (𝑤ℎ)2+ (𝑤ℎ)×2√3
To study the RCVD kinetics and evaluate if the synthesis method is suitable for the final application, larger samples were also investigated. Laser cutting could not be used in this case because the balsa wood was found to ignite during cutting operation for thicknesses exceeding 5 mm. Water jet cutting was therefore used instead. Cylinders, 34 mm in diameter, were perforated with circular channels of a diameter of 2 mm (the water jet was too wide to cut hexagonal holes of 1 mm side). The channels were separated with a minimum wall thickness of 1 mm. The depth of the balsa samples prepared using this method was d = 20 mm (Fig. 2.b).
2.1.2. Pyrolysis and carbonization
The balsa specimens obtained by laser cutting were subsequently pyrolysed to be converted into carbon. The samples were placed on a flexible graphite tray that was introduced in the center of the silica tube (ø = 50 mm) of a resistance furnace. The pyrolysis was performed under a nitrogen flow at ambient pressure (99.999% from Air Liquide). Previous studies have shown that the pyrolysis of cellulosic materials is accompanied by strong weight loss and shrinkage occurring essentially within the 200 - 600 °C temperature range [38]. As it will be discussed in the next section, the temperature profile was adapted to this particular pyrolysis behavior. The samples were first heated up to 150 °C with a 5 °C/min ramp rate. The heating rate was then decreased to 1 °C/min up to 600 °C. The final heating ramp rate was then readjusted to 5 °C/min up to 850 °C, before cooling down to room temperature at of 5 °C/min. The resulting “biochar”
(Cb) samples were used for the characterizations as well as for the following gas phase reaction.
2.1.3. RCVD
The reactor used for the next two vapor route steps (RCVD and CVI) consisted of a sintered silicon carbide tube (enhanced Hexoloy SA, from Saint-Gobain Ceramics), with an inner diameter of 63.5 mm. The SiC tube was installed inside a high temperature electrical resistive
furnace (Carbolite STF1500) having a 600 mm long hot zone. The H2/TiCl4 gaseous mixture
was introduced in the reactor to react with the Cb samples to form TiC by RCVD. The titanium
containing liquid TiCl4. H2 was also used as a reducing agent for TiCl4. The H2 flow rate was
controlled by a mass flowmeter (SLA5850 from Brooks). To ensure a reliable, low and constant
partial pressure of TiCl4, a dew point evaporator was added on the top of the bubbler. In such a
device, the regulated temperature of the fluid going through the condensing column imposes
the partial pressure of TiCl4. The gaseous mixture flowing through the column is composed of
the hydrogen carrier gas previously laden with TiCl4 vapor in the evaporator vessel. Since the
temperature of the column is lower than that of the evaporator, excess TiCl4 condenses on the
wall of the column, leading to the saturation of the carrier gas [39]. The temperature of the
liquid TiCl4 vessel was 35 °C while that of the water-cooled column was set at 20 °C, giving a
TiCl4 flow rate of 50 sccm (standard cubic cm3 per minute) for a bubbling hydrogen flow rate
of 161 sccm. The H2 to TiCl4 ratio was adjusted to 9 by adding a flow rate of 289 sccm of pure
H2 through an additional hydrogen feed line mounted in parallel, the total H2 flow rate
introduced in the reactor being equal to 450 sccm. A rotary vane vacuum pump was connected to evacuate gases at the outlet of the reactor. Liquid nitrogen traps were installed upstream from pump to condense corrosive by-products such as HCl. A schematic of the RCVD/CVI device is shown in Figure 3. A flexible graphite foil was placed against the interior of the reactor wall
to protect the SiC tube. The porous Cb specimens were hung with a graphite frame and thin SiC
wires (SCS-6 fiber from Textron Specialty Materials) threaded through channels of the specimens. The sample holder was placed in the center of the hot zone, where a homogeneous deposition rate is observed. All the RCVD treatments were performed with the same optimized parameters. The reaction was carried out at 1300 °C and a total pressure of 5 kPa. The duration time of the reaction was 4 h for the small laser cut samples. Different reaction times were applied for larger samples (4 h, 6 h and 10 h). The mass of samples is measured before and after
the RCVD treatments (respectively m0 and mRCVD). The conversion rate is calculated from
equation (2), where MTiC and MC are respectively the molar weights of TiC and C.
= 𝑚RCVD 𝑚0 −1 𝑀TiC 𝑀C − 1 (2)
2.1.4. CVI
A thick SiC coating was deposited by CVI after RCVD in order to reinforce the TiC samples and protect them from oxidation. The SiC deposit was formed from a mixture of methyltrichlorosilane (MTS) and hydrogen. The growth mechanism is complex and involves many homogeneous and heterogeneous elementary steps [40,41]. Yet, the global reaction can be represented by equation (3).
CH3SiCl3 SiC + 3HCl (3)
The experimental apparatus used was the same as for the previous RCVD step (Fig. 3). MTS was stored in the liquid state in a stainless steel evaporator vessel placed in an oven at 35 °C. After evaporation, a pure MTS gas flow was established at a rate of 60 sccm, by mean of a mass flow controller. The MTS flow rate was added to a hydrogen flow rate of 180 sccm, resulting
in a H2/MTS ratio of 3 and a total gas flow rate of 240 sccm. The TiC samples obtained after
RCVD were fastened to the same sample holder and placed in the isothermal zone of the reactor. The reactor was heated to 950 °C and the total pressure regulated at 5 kPa. The total reaction time was 4 h.
2.2. Characterization
The materials were characterized in the powder state, after grinding, by X-Ray diffraction
(XRD, diffractometer Bruker D8 Advance, CuK1 = 0.15419 nm). XRD analyses were
carried out after each step of the process. The XRD patterns were acquired on a 2 range of
10-90°. The phase identification and the structural organization characterization were completed by Raman analyses (Labram HR, from Horiba-Jobin Yvon). The excitation source was a He–
Ne laser ( = 632.8 nm). The power was kept below 1 mW to avoid heating of the sample. The
lateral resolution of the laser probe was close to 1 µm and the analyzed depth varied from a few tenths to several hundred (less than 1 µm) of nanometers depending on the nature of the material.
Scanning Electron Microscopy (SEM, Hitachi S4500 FEG) was used in the secondary electron (SE) mode to observe the surface morphologies of the specimens at each step of the process and determine the thickness of the SiC layer deposited on the titanium carbide. A second SEM microscope (FEI, Quanta 400 FEG), equipped with both SE and back-scattered electron (BSE) detectors, was also used to better differentiate the different phases present in the samples. Elemental analyses of the ceramic samples were also performed at the microscale by Energy
Dispersive X-Ray Spectroscopy (EDS) with the same SEM. The EDS analyses were achieved directly from the outer surface or from cross-sections, in particular to follow the progress of oxidation near the surface and in the bulk of the specimens. In this case the samples were embedded in epoxy resin and polished with diamond slurries of decreasing particles size (9, 3 and 1 μm). The same specimens were also examined by optical microscopy at various magnifications (LEICA wild VM3Z and Reichert-Jung MF3).
The density of the samples was determined at each step of the process by Helium-pycnometry
(He pycnometer AccuPyc 1330). The samples were placed in the 10 cm3 cell of the apparatus
and ten successive measurements allowed having an average of the true density of each specimen.
Thermogravimetric analysis (TGA, Setaram TAG 24) was used for assessing the behavior of TiC and TiC-SiC ceramics under oxidation at ambient pressure in dry air (99.999% from Air Liquide). Three different types of porous materials were submitted to the oxidation tests. The
first one, referred to as “TiC” specimen, was obtained after the RCVD treatment of the Cb
specimen. The second type, resulting from the CVI on the TiC specimen, is called “TiC-SiC” specimen. Finally, the third type of material labeled “C-SiC” specimen is obtained directly from
the CVI of SiC on the Cb specimen obtained just after pyrolysis (without intermediate RCVD).
Two types of temperature-time program were applied. In a first step, a slow heating ramp (2 °C/min) was followed up to 1000 °C to detect the onset of oxidation for the various specimens. The temperature was kept constant at 1000 °C for 10 min before cooling down to room temperature at 20 °C/min. The second type of program consists of a fast (20 °C/min) heating ramp up to the constant testing temperature, which was maintained during 10 h before cooling down to room temperature (20 °C/min). These constant temperature tests were carried out either at 1000 or 1200 °C.
The specimens of different geometries (t and h values) and at different stages of the process
(raw balsa, Cb, “TiC” and “TiC-SiC”) have been submitted to indentation testing with a flat
punch. This type of test is well adapted to the characterization of small specimens of high porosity brittle cellular ceramic and carbon materials [12,42]. The RCVD and CVI treatments being not necessarily uniform in the bulk of the samples, the emphasis was put on the analysis of the complete crushing curve rather than the ultimate compressive strength. The former approach indeed provides an analysis of the individual cell failures within the entire volume of the specimen upon crushing, whereas the latter is very dependent on the boundary conditions and the load transfer to the sample section (e.g. on the bonding – or not – of the specimen
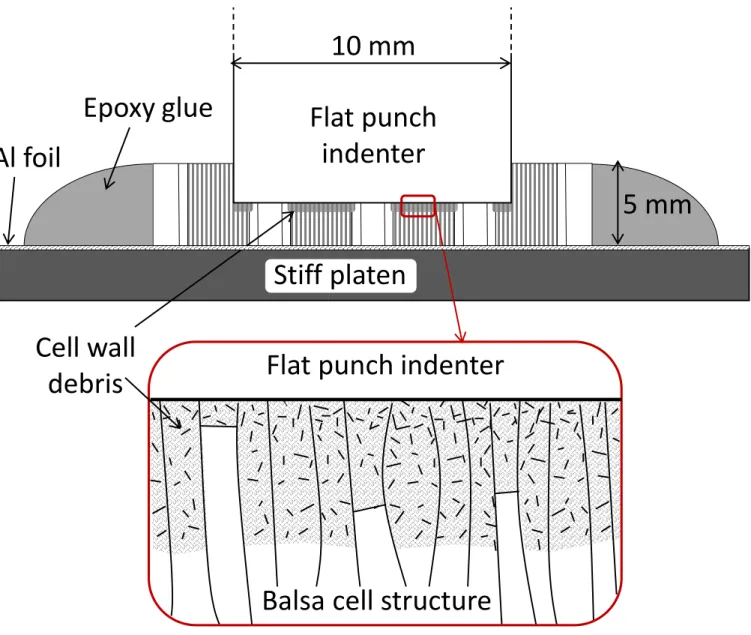
sections to the loading platens) [43-45]. The tests were carried out with a universal electro-mechanic machine (Instron 4505). The axial compressive loading was applied with a flat-ended titanium indenter (10 mm in diameter) moving at a crosshead speed of 0.2 mm/min (5 %/min). The specimens (20 mm in diameter) were pasted on an aluminum sheet with a thin layer of bi-component epoxy glue (to avoid penetrating the porosity), as shown in Figure 4. The edges of the samples were surrounded by a thick epoxy rim to avoid the break-up of specimen parts aside the indenter (Fig. 4). As expected for such high porosity materials, the damage was found to occur immediately below the indenter, as a result of local failures of cells contacting the indenter [12]. Because of the orientation of the balsa cells and the macro-pores parallel to the loading axis, failure did not propagate on the sample sides. It accumulated along the loading axis, across the whole thickness of the specimen, until full compaction at the end of the test. In these conditions, the crushing behavior was not expected to be affected by the sample mounting on the platen facing the indenter and the epoxy rim on the edges. Furthermore, the debris formed at the contact remain confined below the indenter by the specimen edges, to the benefit of the
reproducibility of the tests. The displacement between the bottom platen and the indenter (l)
was measured with an extensometer (Fig. 4). The load (F) was recorded versus l as well as
the acoustic emission signal (in cumulated counts) to the follow the sample damage during testing. The compliance of the loading system (i.e. the stainless steel platen and the Ti indenter) was negligible compared to the elastic elongation of the porous specimen. The macroscopic
stress () and strain () were then calculated using equations (4) and (5):
F/S (4)
∆𝑙
𝑑0x 100 (5)
Where S is the total surface of the indenter (the stress is calculated from the whole section of
the specimen under the indenter, including both micro- and macro-porosity) and d0 the initial
depth of the samples. It should be mentioned that, due to the brittle behavior, does not
represent the strain of the still undamaged part of the specimen being crushed, but the apparent strain of the whole material (damaged and undamaged) confined between the indenter and the platen. Most of the tests were performed under monotonic loading until the full crushing of the material. Considering the large number of variable parameters (nature of the solid, h and w values), only one or few specimens (maximum 2-3 pieces) of each type was tested. In the latter case the most representative stress-strain curve is presented in the figures. Loading-unloading
cycles and tests interrupted before full crushing were occasionally carried out to better examine the damage process.
Thermomechanical analyses (TMA Setsys 2400, from Setaram, France) were performed on TiC and TiC-SiC samples to determine the thermal expansion of the two types of material. A small compression load of 5 g was applied in the axial direction to ensure the stability of the sample during the measurements. The temperature/time program consisted of a slow (5 °C/min) heating ramp up to 1000 °C, a 10 min isothermal plateau at 1000 °C and a cooling ramp down to room temperature (-5 °C/min) under argon. A blank measurement was carried out exactly in the same conditions but without sample to correct the elongation curves recorded from the specimens. The bulk thermal diffusivity of the macroscopic walls (separating the macroscopic channels) of the TiC and TiC-SiC samples was evaluated by photoreflectance microscopy [46]. The
characteristic volume probed was of the order of 200x200x200 m3, the signal averaging the
response of the overall ex-balsa cell structure (i.e. the cell walls and micro-porosity). The thermal conductivity of both specimens was calculated from their true densities (as determined
by He-pycnometry) and their specific heat capacities (Cp), as measured by differential scanning
calorimetry. Based on the ideal geometry of the 3D honeycomb structure of the porous ceramics and the thermal properties of the solid, a numerical simulation of a stationary guarded hot plate was carried out to calculate the effective thermal conductivity of the TiC and TiC-SiC porous ceramics.
3. Results and discussion
3.1. Conversion from wood to TiC-SiC ceramics
3.1.1. Carbonization and pyrolysis of the balsa wood cellular structures
The pyrolysis and carbonization steps must be carefully controlled to preserve the natural and artificial (obtained by laser cutting) cellular structure of the balsa specimens. A slow heating rate is necessary in particular to reduce as much as possible the weight and volume losses and prevent the formation of cracks. A TGA analysis was carried out under flowing argon at a constant heating rate (5 °C/min) on a small piece of balsa (about 20 mg), to evidence the most
critical steps of the pyrolysis and optimize the final temperature program described in section 2.1.2 (SupMat. 1). The weight of the dried material was determined from a preliminary TGA
test on a similar material and considered as the initial weight m0 to accurately determine the
weight loss and the carbon yield. A 2 h isothermal plateau at 20 °C under flowing argon was applied before the TGA test to eliminate adsorbed moisture (not shown in the TGA curve in
SupMat. 1). The decrease of m/m0 observed up to 150 °C is due to the end of the elimination
of free and bound water (m/m0 ≈ 0 at 150 °C, see SupMat. 1). The 150-600 °C temperature
region, which exhibits the largest weight loss, corresponds to the thermal degradation of the bio-polymers or “depolymerization”. In cellulosic materials, the depolymerization is sudden and occurs between 240 and 400 °C [47]. The corresponding weight loss is related to the release
of H2O, CO2 or CO. The depolymerization is more progressive in wood due to the distinct
degradation temperature domains for hemicellulose (200-260 °C), cellulose (240-350 °C) and lignin (280-500 °C) [38,48]. The carbonization takes place above 600 °C. Poly-aromatic
structures are formed with a release of H2 and CO and condense to form the tridimensional
carbon network. Given the pyrolysis-carbonization behavior of balsa wood, a 1 °C/min heating rate was applied in the most critical temperature domain 150-600 °C, which includes depolymerization. A rate of 5 °C/min was programmed for the rest of the heat treatment, below 150 °C (during the end of drying) and between 600 and 850 °C (during carbonization). The char yield of the non-dried material is similar to previous values from the literature (≈24%) [17]. The change in macroscopic dimensions is about -20% along the fiber axis and -30% in the perpendicular direction, leading to an overall volume shrinkage around 60% and a nearly 40% decrease of the apparent density. Despite the strong weight loss and anisotropic shrinkage observed during this stage [38], the microstructure of the material is remarkably preserved at all scales (Fig. 5). Raman microspectroscopy and XRD analyses of the charcoal specimens (Fig. 6, SupMat 2) evidenced a highly disordered structure typical of vitreous carbon [49].
3.1.2. Conversion by RCVD of carbon into TiC cellular structures
The reaction with TiCl4 was preferred to that with SiCl4 because it is kinetically favored due to
the faster solid-state diffusion of carbon through the growing TiC layer. The conversion rate of the carbon cellular structures into carbide is therefore expected to be higher (or even total) with TiC than with SiC. The durability of the cellular ceramics under stress at high temperature in
air obviously requires limiting the amount of residual carbon in the final structure. After an RCVD treatment of 4 h in the conditions defined in the previous section, the experimental weight gain of the sample prepared by laser cutting is 475%. The theoretical value expected
after a total conversion being 499%, the conversion rate is estimated at about 95%. SEM
observations of the fractured cell walls of the material (Fig. 7) confirm the nearly complete
conversion of carbon into titanium carbide. The density of 4.8 g.cm-3, as measured by
He-pycnometry, is very closed to 4.9 g.cm-3, the theoretical value expected for stoichiometric TiC.
This confirms that the material consists of nearly pure TiC and denotes a very low amount of closed porosity. The porosity of the solid micro-porous TiC material (excluding the laser-cut macroscopic channels) is estimated at about 80%. The high magnification SEM observations reveal a relatively coarse microstructure of TiC grains, with columns grown perpendicularly to the surface (Fig. 7). Some small intergranular pores can also be found between the grains and at the junction of two growing TiC layer fronts, within the cell walls. As expected, the XRD pattern confirms the high crystallinity of the specimen and the presence of only the cubic TiC phase (face-centered, NaCl type, Fig. 8). In agreement with the selection rules (this structure is not Raman active), the Raman spectrum of the TiC material reveal no feature in the 200-2000
cm-1 region (not shown). This result denotes also the absence of TiO
2 (100-800 cm-1) as well as
residual sp2 carbon (D and G bands at 1350 and 1600 cm-1).
For both RCVD and CVI treatments, the gas-phase diffusion of the precursor and by-products through the porous medium can be kinetically limiting. In CVI more specifically, the carbide growth rate is usually lower at the interior of the porous material than at the surface. A gradient of the deposition rate rapidly appears due to the reactive species depletion and the concentration of inhibiting products like HCl. The outer coating can eventually clog the pores near the surface, stop further gas infiltration and then solid deposition in the porous body. The situation is different in the case of RCVD. Instead of solid accumulation at the surface of the substrate during CVI, RCVD is expected to result in a global volume change of the porous structure itself
(V/V0 ≈ +130%, assuming the total conversion of carbon into TiC and molar volumes of 12.2
and 5.4 cm3/mol respectively for TiC and C). As expected, the microstructure is finely
preserved after RCVD (Fig. 7). On the other hand, no significant change in both macro- and micro-pore sizes is observed indicating that the cell walls expanded more in thickness than in length, as suggested by the SEM observations (compare Fig. 5 and 7). Once the most accessible parts to the reactive gases at the surface are fully transformed into TiC, the carbide growth naturally stops due to the lack of carbon. This self-limiting growth allows the reactive gases to
penetrate further the pores and fully convert carbon into TiC. For large samples, however, the diffusion of gases toward the interior is more difficult and the reaction usually takes a longer period time to be completed than for smaller specimens. To assess this size effect on the apparent kinetics, the conversion rate of larger pyrolysed balsa samples prepared by water jet
cutting was followed versus time. The conversion rate increases with time, but the apparent
kinetics decrease ( = 48, 80 and 91% after 4, 6 and 10 hours of treatment, respectively). For
these samples, solid-state diffusion is not the parameter limiting the TiC formation as reported for dense substrates for T ≤ 1000 °C [50,51]. Here at 1300 °C and for thin TiC layers (≈ 1 µm), solid-state diffusion is a fast process and the apparent kinetics is thus limited by the gas transport through the micro-porosity. The more accessible parts being totally converted, only the internal region contributes to the overall conversion rate, the apparent kinetics being then limited by gas diffusion. The specimens treated for 4 h and 10 h were cut along the macro-pore axis, embedded in resin and polished for analyzing the progress of the reaction as a function of time. The SEM images show that for only 4 h of reaction, some cell walls are not yet fully converted into carbide (Fig. 9) while others located far from the macro-pores and less accessible to gases are even free of TiC. Such heterogeneities indicate that gas diffusion is fast near the macro-pores and much slower in the natural micro-porosity derived from balsa wood. In contrast, the transformation is quasi-complete after 10 h of reaction. Only a few isolated areas remain not fully converted (not shown). These microstructural features can be related to the high level of
the conversion rate deduced from the weight gain, which is close to 100%.
3.1.3. Infiltration of the TiC cellular structures with CVI-SiC
After 4 h of CVI, a dense, pure and polycrystalline SiC coating is deposited on the TiC
structure leading to the final TiC-SiC cellular material. The coating consists of a thin and continuous SiC layer present mainly near the outer surface of the specimen and the macro-pores (Fig. 10). The weight gain ranges between 15% and 30% depending on the open macro-porosity of the sample (i.e. h and w). The Raman spectroscopy analysis from a polished cross-section the CVI-SiC coating (Fig. 6) and XRD pattern of a ground TiC-SiC specimen (Fig. 8) both confirm the nature of the deposit. The Raman spectrum reveal two sharp peaks corresponding
to the transverse and longitudinal optical phonons (TO and LO) characteristic of the SiC
around 400-600 and 700-1000 cm-1, which are likely related to the scattering of a highly
disordered SiC phase (e.g. present at the grain boundaries) [53]. The XRD patterns of the TiC and TiC-SiC ceramics (Fig. 8) are characteristic of highly crystalline phases. For the TiC-SiC
ceramic, the diffraction peak positions respective to the TiC and SiC phases appear very
close in the diffraction pattern. However, the 2 resolution allows the distinction between the
two cubic phases, especially at high 2 values (see Fig. 8, showing the splitting of the (111),
(220), (331) and (222) peaks). The RCVD-TiC material displays a much higher crystalline state than the CVI-SiC coating, as shown by the comparison of the respective peak widths (the
splitting of the TiC peaks for the pure RCVD-TiC material, well visible at high 2 values, is
due to the distinct CuK1 and K2 components). Such a difference in the grain size is
probably related to the much lower processing temperature of the latter (950 °C vs. 1300 °C) as well as the faster solid diffusion in TiC compared to SiC. SEM observations from cross-sections of the TiC-SiC ceramic revealed that the thickness of the CVI-SiC deposit varies approximately from less than 1 µm in the core of the specimen, in the less accessible parts of the specimen, to 10 µm at outer surfaces, on the macroscopic channel edges and nearby the open ex-balsa cells. The infiltration/reaction rates are obviously less favorable in the case of the SiC precursor gas system than for the RCVD of TiC. The thick SiC outer coating clogs up the porosity and the infiltration is interrupted as soon as the access of gases is no more possible. As already mentioned, the self-limiting character of RCVD is beneficial to the infiltration because (i) consumption of the Ti precursor is reduced to the conversion of available carbon to TiC only and (ii) the porosity remains open. For CVI in contrast, the growth is definitely interrupted as soon as the coating impedes the access of gases through the porosity. Yet, the densification of the material after the CVI step is significant. He-pycnometry measurements indeed led to a value of open micro-porosity of the solid TiC-SiC material (i.e. excluding macrochannels) of about 65%, while it was 80% after RCVD (these values being determined for a specimen geometry: h = 0.5 mm and w = 1 mm).
3.2. Properties of theTiC and TiC-SiC ceramics
3.2.1. Oxidation behavior of the TiC and TiC-SiC ceramics
The oxidation behaviors of the TiC and the TiC-SiC (with a SiC/TiC weight ratio of 0.15-0.20)
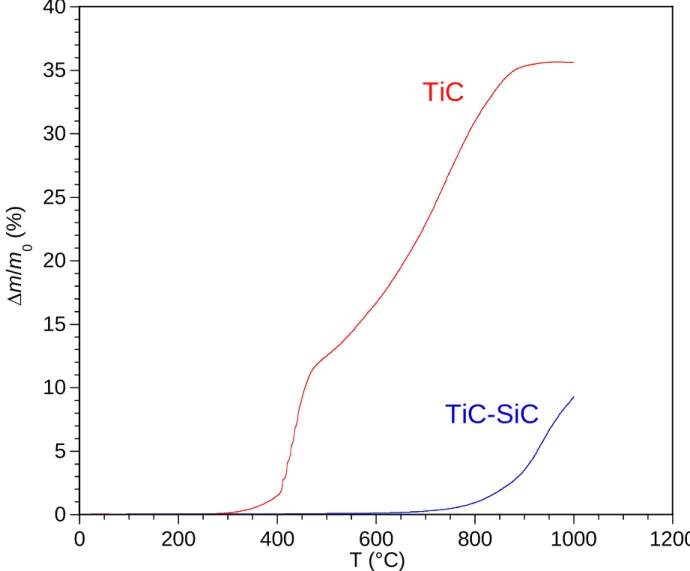
samples in dry air are compared in Fig. 11. The TGA signal is plotted versus temperature during a 2 °C/min heating ramp in Fig. 11.a and versus time during an isothermal plateau at 1000 or 1200 °C in Fig. 11.b. The pure TiC sample starts to oxidize at a temperature as low as around 350 °C, in agreement with previous results obtained from pure TiC micro- or nano-powders [54,55]. The weight gain increases very rapidly beyond this temperature and the sample is fully oxidized at 850 °C (before the end of the 2 °C/min heating ramp), as shown by the constant TG signal versus temperature. When the TiC sample is protected by a CVI-SiC layer, the onset of oxidation is shifted to 750 °C. The TiC-SiC specimen is not completely oxidized at 1000 °C at the end of the heating ramp (Fig. 11.a). It is still the case after 10h annealing at this temperature (Fig. 11.b). The isothermal oxidation behavior is nearly parabolic during the whole test and the final weight increase is approximately 20 wt%. The weight gain becomes much faster at
1200 °C. The oxidation rate suddenly decreases after about 2.5 104 s, the TG curve reaching a
30 wt. % plateau indicating a nearly complete oxidation of the sample (Fig. 11.b). From the simple change of visual appearance, the effects of oxidation are clearly distinct for the TiC (after a 2 °C/min heating up to 1000 °C) and the TiC/SiC (after 10 h at 1200 °C) specimens. The former sample displays a uniform ivory white color, denoting the total oxidation of TiC, whereas the latter is yellowish brown, due to the presence of residual TiC or SiC. The formation
of TiO2, only as the Rutile form, is confirmed by XRD (Fig. 12) for both TiC and TiC-SiC
samples. Anatase was also observed by other authors but usually at early oxidation. It tends to transform progressively into Rutile during the progress of the reaction to eventually disappear at complete oxidation [54,55]. Only traces of amorphous silicon oxide could be found by EDS
and Raman analyses at the outer surface of the CVI-SiC layer. The thickness of the SiO2 scale
could not be measured by SEM from cross-sections of the sample, but it can be estimated of the order of 200 nm after 10 h of oxidation in dry air at 1200 °C [56,57]. These results demonstrate the clear beneficial role of the SiC layer in protecting the TiC ceramics from oxidation.
In order to confirm the benefit of the carbon conversion into TiC for the integrity of the SiC-coated structure in use, a CVI-SiC layer was deposited on the vitreous carbon structure obtained directly after the pyrolysis of balsa (i.e. not transformed into TiC). The experimental conditions for the CVI treatment were basically the same as those described in section 2.1.4. The total gas
flow rate was increased (200/600 sccm of MTS/H2, instead of 60/180 sccm), to reduce a
possible precursor depletion and the reaction time was extended to 6 h (instead of 4 h), to improve the thickness of the CVI-SiC layer deposited. The weight gain recorded after deposition is as high as 450% due to the extreme lightness of the carbon structure. This specimen was submitted to the same TGA oxidation ramping program as described above (2 °C/min up to 1000 °C). The TGA curve (not shown) evidences a strong mass loss starting at 550 °C and reaching a level of 17 wt. % at 1000 °C. The weight gain ascribed to the oxidation of the CVI-SiC coating being very limited below 1000 °C [57], this weight loss is for the most part attributed to the gasification of the nearly total amount of carbon present in the original sample (18.2 wt. %). This test emphasizes the fact that the CVI-SiC layer is not protective despite the precautions taken to ensure an effective infiltration in the porous material. The results confirm besides the beneficial effect of the RCVD step, which transforms carbon
(gasifying during oxidation) into carbide, leading to a solid and well-preserved TiO2 porous
structure.
After oxidation at 1000 °C for 10 h, the TiC-SiC the specimen was embedded in epoxy resin, cross-cut in the longitudinal direction and polished. Whereas the outside of the oxidized TiC-SiC sample is still dark grey, low magnification optical observations reveal a white colored structure in the bulk (not shown). The interior of the sample was observed at higher magnification in the BSE-SEM mode imaging. The SEM micrographs reveal that this translucent white material has the same shape as the original TiC skeleton (Fig. 13.a). EDS (Fig 13.b) and Raman micro-probe analyses (SupMat. 3) were carried out to qualitatively analyze the elemental and phase composition, respectively. Both types of analyses were performed in the punctual mode, i.e. close to the micron scale. Both analyses point out the presence of non-oxidized TiC parts (note that the centrosymmetric structure of TiC is Raman inactive), near the sample outer surface, which are always surrounded by the thick SiC coating (Fig 13.b-spot 2, SupMat. 3). The CVI-SiC coating itself is not affected by oxidation, at least from the EDS and Raman analyses (Fig 13.b-spot 1, SupMat. 3). In the core of the sample, in contrast, the material
the Rutile form (SupMat. 3). Such a change in the local composition can be explained by the inhomogeneous infiltration of SiC into the material. Only the near surface parts of the TiC-SiC sample are protected by the CVI-SiC layer from the oxidation. Yet, the integrity of the balsa-derived micro-porous structure is well preserved since no cracks and no voids appeared during oxidation. The results are similar after 10 h of oxidation of the TiC-SiC specimen at 1200 °C (not shown). Some parts of the TiC skeleton located near the surface show signs of oxidation, but the CVI-SiC coating remains unaffected as well as the overall structure, despite the substantial oxidation of the core.
3.2.2. Mechanical behavior at room temperature of the TiC and TiC-SiC ceramics
The mechanical behaviors of the porous materials at the various stages of the processing route
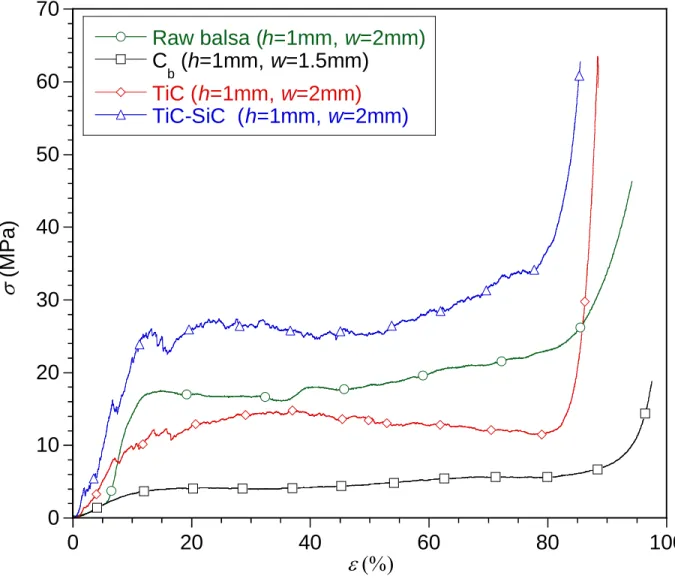
(raw balsa, Cb, TiC and TiC-SiC) are compared in Fig. 14 for given values of h and w. For all
tested specimens, the compression curves exhibit three main parts: a first linear elastic domain, where the strain increases linearly with stress, a second yield stress domain, with a characteristic stress plateau and a third quasi-vertical stress-strain domain resulting from the densification of the crushed specimen (the porosity being entirely collapsed, the solid is no longer compressible). This behavior is typical of cellular solids [12]. For the raw balsa wood, the stress plateau is related to the elastoplatic strain of the cell walls. The damage mechanism is different
for Cb, TiC and TiC-SiC specimens. In this case the stress plateau is due to brittle crushing of
the porous solid [12,42,58]. During indentation, some of the solid parts in contact with the indenter collapse, the fracture propagating to the neighboring cells. A steady state crushing regime is established (stress plateau), with nearly constant number of contacts and brittle failures per unit of strain [12,42]. The debris formed at the contact with the indenter penetrate the open porosity until the full compaction at the densification stage. Balsa wood is a reference material in terms of uniaxial compressive strength that is often used as cores in sandwich panels.
Compared to raw balsa, the crushing strength (i.e. the average plateau stress) aver is
significantly reduced (the strength reduction can be estimated of approximately 50%) after pyrolysis. The vitreous carbon material is indeed extremely fragile and compliant, compared to
a carbide, especially when derived from lightweight wood such balsa [28]. aver is improved by
a factor of two after the RCVD step (approximately the same level as for balsa). This change is obviously related to the high stiffness of TiC and possibly also to the healing by solid-state diffusion of microcracks formed in the vitreous carbon structure during pyrolysis. As expected,
the crushing strength is further increased by a factor of two after the CVI. This is related to the thickening of the cell walls but also to the intrinsic properties of the CVI-SiC deposit compared to TiC, the former being less porous and exhibiting a finer microstructure with fewer defects.
The maximal strain (at densification) max, on the other hand, decreases due to the increase of
relative density. The mechanical properties at various transformation stages of the process can be discussed in light of previous studies on microcellular ceramics derived from wood.
Biomorphic ceramics obtained by liquid silicon infiltration are dense (1.2-2.7 g.cm-3) and have
low porosity (<25 %) [21,28,59,60]. These materials display a high compressive strength (150-160 GPa) [19,26] but tend to be brittle like more traditional SiSiC ceramics (prepared by reaction bonded silicon carbide). Wood-based ceramics obtained by gas-phase reaction (with Si or SiO vapor), on the other hand, consist of pure SiC and have similar microstructure as the current RCVD-TiC specimens [19,25,26,61]. For pine wood-derived specimens, for instance, the flexural strength of the SiC structures obtained by Si vapor reaction (12-13 MPa [19,26,61]) is close or even lower to the value for the initial carbon template [19]. The strength of the samples obtained by SiO vapor reaction (measured in both flexion and compression) is even lower due to a larger amount of defects created by the release of CO [19,26,61]. These results suggest that the RCVD-TiC microstructure is probably denser and beneficial to the mechanical properties than those of the SiC materials obtained by gas phase reaction. This could be again related to the faster solid diffusion of C in TiC than in SiC. Interestingly, some authors have also submitted the carbonized wood structures directly to a low temperature CVI treatment (also
with MTS/H2) to deposit a Si-rich SiC coating in the open porosity. The material was
subsequently heat-treated at 1600°C to convert the carbon skeleton into SiC by the reaction with the molten silicon phase of the co-deposit [19,61]. The resulting flexural strength is significantly higher than for the material prepared by Si vapor reaction (≈60%), but only 15-40% higher than the strength of the carbon template. Such a limited effect of the CVI-SiSiC coating compared to the current CVI-SiC reinforcement (Fig. 14) is probably due to the porous structure of the SiC outer coating after the heat treatment [61].
A crushing test of a TiC-SiC specimen was followed by acoustic emission (A.E.) analysis (Fig. 15). The test was interrupted at a strain rate of 23% (below densification) and the crushed specimen was examined by SEM in order to better evaluate the damage mechanism (Fig. 16). As expected from previous studies on brittle porous solids [12,58], the A.E. signal (in cumulated counts) is directly related to the brittle failure of the solid walls [42]. The SEM analysis of the
crushed surface reveals the presence of debris of the microcellular walls (with a typical SiC-TiC-SiC 3-layer structure), accumulated in the macroscopic channels (Fig. 16).
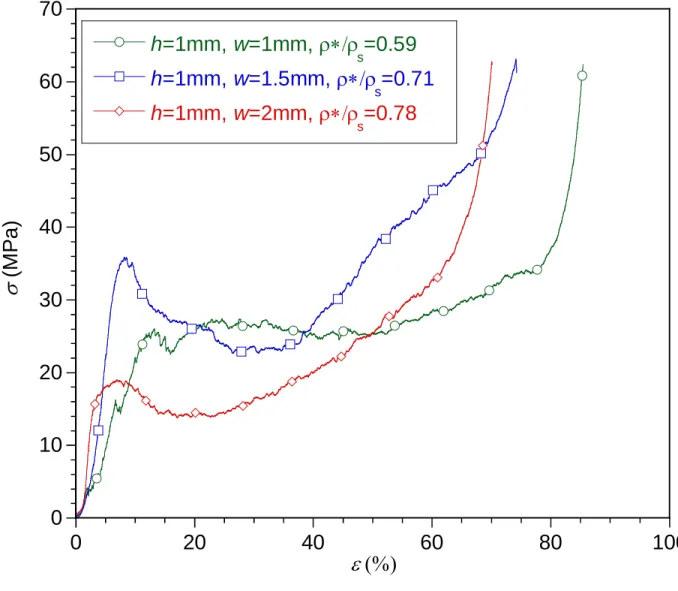
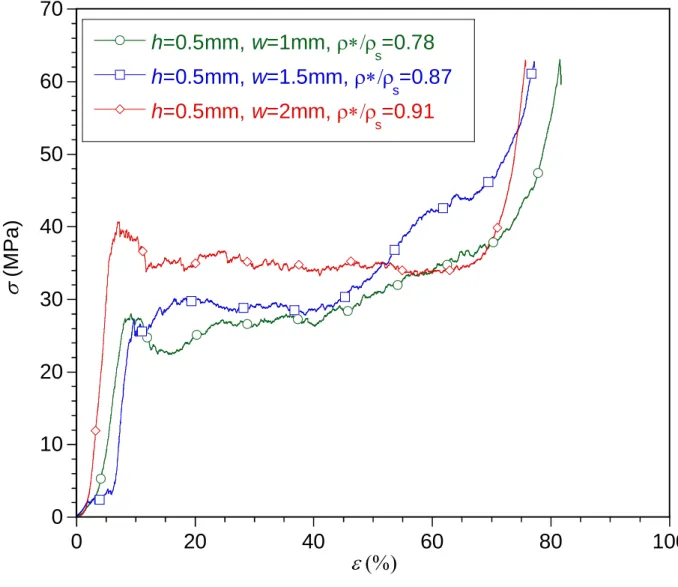
Fig. 17.a and Fig. 17.b compare the compressive stress-strain curves recorded from TiC-SiC ceramics having a common channel pore size (h = 1 and 0.5 mm, respectively) but a variable macro-porosity (w = 1, 1.5 and 2 mm). Whatever the macro-porous geometry, the mechanical behavior of the various specimens is relatively similar and exhibits a three-part curve as described earlier. Although a limited number of tests could be performed, the crushing strength
aver tends to increase slightly with the relative density (i.e. when h decreases or w increases),
while the densification strain max decreases. The TiC-SiC ceramics can be regarded as
honeycombs at both microscopic (balsa cell) and macroscopic (hexagonal channel) scales. The theoretical crushing strength of brittle honeycombs in the out-of-plane direction (parallel to the cells) is expected to vary linearly with the relative density [12]. Even though the number of
tests performed is limited, such a relationship between aver and */s is, within experimental
error, in reasonable agreement with the data. But the multi-scale macro-porosity combined with the inhomogeneous CVI reinforcement can be expected to induce more complex changes of the
crushing strength versus h or w. At the macroscopic scale, * and s (the apparent and cell wall
densities, respectively) both increase in the same ratio with the CVI reinforcement of the microcellular structure: the relative weight gain due to the SiC coating. The relative density */
s is therefore not affected by the CVI-SiC. In the Gibson and Ashby’s law describing the
failure of the honeycomb structures, the failure strength of the solid s is assumed to be constant
[12]. The “solid” considered here being itself the microcellular structure, the effective s value
will be naturally improved after the SiC infiltration. This increase will in fact depend on the geometry of the specimens because CVI is heterogeneous. The infiltration rate being higher near the surface of the macrochannels, the higher the S/V ratio -or the smaller the channel
diameter (2h) at given relative density or w/h ratio- the higher the expected s increase.
A TiC-SiC specimen oxidized for 10 h at 1200 °C has also been submitted to a uniaxial crushing test (Fig. 18). The shape of the stress-strain curve remains similar as in the initial state but the
crushing strength is reduced of about 50% after oxidation (aver being still close to the value for
raw balsa). The plateau length max is reduced, on the other hand, probably owing to the swelling
of the solid. The oxidation of TiC into TiO2 is indeed expected to result in volume increase of
3.2.3. Gas transport and thermal properties
Although failure strength and oxidation resistance are paramount properties for the applications of porous ceramics as solar receivers, many other features must also be considered. The Young's modulus and CTE are needed to predict thermal stresses due to temperature gradients or thermal shock. Transport properties of the fluid and heat must also be determined to simulate the behavior of the material in real use. A high permeability allows the air to circulate through the porosity and collect heat from the walls of the porous structure. The permeability of the macro-porous TiC-SiC samples could not be measured by classical methods because of the too low levels of pressure drop measured, resulting from the large diameters and high density of longitudinal channels. In order to have an estimate of the permeability K, analytical calculations were performed (Eq. 6) based on the number and the diameter of the channels in the samples, assimilated to a parallel pore network [12].
K =𝜑 𝑅h²
8𝜂 (6)
In equation (6), is the macroscopic porosity, is the tortuosity (here assumed equal to 1) and
Rh is the hydraulic radius. The permeability values were calculated for different geometries of
the macro-porosity (Table 2). K is obviously not affected by the SiC deposit under these assumptions and depends only on the macro-porosity drilled by laser cutting.
These values of permeability can be used to determine the air flux passing through the samples as a function of the difference of pressure at both sides. At this stage, the calculated values can be simply compared with the permeability of porous ceramics. The conclusion is that a
permeability value of 9.3 × 10⁻¹⁰ m2 is compatible with a good efficiency of the solar receivers
[62].
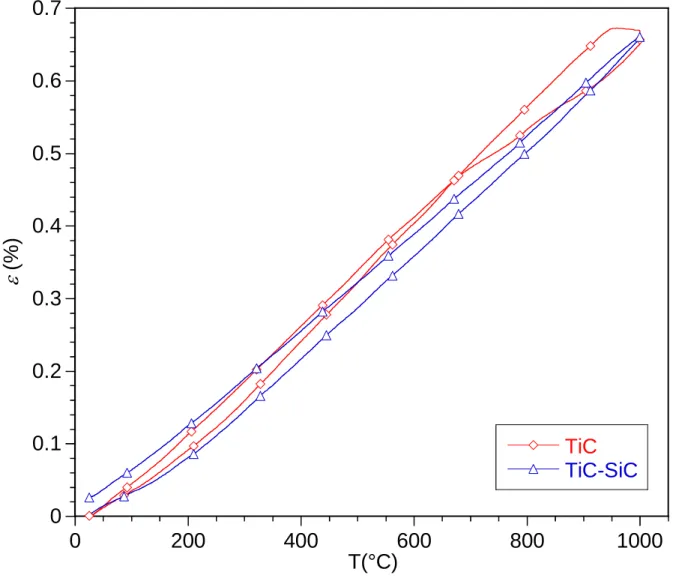
Besides gas transport, the thermal properties are also indispensable to predict the stress distribution in the solid and the overall thermal efficiency of the solar receiver. The thermal expansion behavior of TiC and TiC-SiC samples were analyzed by TMA. Fig.19 shows the
variation of the strain and the CTE = /(T-Tamb) of both TiC and TiC-SiC specimens as a
The thermal expansion curve of the TiC sample displays a hysteresis loop between 650 °C and 1000 °C, while the TiC-SiC behavior is reversible and nearly linear in the whole temperature range. This loop characterizing an irreversible change of the TiC specimen could be attributed to a sintering (or densification) phenomenon activated at high temperature. Pre-existing micro-cracks and micro-porosities were indeed observed by SEM in the as-processed TiC specimens
(Fig. 7). The expected average CTE is 7.4 × 10⁻⁶ K-1 for TiC and 5.2 × 10-6.K-1 for SiC, between
20 °C and 1000 °C [63]. The present results for TiC are in agreement with the experimental
value of of 7.1 × 10⁻⁶ K-1 obtained between 800 °C and 1000 °C. The CTE of the TiC-SiC
specimen is slightly lower, around 6.7 × 10⁻⁶ K-1, probably owing to the contribution of SiC in
the TiC-SiC samples.
Finally, the thermal diffusivity of the TiC and TiC-SiC specimens was assessed by infrared
microscopy [64]. The thermal diffusivity was estimated around 1.0 (± 0.1) × 10-6 m².s-1 and 1.1
(± 0.1) × 10-6 m².s-1 respectively for the TiC and TiC-SiC specimens, i.e. relatively close. The
two values of specific heat were also found to be very close, i.e. 557 J.kg-1.K-1 and 597 J.kg
-1.K-1 respectively. The difference in density of the two types of materials is therefore the main
factor influencing the level of thermal conductivity. For the TiC sample, the density of 4.8 g.cm
-3 leads to a thermal conductivity of the solid skeleton of 1.9 W.m-1K-1 at 20 °C. On the other
hand, the density of the TiC-SiC sample of 3.2 g.cm-3 results in a thermal conductivity of the
solid around 2.9 W.m-1K-1 at 20 °C. These values were implemented in the stationary hot plate
simulation to determine the effective thermal conductivity of a porous ceramic structure of given geometry. The values of thermal conductivity, as determined from the model, are
respectively 0.7 W.m-1K-1 and 1.1 W.m-1K-1 for the TiC and TiC-SiC porous structures. These
values are of course much lower than those found in the literature for TiC and SiC (at 25 °C,
17 and 125 W.m-1K-1 respectively for monolithic materials and 21 and 26 W.m-1K-1 for CVD
coatings) [63,65], due to the high porosity of the samples.
4. Conclusion
The cellular TiC structures obtained after RCVD being still brittle and prone to oxidation, they needed to be reinforced with a SiC coating by chemical vapor infiltration (CVI). Except an overall shrinkage after pyrolysis and some filling of the outer micro-pores with SiC after CVI, the multi-cellular structure of the perforated balsa is well preserved and flawless at all stages. The high reactivity of the vitreous carbon and the open microscopic porosity of the balsa cell
structure, by promoting gas diffusion, allow the full conversion into TiC by RCVD. The macroscopic porosity, on the other hand, is necessary to obtain a uniform SiC deposit inside the macrochannels. The penetration of CVI-SiC in the micro-porosity ensures an efficient anchoring of the SiC layer though it is limited to a depth of a few neighboring cells.
The oxidation resistance of the TiC/SiC specimen (after CVI) is consequently much higher than that of the pure TiC sample (after RCVD). Even if the TiC internal parts of the TiC/SiC specimen are oxidized after high temperature annealing in air, the porous structure is not significantly affected. The macroscopic porosity of the material (taking only macrochannels into account) is unaffected by the CVI step. Conversely, the density of the micro-porous solid (excluding macrochannels) increases significantly after CVI. The porosity indeed decreases from 80 to 65% −i.e. the relative density increases from 0.2 to 0.35− from the TiC to the TiC/SiC specimen. The conversion of the carbon structures by RCVD leads to a substantial increase in crushing strength simply due to the intrinsic properties of TiC. The strength is even further increased from the TiC to the TiC/SiC sample due to the infiltration of CVI-SiC. The crushing strength varies only slightly with the macroscopic porosity (i.e. with the diameter and the number of the channels) since the CVI-SiC reinforcement improves with the surface to volume ratio of the sample. Furthermore, the mechanical behavior of a TiC/SiC sample is not significantly affected after annealing at high temperature in air (1200°C/10h).
Besides oxidation resistance and mechanical strength, the thermal and the gas flow properties of porous TiC and TiC/SiC samples were examined. The thermal expansion is dominated by the TiC contribution for both materials. The thermal diffusivities of the two micro-porous solids are also close to each other, but the thermal conductivity is slightly higher for TiC/SiC than for TiC, due to the higher density of the former. These values were used to calculate the thermal conductivity of virtual porous ceramic structures of ideal honeycomb geometry. The effective conductivity obtained is lower than that of bulk materials but comparable to other similar materials like SiC-based foams.
This study has proposed an original method for synthesizing biomorphous TiC/SiC structures with an easily tunable macro-porosity. Most of the relevant properties for the application as volumetric solar receiver have been examined. However it is still uncertain to predict the behavior of the material in real use. The natural micro-porous structure is certainly prone to oxidation, but it is also more able to resist mechanical shocks, thermal shocks or steep thermal gradients than a dense ceramic. The porous material has no real structural function. Even if it
is locally damaged, for instance during assembling on the structure of the solar receiver or in use, this will not affect its proper operation. The presence of the TiC frame, besides, could be beneficial to the high temperature thermal conductivity. Long term oxidation, on the other hand, could alter thermal and light absorption properties. A test combining various constrains (e.g. high power light source and forced air flow) and in situ measurements (temperature...) would be useful for comparing the behavior of porous TiC/SiC ceramics to their counterparts.
Acknowledgements
This work was financially supported by the French Alternative Energies and Atomic Energy Commission (CEA) through a PhD grant to A. B. The authors are grateful to A. Allemand from CEA for fruitful discussions. The authors are also grateful to B. Humez, J. Danet, L. Lapuyade from LCTS, and L. Szafarz from the Coh@bit Fablab of Bordeaux University, respectively for the mechanical tests, XRD analyses, TGA analyses and the access to the laser cutting facilities.
References
[1] S. Alexopoulos, B. Hoffschmidt, Advances in solar tower technology, Wiley
Interdisciplinary Reviews: Energy and Environment, 6 [1] (2017) e217.
http://dx.doi.org/10.1002/wene.217
[2] O. Behar, A. Khellaf, K. Mohammedi, A review of studies on central receiver solar
thermal power plants, Renewable and Sustainable Energy Reviews, 23 (2013) 12-39.
https://doi.org/10.1016/j.rser.2013.02.017
[3] C.K. Ho, B.D. Iverson, Review of high-temperature central receiver designs for
concentrating solar power, Renewable and Sustainable Energy Reviews, 29 (2014)
835-846. https://doi.org/10.1016/j.rser.2013.08.099
[4] A.L. Ávila-Marin, Volumetric receivers in Solar Thermal Power Plants with Central
Receiver System technology: a review, Solar Energy, 85 (2011) 891-910.
https://doi.org/10.1016/j.solener.2011.02.002
[5] D.G. Morris, A. López-Delgado, I. Padilla, M.A. Muñoz-Morris, Selection of high
temperature materials for concentrated solar power systems: Property maps and experiments, Solar Energy, 112 (2015) 246-258.
https://doi.org/10.1016/j.solener.2014.09.050
[6] C.C. Agrafiotis, I. Mavroidis, A.G. Konstandopoulos, B. Hoffschmidt, P. Stobbe, M.
Romero, V. Fernandez-Quero, Evaluation of porous silicon carbide monolithic honeycombs as volumetric receivers/collectors of concentrated solar radiation, Solar
Energy Materials and Solar Cells, 91[6] (2007) 474-488.
https://doi.org/10.1016/j.solmat.2006.10.021
[7] T. Fend, High porosity materials as volumetric receivers for solar energetics, Optica
Applicata, 40[2] (2010) 271-284.
http://www.if.pwr.wroc.pl/~optappl/article.php?lp=788
[8] Z. Wu, C. Caliot, F. Bai, G. Flamant, Z. Wang, J. Zhang, C. Tian, Experimental and
numerical studies of the pressure drop in ceramic foams for volumetric solar receiver applications, Applied Energy, 87 [2] (2010) 504-513.
http://dx.doi.org/10.1016/j.apenergy.2009.08.009
[9] T. Fend, B. Hoffschmidt, R. Pitz-Paal, O. Reutter, P. Rietbrock, Porous materials as
open volumetric solar receivers: Experimental determination of thermophysical and
heat transfer properties, Energy 29 [5-6] (2004) 823-833.
https://doi.org/10.1016/S0360-5442(03)00188-9
[10] T. Fend, R. Pitz-Paal, O. Reutter, J Bauer, B. Hoffschmidt, Two novel high-porosity
materials as volumetric receivers for concentrated solar radiation, Solar Energy
Materials and Solar Cells 84 [1-4] (2004) 291-304.
https://doi.org/10.1016/j.solmat.2004.01.039
[11] S. Mey-Cloutier, C. Caliot, A. Kribus, Y. Gray, G. Flamant, Experimental study of
ceramic foams used as high temperature volumetric solar absorber, Solar Energy 136
(2016) 226-235. https://doi.org/10.1016/j.solener.2016.06.066
[12] L.J. Gibson, M.F. Ashby, Cellular Solids, Structure and Properties, 2nd edition,
Cambridge University Press, Cambridge, 1997.
https://doi.org/10.1017/CBO9781139878326
[13] C. D'Angelo, A. Ortona, Cellular ceramics produced by replication: a digital
approach, Advanced Engineering Materials, 14 [12] (2012) 1104-1109.
[14] S. Gianella, D. Gaia, A. Ortona, High temperature applications of Si-SiC cellular ceramics, Advanced Engineering Materials, 14 [12] (2012) 1074-1081
https://doi.org/10.1002/adem.201200012
[15] A. Ortona, T. Fend, H.W. Yu, K. Raju, P. Fitriani, D.H. Yoon, Tubular Si-infiltrated
SiCf/SiC composites for solar receiver application – Part 1: fabrication by replica and
electrophoretic deposition, Solar Energy Materials & Solar Cells, 132 (2015)
123-130. https://doi.org/10.1016/j.solmat.2014.08.029
[16] J. Binner, Ceramic Foams, in: M. Scheffler, P. Colombo (Eds.), Cellular Ceramics:
Structure, Manufacturing, Properties and Applications, Wiley-VCH Verlag GmbH & Co. KGaA, Weineim, FRG., 2005, pp. 33–56.
https://doi.org/10.1002/3527606696.ch2a
[17] P. Greil, T. Lifka, A. Kaindl, Biomorphic Cellular Silicon Carbide Ceramics from
Wood: I. Processing and Microstructure, J. Eur. Ceram. Soc., 18 [14] (1998)
1961-1973. https://doi.org/10.1016/S0955-2219(98)00156-3
[18] P. Greil, Biomorphous Ceramics from Lignocellulosics, J. Eur. Ceram. Soc., 21
(2001) 105-118. https://doi.org/10.1016/S0955-2219(00)00179-5
[19] H. Sieber, M. Singh, Microcellular Ceramic from wood, Cellular Ceramics, in: M.
Scheffler, P. Colombo (Eds.), Cellular Ceramics: Structure, Manufacturing, Properties and Applications, Wiley-VCH Verlag GmbH & Co. KGaA, Weineim,
FRG., 2005, pp. 122-136. https://doi.org/10.1002/3527606696.ch2e
[20] J.-M. Qian, Z.-H. Jin, X.-W. Wang, Porous SiC ceramics fabricated by reactive
infiltration of gaseous silicon into charcoal, Ceram. Intern. 30 [6] (2004) 947-951.
https://doi.org/10.1016/j.ceramint.2003.11.001
[21] H. Sieber, C. Hoffmann, A. Kaindl, P. Greil, Biomorphic Cellular Ceramics, Adv.
Eng. Mater. 2 (2000) 105-109.
https://doi.org/10.1002/(SICI)1527-2648(200003)2:3<105::AID-ADEM105>3.0.CO;2-P
[22] M. Singh, B.-M. Yee, Reactive processing of environmentally conscious, biomorphic
ceramics from natural wood precursors, J. Eur. Ceram. Soc. 24 [2] (2004) 209-217.
https://doi.org/10.1016/S0955-2219(03)00244-9
[23] D.A. Streitwieser, N. Popovska, H. Gerhard, G. Emig, Application of the chemical
biomorphic SiC ceramics derived from paper, J. Eur. Ceram. Soc. 25 [6] (2005)
817-828. https://doi.org/10.1016/j.jeurceramsoc.2004.04.006
[24] E. Vogli, J. Mukerji, C. Hoffman, R. Kladny, H. Sieber, P. Greil, Conversion of Oak
to Cellular Silicon Carbide Ceramic by Gas-Phase Reaction with Silicon Monoxide, J. Am. Ceram. Soc. 84 [6] (2001) 1236-1240.
https://doi.org/10.1111/j.1151-2916.2001.tb00822.x
[25] E. Vogli, H. Sieber, P. Greil, Wood derived porous and cellular ceramics, in 26th
Annual Conference on Composites, Advanced Ceramics, Materials, and Structures: B: Ceramic Engineering and Science Proceedings, 23 [4] (2002) 211-218.
http://dx.doi.org/10.1002/9780470294758.ch24
[26] E. Vogli, H. Sieber, P. Greil, Biomorphic SiC-ceramic prepared by Si-vapor phase
infiltration of wood, J. Eur. Ceram. Soc., 22 (2002) 2663-2668.
https://doi.org/10.1016/S0955-2219(02)00131-0
[27] C. Zollfrank, H. Sieber, Microstructure and phase morphology of wood derived
biomorphous SiSiC-ceramics, J. Eur. Ceram. Soc., 24 (2004) 495-506.
https://doi.org/10.1016/S0955-2219(03)00200-0
[28] P. Greil, T. Lifka, A. Kaindl, Biomorphic Cellular Silicon Carbide Ceramics from
Wood: II. Mechanical Properties, J. Eur. Ceram. Soc., 18 [14] (1998) 1975-1983.
https://doi.org/10.1016/S0955-2219(98)00155-1
[29] G. Qiao, R. Ma, N. Cai, C. Zhang, Z. Jin, Mechanical properties and microstructure
of Si/SiC materials derived from native wood, Mater. Sci. Eng. A 323 [1–2] (2002)
301-305. https://doi.org/10.1016/S0921-5093(01)01387-9
[30] C. Vincent, J. Dazord, H. Vincent, J. Bouix, L. Porte, Effet des conditions
expérimentales sur la CVD réactive de couches minces de TiC sur carbone, J. Cryst.
Growth. 96 [4] (1989) 871-880. http://dx.doi.org/10.1016/0022-0248(89)90647-7
[31] H. Vincent, J.L. Ponthenier, L. Porte, C. Vincent, J. Bouix, Influence des conditions
expérimentales du dépôt de SiC par RCVD sur l'infiltration de substrats de carbone
poreux, J. Less-Common Met. 157 [1] (1990) 1-13.