HAL Id: hal-01659176
https://hal.archives-ouvertes.fr/hal-01659176
Preprint submitted on 8 Dec 2017
HAL is a multi-disciplinary open access archive for the deposit and dissemination of sci-entific research documents, whether they are pub-lished or not. The documents may come from teaching and research institutions in France or abroad, or from public or private research centers.
L’archive ouverte pluridisciplinaire HAL, est destinée au dépôt et à la diffusion de documents scientifiques de niveau recherche, publiés ou non, émanant des établissements d’enseignement et de recherche français ou étrangers, des laboratoires publics ou privés.
Regional Purchasing Groups and Hospital Medicine
Prices: Evidence from Group Creations
Léa Toulemon
To cite this version:
Léa Toulemon. Regional Purchasing Groups and Hospital Medicine Prices: Evidence from Group Creations. 2017. �hal-01659176�
Regional Purchasing Groups and Hospital Medicine
Prices: Evidence from Group Creations
L´
ea Toulemon
∗October 13, 2017
Abstract
This paper estimates the impact of group purchasing on medicine prices in French hospitals, taking advantage of the entry of hospitals into regional purchasing groups between 2009 and 2014. This paper uses a new database providing the average annual prices paid for all innovative and costly medicines in public hospitals. Using a fixed effects model that controls for hospitals’ medicine-specific bargaining abilities and medicine-specific price trends, I find that group purchasing reduces prices of medicines in oligopoly markets, but has no impact on the prices of medicines with no competitors.
Keywords: hospital medicine prices, purchasing groups, bargaining ability JEL codes: C23, I11, J52, J58, L13, L14
∗Hospinnomics (PSE Paris School of Economics, Assistance Publique Hˆopitaux de Paris - AP-HP),
1, place du parvis de Notre-Dame, 75004 Paris. E-mail: lea.toulemon@psemail.eu I am grateful to Pe-dro Pita Barros, Eve Caroli, Albane Degrassat-Theas, Quoc-Anh Do, Brigitte Dormont, Izabela Jelo-vac, Pierre-Yves Geoffard, Audrey Laporte, Tobias M¨uller, Pascal Paubel, Laurie Rachet-Jacquet, Lise Rochaix, Anne-Fleur Roos, Marco Varkevisser,Etienne Wasmer, and seminar participants at LIEPP and Hospinnomics, as well as to the lolaHESG, the Irdes Applied Health Economics and Policy Evaluation Workshop, the AmericanEuropean Health Economics Study Group and the 26th European Workshop on Econometrics and Health Economics for useful comments and suggestions. All remaining errors are mine. I acknowledge support from a public grant overseen by the French National Research Agency (ANR) as part of the “Investissements d’Avenir” program (reference: ANR-11-LABX-0091, ANR-11-IDEX-0005-02). The author declares that there is no conflict of interest.
1
Introduction
Medicine prices are major concerns for public policy, and regularly give rise to contro-versies1. In particular, recent reports have raised awareness about the quick increase of
hospital inpatient medicine prices - NORC (2016) in the United-States, HSCIC (2015) in England, Duhamel & Morelle (2012) in France.
In European countries, the prices of retail medicines are negotiated with manufac-turers and set at the national level, often based on international comparisons (Kanavos et al. 2011). On the opposite, prices in the inpatient sector are based on tendering or negotiations by individual hospitals or hospitals purchasing groups. Individual negotia-tions between hospitals and manufacturers take place for instance in Austria, Germany, Finland, France, the United-Kingdom, Hungary and in the United-States - Vogler et al. (2012), Grennan (2014). Pharmaceutical companies can therefore engage in third-degree price discrimination by offering different unit prices to different hospitals.
This paper estimates the impact of purchasing groups on prices hospitals pay for in-novative medicines using a natural experiment: purchasing group creations. Controlling for medicine-specific hospitals’ bargaining ability, I find that regional purchasing groups depend on the level of competition. Hospitals get lower prices when they are in a purchas-ing group for medicines in oligopoly markets, and do not get lower prices of medicines in monopoly markets.
Innovative medicines are either the only treatment for a given disease, or one of the few treatments available. In France, the decision to prescribe is regulated by national
1For instance Jirillo et al. (2008) on the price of an expensive oncological medicine, Avastin. Alpern
et al. (2014) on the increase of old generic medicines prices in the United-States, or Trooskin et al. (2015) on prices of Hepatitis C medicines, which are rationed by Medicaid because of their high prices.
guidelines - the agreements on good use of care (Villepin 2005) - and medicines are directly reimbursed to hospitals by the National Health Insurance. The fact that hospitals get reimbursed makes hospitals solvent for innovative medicines - as long as the purchase price is lower than the reimbursement rates. In this setting, the pharmaceutical companies face inelastic demands and little constraints on pricing, especially when there are no competi-tors.
The wish to increase hospitals’ bargaining power has been one of the reason for hospi-tals to engage in group purchasing (Vincent & Montalan 2013). Since the 2000s, French hospitals are incentivized to engage in group purchasing, with several programs - Op-erah in 2006, PHARE in 2011, (Vincent & Montalan 2013). A national purchasing group with all university hospitals was created in 2005. In the late 2000s most hospitals have joined a purchasing group. These policies toward massification of purchases have two main objectives: to professionalize procurement and share buying costs, and to reduce and stan-dardize purchase prices. The move toward group purchasing has also taken place in other countries, for instance in the United-Kingdom, Germany, and Italy (Sorenson & Kanavos 2011), Austria, Finland, Ireland, the Netherlands, Portugal, Sweden (Vogler et al. 2010). However, the theoretical effects of purchasing groups on negotiated prices remain unclear, and the scarce empirical evidence shows mixed results - Burns & Lee (2008) survey hospital directors who report a decrease in prices for some products, but Grennan (2013) suggests that prices could increase.
The market structure for innovative medicines is characterized by low competition, as firms selling innovative medicines to hospitals are either monopolies or oligopolies. Theo-retical predictions are not clear-cut, and depend on whether a firm has competitors. If a pharmaceutical company is a monopolist who can price-discriminate, the optimal pricing
strategy is to give each buyer a price equal to its willingness to pay (Varian 1989). In this case, moving to more uniform prices would have a heterogeneous impact on the prices. The new price would lie between the highest and lowest price hospitals had paid under discrimination (Stole 2007).
In an oligopoly setting, the impact of more uniform prices is ambiguous and depends on demand symmetry. Demand is symmetric when companies agree about the ranking of high-price markets and low-price markets - the strong markets and the weak markets. If demand is symmetric, the situation is similar to price discrimination in the monopoly case, a shift to more uniform prices decreases the average price in the strong market and increases the average price in the weak market - Corts (1998), Stole (2007), Armstrong (2006). However, these findings do not take into account the possible changes in the bar-gaining powers. To the best of my knowledge, Grennan (2013) is the only paper studying the impact of hospital group purchasing using actual data on transaction between firms and hospitals. The author study the market for medical devices - the coronary stent in-dustry - in the United States by simulating hospital mergers. The author points out that hospitals’ demands for stents are asymmetric and that consequently, more uniform pricing would soften competition and increase prices. Therefore, there must be an important gain in bargaining power to compensate this effect and for prices to be lower with group pur-chasing.
This paper allows to assess the net impact of these two effects: the changes in com-petition levels and the changes in hospitals’ bargaining powers. Demands are more likely to be symmetric across hospitals for innovative medicines than for stents, the later being physician preference items, mainly chosen by surgeons (Lerner et al. 2008). In addition, group purchasing may increase hospitals bargaining power, as suggested by Grennan (2013)
which would decrease average prices.
I use a unique dataset containing information on prices each hospital obtained for a group of innovative medicine between 2009 and 2014, accounting for about half of the expenditures for medicines in hospitals. This is one of the few databases with actual buyer-supplier transfers. There are different levels of purchasing groups: local, regional or national. I focus on the regional groups, the most common among public hospitals today, except for the thirty-two university hospitals.
The paper is structured as follows. In Section 2, I describe the institutional setting and my database. Section 3 and Section 4 present the identification strategy and the descriptive statistics. Section 5 shows the results. The final Section concludes.
2
Medicine Expenditures in Hospitals: Context and
Data
This section gives information about the funding of innovative and expensive medicines used in this paper.
2.1
The outside-HSG list
Patients do not pay for medicines they get when hospitalized. Hospitals buy medicines through a tendering process, which can be specific to a particular medicine, or to a ther-apeutic class. Then, medicines are used for a patient in a given homogeneous stay group (hereafter HSG). Since 2005, and the implementation of activity-based payment, most medicines are funded through the fees the National Health Insurance pays to the hospital
for each HSG. However, some medicines have emerged as exceptions to the general rule and are not reimbursed through HSGs. They are reimbursed separately on the basis of the purchasing volumes and prices transmitted to the National Health Insurance. Given the incentive hospitals have to report this information for reimbursement purposes, the National Health Insurance has exhaustive information on prices. More details about hos-pital funding and the implementation of activity-based payment can be found in Appendix, Section B.
This paper focuses on medicines from the liste en sus - also called Liste hors GHS (outside HSG list). This list comprises medicines for which funding through the HSG is not a good fit, because they are expensive and not systematically used for a given HSG, which could lead to important cost heterogeneity within a HSG. The outside-HSG list aims to ensure equal access to costly treatments across regions and hospitals. It also stimulates innovation by helping to fund new and expensive medicines. The medicines from this list accounted for 55% of medicine expenditures in hospitals in 2011, and their share in hospital medicine expenditures is constantly increasing (Comit´e ´economique des produits de sant´e 2011). To be included in the list, a medicine has to be classified as useful by the National Health Authority (HAS), it must be significantly more expensive than the rest of medicines in the same HSG, and not systematically used in a given HSG.
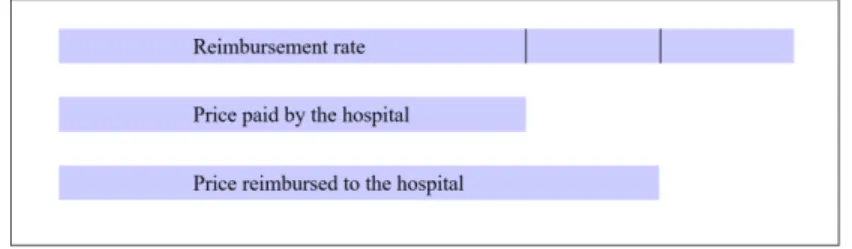
When a medicine enters the list, the firm producing it and the Economic Commit-tee for Health Products (CEPS) negotiate to set a fixed reimbursement rate (Tarif de responsabilit´e). These reimbursement rates were implemented in 2005, and contributed to a convergence of medicine prices across hospitals (Degrassat-Th´eas et al. 2012). The National Health Insurance reimburses the hospital for the medicine based on the following formula, and illustrated by Figure 1, in Appendix, Section A.
Reimbursement = price + rate 2
If the hospital buys at a price lower than the reimbursement rate, the mark-up is shared between the National Health Insurance and the hospital: the National Health Insurance reimburses the average between the fixed rate and the price the hospital pays. If the hospital buys above the reimbursement rate, the National Health Insurance repays the reimbursement rate. In practice, this situation is rare - in my database, less than 5% of medicines prices are more than 5% above the reimbursement rate. This system aims to split the gain from price negotiation between the hospitals and the National Health Insurance, while maintaining an incentive for the hospitals to obtain low prices.
2.2
Data
I use a database with information about prices and quantities of medicines from the outside-HSG list bought by public hospitals between 2008 and 2014. In order to be reimbursed, hospitals report prices and quantities of medicines dispensed on the outside-HSG list to the Technical Agency of Information on Hospitalization (Agence technique sur l’hospitalisation, ATIH). Price reporting is compulsory since July 2008, therefore I exclude all observations of year 2008 from my sample. There are 714 hospitals in the database, including 83 local hospitals, 31 university hospital, and 19 centres for cancer research.
The ATIH database contains one line for the use of a medicine for a given patient at a given hospital. It includes both medical product identifiers and patient identifiers. The medicine identifier is the Common Unit of Dispensation code (CUD), which identifies a
given chemical or biological substance, produced by a given pharmaceutical company in a given pharmaceutical form.
I merged this data with several public datasets, thanks to the hospital and medicine identifiers. Data on hospitals include quality indicators from Hospidiag. With the CUD code, I could merge the database with information about when the medicine was on the Outside-DRG list, thanks to the database provided by the “Omedit Centre” (Regional Monitoring Centre for Medicines, Centre Region). I also added the Anatomical Thera-peutic Chemical (ATC) code, and the pharmaceutical company that produces it. This information was collected on the National Health Insurance website and on the “Club In-ter Pharmaceutique” website (Pharmaceutical Industry’s Association).
Information about which hospital is part of a regional or national purchasing group does not appear in the ATIH database. I have collected the information on group purchasing by contacting each regional purchasing group. The list of regional purchasing group comes from the website alliance-groupement.fr, a network of purchasing groups. I was able to collect information on year of entry for 150 hospitals in eight regional purchasing groups. Four groups were created between 2009 and 2014. In addition, there are three regions and 76 hospitals where there are no regional purchasing group in 2016: hospitals in theses regions are never members of a regional purchasing group.
3
Empirical Strategy and Estimator
My database is a three dimensional panel, with one observation per hospital, per medicine and per year. I take advantage of this structure to build a model that controls for the potentially heterogeneous effects of hospitals and time on medicine prices.
My model includes a medicine-hospital fixed effect. This allows for a heterogeneous impact of hospital on the price of each medicine. The estimation is different from having both medicine and hospital fixed effect if and only if the impact of hospital on medicine prices depends on the medicine. This is likely to be the case, as the bundles of medicines bought vary across hospitals, and hospitals could exert more pressure in the price negoti-ation of the medicines they use the most.
The other set of fixed effects taken into account in the model are price - medicine fixed effects. Medicine prices vary across time. Annual prices of medicines can vary for many reasons - a new competitor, changes in population health. Since hospitals are more likely to be in a regional purchasing group over time, macro changes of medicine prices could introduce a bias in my estimates. I use medicine - year fixed effects to account for these confounding factors. These fixed effects are equivalent to including a medicine-specific time trend, with a fully flexible impact of time on each medicine considered.
These two sets of fixed effects encompass hospital fixed effects (through the set of hospital-medicine fixed effects), year fixed effects (through the medicine-year fixed effects), and medicine fixed effects (through both). In the end, what I measure is how the price of a medicine in a specific hospital varies when this hospital belongs to a regional purchasing group (in percentage points), and compare this variation to the variation of price for the same medicine in other hospitals this year. In a robustness check, I show how the results vary when we use different fixed effects.
I estimate the following model:
Where ln pijt denotes log price of medicine j in hospital i at year t, αij the hospital
-medicine fixed effect, βjt the medicine - year fixed effect, and εijt the effect of unobserved
variables. Standard errors are clustered at the hospital level.
Because of the inclusion of hospital - medicine fixed effects, which encompass hospital fixed effects, identification relies on hospitals joining a regional purchasing group during the period 2009-2014. Most hospitals join a group when it is created, therefore the year at which they join the group is unlikely to be correlated with variation in hospital characteristics. The main assumption for estimating γ is the exogeneity assumption:
E(εijt|αij, βjt, groupit, t) = 0
for t = 2009,...,2014
Fifty-four hospitals in my sample join a regional purchasing group during the period and appear in the database both before and after joining the group. Hospitals never changing group membership contribute to the estimation only through the estimation of medicine-year fixed effects on prices. Alternative specifications are presented in Appendix, Section C.
4
Descriptive Statistics
4.1
Sample selection
The medicines I use in this study are all innovative and expensive, and competition is relatively low. Degrassat-Th´eas et al. (2012) study the evolution of oncologic drugs prices from the Liste hors-GHS between 2004 and 2007. They show that prices have become more homogeneous with the implementation of the fixed reimbursement rates. Bargaining
has moved from the hospital level to the national level, and few hospitals manage to get a price lower than the national rate when a firm has no competitors. Thus, I expect to find no impact on medicines that do not have competitors. Some medicines have several therapeutic indications, and can be the only treatment for a specific disease, but in com-petition with other medicines for another pathology. I use a sample of medicines for which I can identify whether the market is an oligopoly or monopoly, based on the Anatomical Therapeutic Chemical (ATC) Classification System and the Herfindahl Indices. Details about the identification of monopoly and oligopoly drugs are given in Appendix, Section D
As for hospitals, I only consider hospitals which are not university hospitals or centres for cancer research - which all belong to national purchasing groups - or local hospitals, which buy few expensive drugs. This leaves a total of 570 hospitals. I drop hospitals for which regional group membership is missing, 250 hospitals remain. I withdraw then hospitals that belong to the national purchasing group of university hospitals even though they are not university hospitals. Most hospitals join the groups the year of their creation, or the year of the first common purchase - usually one year after the group creation. I exclude the five hospitals which joined a group after it was created, two in the treatment group, three in the control group, because their enrolment may be endogenous - I will check whether it changes the results in a robustness check. My final sample is comprised of 251 hospitals, among which 52 changed group membership during the period. Given the medicines and hospitals selection, the final sample is comprised of 45, 000 observations, with 6, 800 observations for monopoly medicines and 9, 100 for oligopoly medicines.
The measure of the effect of purchasing groups relies on forty-eight hospitals that are in four regions where a group was created between 2009 and 2014, the treatment group. For two of these regions, there was a subregional group coordinated by a large hospital.
At some point, the hospital coordinator left the subregional group to go the the national group of university hospitals. Other hospitals had to find another coordinator, so they take this opportunity to create a regional group as advised by national programs. The other hospitals of the final sample form the control group, they are used to control for trends in medicine prices.
4.2
Hospitals’ characteristics
The estimation relies on different groups of hospitals. I compare the characteristics of hospitals belonging to these groups using nine indicators about activity and quality of care, which descriptions are in Appendix, Section ??.
Table 1 shows how hospitals in the sample compare to hospitals not included in the sample, excluding university hospitals and centres for cancer research. The hospitals “Out of the sample” are mainly hospitals with missing information about group membership. The comparison of hospitals in and out of the sample gives insights about the external va-lidity of the results. We see that there are no significant differences in the nine indicators used, except for the fraction of pills bought which are blood and blood forming organs, more used in the sample.
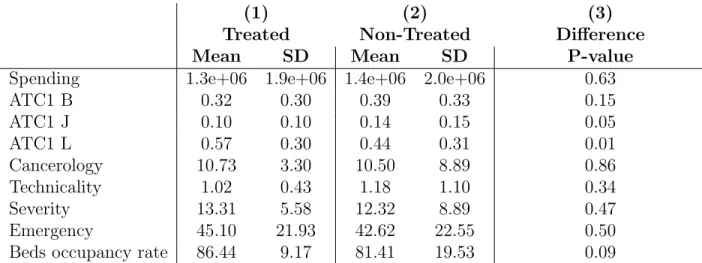
Within hospitals included in the sample, Table 2 presents characteristics of hospitals entering a group and hospitals not entering - either always in a group or never. This is a comparison of my treatment and control group. There are no significant differences, except the fraction of pills of antineoplastic and immunomodulating agents, which is higher in the treatment group. This difference is not likely to bias the results, because I use a model that measure price variation within a given medicine. Overall, hospitals in the treatment and control groups are similar, which makes the common trend assumption credible.
Finally, I focus on hospitals in the control group, whose purchasing group membership does not change over the period. I compare hospitals in regions with the first regional purchasing groups, which were created before 2009, to hospitals never in a group which regional groups are not yet created. Table 3 presents the results. The two groups of hospitals are very similar, none of the differences are significant at the 5% level.
4.3
Price variations
This section shows how prices have changed in the different groups considered. First, we can see the variation of average prices and average reimbursement rates during the period. Figures 4, 5 and 6, in Appendix, Section D.3 show that average prices and average reim-bursement rates have increased in a similar pattern. Comparing Figures ?? and ?? enables to see that on average, hospitals manage to get lower prices than the reimbursement rates for medicines identified as oligopolies, but not for medicines in monopolies. For the latter, the prices are very close to the reimbursement rates. This suggests that reimbursement rates are used as a benchmark for price bargaining both by hospitals and pharmaceutical firms. For monopoly medicines, bargaining over prices is mainly centralised and happens when the reimbursement rates are negotiated. On the opposite, for oligopoly medicines, some hospitals manage to get prices lower than reimbursement rates, which enable them to get a margin.
I also show how prices have moved in hospitals used as a treatment group - hospitals entering a regional purchasing group between 2009 and 2014 - and compare them to the control group - hospitals always in a group and never in a group. We can notice the average prices changes in the groups contributing to the estimation in Figures 7, 9 and 8 - Appendix, Section D.3. The group engaging in group purchasing in 2010 have similar average prices than the control group in 2009. Afterwards, average prices seem to increase. As for the
group entering in 2011, trends before entry are similar to trends in the control group. We notice a decrease in average prices for all medicines and oligopoly medicines after 2011. The group entering in 2014 have similar patterns than the control group overall. These figures give us an overview of the price variation within each group. However, they do not enable to draw conclusions about the impact of group purchasing because the compositions of hospitals and medicines change from one year to the other. To assess the impact of group purchasing, we have to focus on variation within hospitals and within medicines.
4.4
Hypothesis testing
The estimation is based on a Difference-in-Difference method, comparing hospitals entering a group with hospitals of the control group. The main assumption is the common trend assumption: without treatment, the evolution of log prices in the treatment and the control group would have been the same. This cannot be tested directly, as we do not observe potential outcomes - we do not know what prices the treatment group would have had without treatment. However, we can compare trends in the treatment and control group before treatment. This is not a standard Difference-in-Difference setting, as hospitals enter purchasing groups at different times: either in 2010, 2011 or 2014. Hospitals joining the groups in 2011 and 2014 are in the database at least two years before they join. This allows to measure the differences in trends before treatment, by running the following regression
ln pijt = 4 X k=−5 δ1kwkijtmonopoly + 4 X k=−3
δ2kwkijtoligopoly + αij + βjt+ εijt
Where ln pijt denotes log price of medicine j in hospital i at year t, αij the hospital
-medicine fixed effects and βjt the medicine - year fixed effects. k is the year of entry, for
years. Standard errors are clustered at the hospital level.
Nine hospitals enter in 2011, and thirteen enter in 2014. As my database spans five years - from 2009 to 2014 - the possible distances to entry are five years before, for the hospitals entering in 2014 to four years after, for the twenty-seven entering in 2010. For hospitals entering purchasing groups, the sumP4
k=−5δ1kwkijtis collinear with the hospital
- medicine fixed effect. I normalize w(k=−1)ijt to zero without loss of generality. A testable
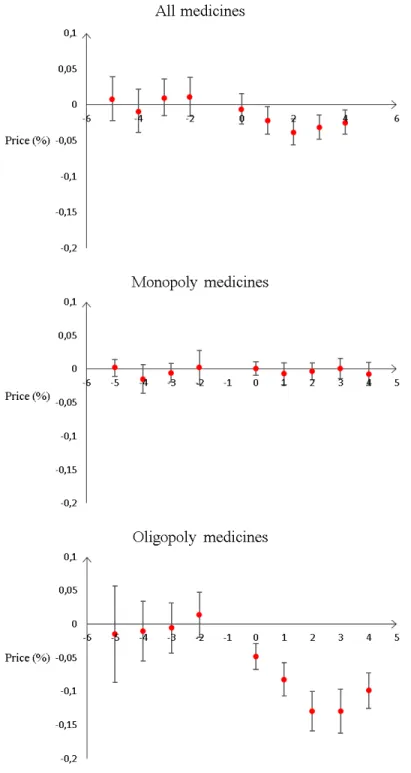
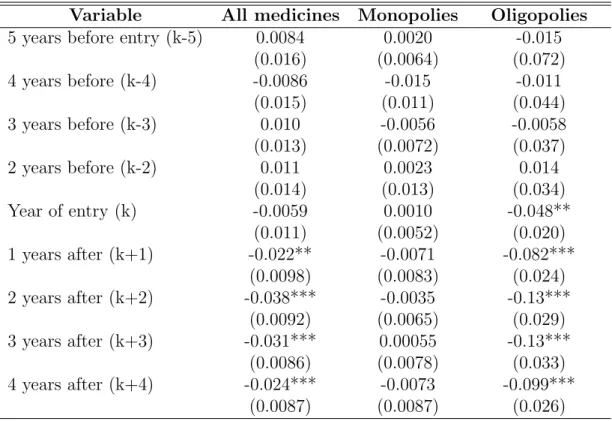
implication of the common trend assumption is the equality between k − 5 to k − 2, and k − 1. As k − 1 is normalized to zero, the difference is given by the value and significance of k − 5, k − 4, k − 3, k − 2.
We can see on Figure 3 (in Appendix, Section D) that these coefficients - k − 5 to k − 2-are not significant for all medicines, and both for monopolies and oligopolies. The joint significance of k − 5 to k − 2 is 0.10 for all medicines, 0.34 for monopoly medicines, and 0.86 for oligopoly medicines. Prices in hospitals entering purchasing groups are not following specific trends before entry.
5
Results
5.1
Main results
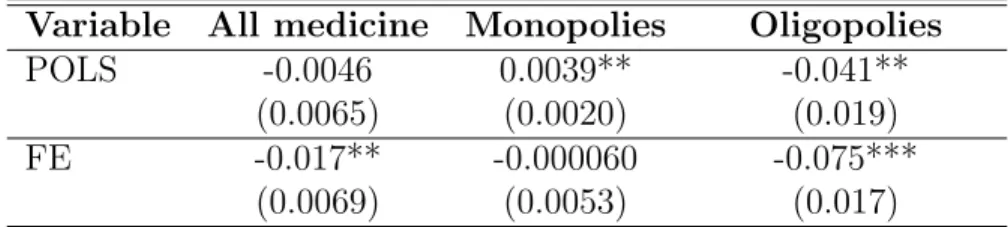
Table 4 presents the average effects of belonging to a group for all medicines, monopoly medicines and oligopoly medicines, using the fixed-effect model (FE, row two) described in Section 3, and comparing it to Pooled Ordinary Least Squares - row one, POLS. As for the Pooled OLS model presented in equation 2, we can see that on average, hospitals in a purchasing group do not get significantly different prices for all medicines. When we look at different medicines, we see heterogeneous correlations depending on market struc-ture. Hospitals in a regional purchasing group get higher prices for medicines that have
no competitor (“monopoly medicines”). The effect is a 0.4% increase, it is significant at 5%. On the opposite, prices are lower when belonging to a group for medicines that have competitors. The effect is a 4% decrease, significant at 5%. These results only capture the correlation between group membership and medicine prices, but do not identify a causal impact. Indeed, when controlling for hospitals time-invariant unobserved characteristics, results are different.
Estimating equation 1, a fixed effect model allowing hospitals to have medicine specific bargaining abilities, I find different results - row two of Table 4. Belonging to a regional purchasing group has a significant impact on medicine prices, they decrease by 2% on av-erage. There is no longer a significant impact of group purchasing for monopoly medicines, the 95% confidence interval going from −1% to 1%. As for oligopoly medicines, average price are 7.5% lower when hospitals are in a regional purchasing group. Overall, once I take into account hospitals’ time-invariant characteristics, group purchasing is associated with a larger decrease in prices.
5.2
Robustness checks
I conduct several robustness checks. Tables 6, 8 and 7, in Appendix, section ?? present the results for these estimations.
The two first sets of robustness checks address two weaknesses of my identification strategy, using alternative control (Tables 6) and treatment groups (Table 7). The control group of the main results is comprised of hospitals either always in a group of never in a group. Table 6 uses as alternative control group hospital never in a group only - column (2) - or always in a group only -column (3). If we compare the results using these control group to the baseline estimation - column (1) -, we see that they are very similar, and standard errors are slightly higher.
In a second set of robustness checks focused on the treatment group, I change the pool of purchasing groups included in the study - Table 7. My results rely on the specific cases of four purchasing groups created between 2009 and 2014. To check whether the impacts are driven by one of these groups, I estimate the same model but excluding one of the four purchasing groups - Table 7. For all medicines, the coefficients are always negative, between −1% and −2%, and always significant, except when I withdraw the larger group (column 1) - then it is still negative but not significant. As for monopoly medicines, the coefficients are close to zero in each case. The results on oligopoly medicines are always significant. The results vary from −5% to −10%
Finally, I present robustness checks aiming at changing the specification - Table 8. In column (1) - I use alternative fixed effects : hospital fixed effects and medicine fixed effects, assuming that the impact of hospitals heterogeneity on medicine prices is homogeneous. Then, I withdraw extreme values for prices - column (2). In another set of results, I esti-mate the same model but focusing on hospital - medicine pairs that are in the database for the whole period, to hold the pool of hospitals and medicines constant - column (3). I also withdraw the entry year, in case the regional group takes time to obtain lower prices - column (4). In column (5), I use an alternative definition of monopoly and oligopoly medicine, using the threshold 0.8 for the Herfindahl Index, instead of above 0.9 for monop-olies and below 0.7 for oligopmonop-olies. Finally, I include hospitals that have entered a regional purchasing group another year than the year of group creation in the set of treated hospi-tals - this adds two hospihospi-tals in the treatment group and three in the control group.
Overall, the impact of purchasing group on prices is never significant for monopolies, and negative and significant for oligopolies. The size of the impact on monopoly medicines
ranges between −0.7% and 0.1%. The coefficients for oligopoly medicines are between 6% and 13%. When I change the set of fixed effects, considering that the bargaining power of hospitals is constant across medicines, the overall impact of entering a group is no longer significant. The fact that I find different results suggests that hospitals’ bargaining ability are not constant across medicines. Therefore, the right specification is to allow for hetero-geneity in hospitals’ bargaining abilities across medicines.
Overall, the patterns remain the same. Entering a regional purchasing group decreases prices by one or two percentage points when considering the whole pool of medicines. It does not impact prices of monopoly medicines, and it decreases prices for oligopoly medicines, decreasing prices by about 5-10%.
6
Conclusion
This paper is a first attempt to estimate the impact of regional purchasing group creation on innovative medicines prices in French hospitals. I use a unique database that includes all public French hospitals and about half of expenditures for medicines in hospitals. On average, belonging to a purchasing group allows hospitals to get prices which are 2% lower for innovative medicines. When focusing on medicines whose market structure can be iden-tified, I find no impact for medicines that have no competitors, but a 8% decrease in the prices for medicines in oligopoly markets. Purchasing groups increase hospitals bargaining ability, especially when there are at least some companies producing the same substance.
This study has several limitations. First, my sample of hospitals joining a regional purchasing group is limited (fifty-four hospitals). Second, I measure gains in prices for a given medicine. If purchasing groups enable to switch to cheaper medical products,
this benefit is not captured. Such an analysis would require to have knowledge about the level of substitutability between medicines, which is challenging because it depends on the pathology the medicine is used for. Finally, due to data limitation, only innovative and costly medicine which are directly reimbursed by the National Health Insurance are included - approximately one half of hospital expenditures for medicines.
References
Alpern, J. D., Stauffer, W. M. & Kesselheim, A. S. (2014), ‘High-cost generic drugsimplica-tions for patients and policymakers’, New England Journal of Medicine 371(20), 1859– 1862.
“ANSM” (2012), Analyse des ventes de m´edicaments en france en 2011, Technical report, Agence Nationale de S´ecurit´e du M´edicament et des Produits de Sant´e.
Armstrong, M. (2006), ‘Recent developments in the economics of price discrimination’. Burns, L. R. & Lee, J. A. (2008), ‘Hospital purchasing alliances: utilization, services, and
performance’, Health Care Management Review 33(3), 203–215.
Comit´e ´economique des produits de sant´e, C. (2011), Rapport d’activit´e 2011, Technical report, CEPS.
Corts, K. S. (1998), ‘Third-degree price discrimination in oligopoly: all-out competition and strategic commitment’, The RAND Journal of Economics pp. 306–323.
Degrassat-Th´eas, A. (2013), Prix, concurrence et rgulation : soutien l’innovation et prix des m´edicaments l’h ˆopital, PhD thesis, Ecole doctorale de Dauphine.
Degrassat-Th´eas, A., Bensadon, M., Rieu, C., Angalakuditi, M., Le Pen, C. & Paubel, P. (2012), ‘Hospital reimbursement price cap for cancer drugs’, Pharmacoeconomics 30(7), 565–573.
Duhamel, G. & Morelle, A. (2012), ‘Evaluation du dispositif de financement des m´edicaments en sus des prestations d’hospitalisation dans les ´etablissements de sant´e’, Inspection g´en´erale des affaires sociales Rapport IGAS no RM2012-044P .
Grennan, M. (2013), ‘Price discrimination and bargaining: Empirical evidence from med-ical devices’, The American Economic Review 103(1), 145–177.
Grennan, M. (2014), ‘Bargaining ability and competitive advantage: Empirical evidence from medical devices’, Management Science 60(12), 3011–3025.
HSCIC (2015), ‘Prescribing costs in hospitals and the community: England 2014-15’. Jirillo, A., Vascon, F. & Giacobbo, M. (2008), ‘Bevacizumab in advanced cancer, too much
or too little?’, Annals of oncology 19(10), 1817–1818.
Kanavos, P., Vandoros, S., Irwin, R., Nicod, E. & Casson, M. (2011), ‘Differences in costs of and access to pharmaceutical products in the eu’.
Lerner, J. C., Fox, D. M., Nelson, T. & Reiss, J. B. (2008), ‘The consequence of secret prices: the politics of physician preference items’, Health Affairs 27(6), 1560–1565. NORC (2016), ‘Trends in hospital inpatient drug costs: Issues and challenges’. Or, Z. (2009), ‘Activity based payment in france’, Euro Observer 11(4), 5–6.
Scheller-Kreinsen, D., Geissler, A. & Busse, R. (2009), ‘The abc of drgs’, Euro Observer 11(4), 1–4.
Sorenson, C. & Kanavos, P. (2011), ‘Medical technology procurement in europe: A cross-country comparison of current practice and policy’, Health policy 100(1), 43–50.
Stole, L. A. (2007), ‘Price discrimination and competition’, Handbook of industrial organi-zation 3, 2221–2299.
Trooskin, S. B., Reynolds, H. & Kostman, J. R. (2015), ‘Access to costly new hepatitis c drugs: Medicine, money and advocacy’, Clinical Infectious Diseases p. civ677.
Varian, H. R. (1989), ‘Price discrimination’, Handbook of industrial organization 1, 597– 654.
Villepin, D. D. (2005), ‘D´ecret no 2005-1023 du 24 aoˆut 2005 relatif au contrat de bon usage des m´edicaments et des produits et prestations mentionn´e `a l’article l. 162-22-7 du code de la s´ecurit´e sociale’.
Vincent, B. & Montalan, M.-A. (2013), ‘Les d´eterminants de la performance d’un groupe-ment conventionnel d’achats hospitaliers de m´edicaments et dispositifs m´edicaux’, Jour-nal de gestion et d’´economie m´edicales 31(4), 228–240.
Vogler, S., Habl, C., Leopold, C., Mazag, J., Morak, S. & Zimmermann, N. (2010), ‘Phis hospital pharma report’, Vienna: Pharmaceutical Health Information System .
Vogler, S., Zimmermann, N., Habl, C., Piessnegger, J., Bucsics, A. et al. (2012), ‘Discounts and rebates granted to public payers for medicines in european countries’, South Med Rev 5(1), 38–46.
WHO Collaborating Centre for Drug Statistics Methodology (2012), ‘Guidelines for atc classification and ddd assignment 2013’.
Appendix
A
Context and Data
B
Hospital funding
Law 2003-1199 of December 2003 reformed the core principles of hospital financing in France. Before 2004, public hospitals’ budgets were annual budgetary envelopes, mainly determined by the previous year’ budgets. From 2005 to 2008, activity-based payment was implemented gradually in all hospitals (Degrassat-Th´eas 2013). In the current system, hospitals’ budgets depend on the number and case-mix of patients (Or 2009).
The objectives of this payment system are to increase transparency and to induce ef-ficiency (Scheller-Kreinsen et al. 2009). Before activity-based payment, hospital budgets were subject to important agency problems, because budgets were not related to efficiency, or even to activity. The third-party payer had little information on hospitals efficiency. Implementing activity-based payment means creating a classification of diagnostics and their average costs as a way of improving transparency. The second objective is efficiency. The alternative funding rules are overall budget or fee-for-services. Overall budget based on historical costs penalizes efficiency because it gives lower budgets to hospitals with lower expenditure. Fee-for-service may lead to unnecessary care. On the opposite, activity-based payment should theoretically reward efficiency, as long as fees are accurately set.
The case-mix is defined through the creation of homogeneous patient groups (Groupes homog`enes de malades), based on the American Diagnosis Related Groups (DRG). A homogeneous stay group (Groupe homog`ene de s´ejour, hereafter HSG) corresponds to each DRG. Then, a reimbursement rate is assigned to each HSG, with different levels of severity.
C
Alternative specifications
The main hypothesis made in this paper is the exogeneity of group creation, given hospi-tals time-invariant characteristics. Two alternative hypothesis could be made, (1) group membership does not depend on hospitals characteristics, (2) group creation depends on time-varying hospitals’ characteristics.
If group creation is exogenous, the accurate model would be a regression with medicine-specific time trends but not hospital-medicine medicine-specific fixed effects (Pooled Ordinary Least Square).
ln pijt= βjt+ γgroupit+ εijt (2)
Where ln pijt denotes log price of medicine j in hospital i at year t, βjt the medicine - year
fixed effect, and εijt the effect of unobserved variables.
If group creation is endogeneous, and depends on time-varying factors that also im-pact medicines prices, an instrumental-variable strategy should be used. A good instru-ment would be a time-varying variable that impacts group creation, but has no effect on medicines prices. Hospitals could decide to enter groups when their financial situation is deteriorating for other reasons than changes in medicines prices, and they need the help of the purchasing group to manage to buy cheaper medicines. To investigate this possibility, I run the following equation:
Group memberijt = αij + βjt+ γFi,t−1+ εit (3)
Where Group memberit is a dummy with value one when hospital i is in the group at year t, αij are hospital-medicine fixed effects, and βjt are medicine-year fixed effects. Fi,t−1 are
financial indicators at t − 1.
The information about hospitals’ finances come from Hospidiag, a public database on hospitals’ performance. Nine financial indicators are available from 2009 to 2014: (1) the mark-up the hospital makes, which enables it to finance its investment, (2) the ability to invest, (3) financial independence, (4) investment intensity, (5) the wear and tear rates of equipment and (6) buildings, (7) the need of funding arising from routine operation, (8) resources stability, (9) the risk that receivables owed to the hospital will not be recovered, and (10) the average payment term. I take lagged indicators to avoid reverse causality. The F-test of joint significance of the financial indicators is 0.67. Therefore, hospitals’ finances are unrelated to group membership, and cannot be used as excluded instruments. In addition, anecdotal evidence from regional purchasing group managers suggests that group membership is not linked to any hospitals characteristics, which makes the use of instrumental variables challenging.
D
Descriptive statistics
D.1
Drug samples
I rely on the Anatomical Therapeutic Chemical (ATC) Classification System, developed by the World Health Organization Collaborating Centre for Drug Statistics Methodology (WHOCC). The ATC classification sorts active ingredients of medicines, according to their therapeutic, pharmacological and chemical properties. The ATC code has different levels of detail. The more general is the anatomical main group, which has fourteen categories. The bottom-level ATC code is the substance level, identified with seven letters and dig-its. For instance, infliximab is a chemical substance identified by the code “L04AB02”, where “L” is the anatomical group, antineoplastic and immunomodulating agents, “L04” is the therapeutic subgroup, Immunosuppressants, and “L04AB” stands for Tumor necrosis factor alpha (TNF-α) inhibitors, the chemical subgroup (WHO Collaborating Centre for Drug Statistics Methodology 2012).
In my database, three groups of this first level account for 96% of the observations: group “B”, Blood and blood forming organs (35%), group “J” antiinfectives for systemic use (15%) and group “L”, antineoplastic and immunomodulating agents (46%). Regarding the bottom-level, I have 120 distinct categories. As for the CUD code, for Infliximab, there is a single CUD: “REMICADE 100 mg powder for solution for de 20 ml bottle-infusion ”, Remicade being the brand name.
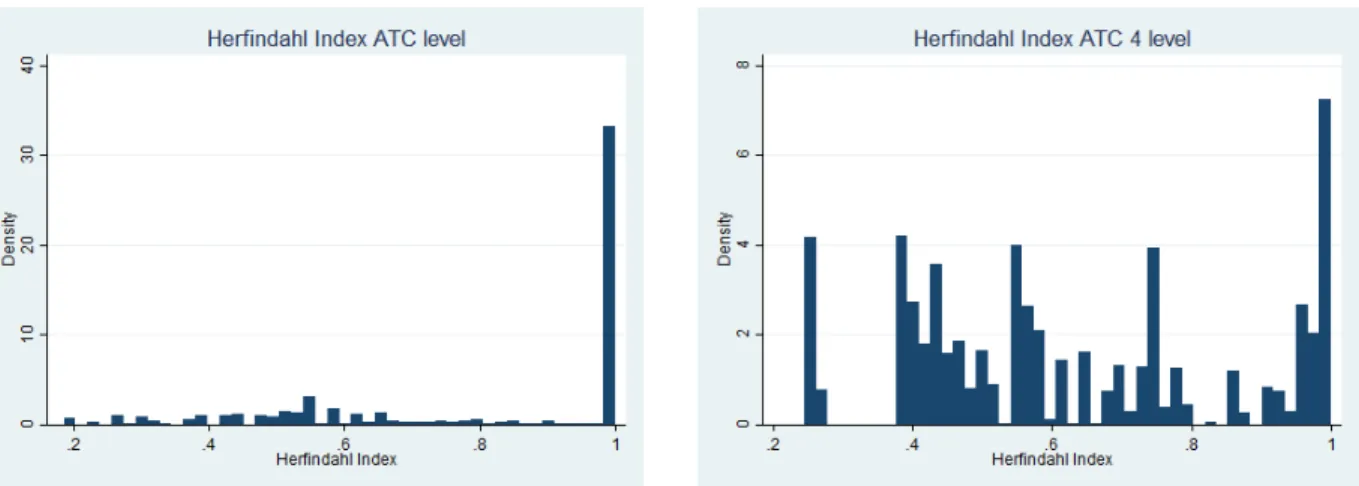
I want to identify CUD codes for which there is only one pharmaceutical company on the market, in a monopoly situation, and CUD codes that have substitutes produced by other firms. Hereafter, I will call these groups “monopoly medicines” and “oligopoly medicines”. An important question while doing so is the definition of the market, which could be the most detailed ATC level, i.e. substance level, or the chemical subgroup level (ATC fourth level). Some medicines will be substitutable with other medicines with the same chemical subgroup, while some are not substitutable at the fourth level. I compute the Herfindahl-index at these two levels. The Herfindhal Index is the sum of each company’s market share squared.
HI =
n
X
i=1
ai2
where ai is the market share of firm i and n the number of firms. If a firm is alone in
a market, the Herfindhal Index will have the value one. If n firms have equal market shares, the Index will be n1. Graph 2, in Appendix, shows the distributions of both indices. I identify as monopolies medicines which have no competitor at both levels, or where a single firm covers more than 95% of the market at the substance level and at the ATC 4 level - Herfindahl Index greater that 0.9. On the opposite, I identify as oligopolies the medicines that have competitors at the substance level - Herfindahl Index lower that 0.7.
Figure 2: Identifying monopolies and oligopolies
Note - These graphs show the distribution of Herfindahl indices for all medicines in the database, at the ATC level - substance level -, and at the ATC 4 level - chemical subgroup.
With this classification, I remain agnostic about which medicines are substitutes at the ATC 4 level, because I exclude medicines for which there are competitors at the ATC 4 level but no competitors at the substance level. I exclude from the groups medicines whose status (monopoly or oligopoly) changes over time, and medicines that appear in less than fifty hospitals. I do so because my estimates rely on comparisons of prices across time and hospitals. In the end, the “monopoly medicine” group corresponds to 15% of the sample, and the “oligopoly” group accounts for 20%. In the monopoly group, 74% of observations are antineoplastic agents, 14% are immunostimulants, and 10% are antimycotics. Half of the “oligopoly” group are biosimilar versions of a biological medicine - erythropoietin, or EPO. Erythropoietin is a hormon controlling blood cell production; it is used to treat anemia. Polyvalent immunoglobulins of human plasma origin, account for another 40% of the “oligopoly” group. The rest of the competition group is made of coagulation factors. Among the eight substances associated with the largest expenditure in hospitals (“ANSM” 2012), three belong to the monopoly group, and two are in the oligopoly group.
D.2
Hospital samples
I use nine indicators. The first one is a measure of total purchases at median prices, which measures the size of the hospital-buyer. Then, I present the shares of quantities of pills in each of the three major anatomical groups. Finally, I present indicators from Hospidiag, which provides measures of hospitals’ activity and performance. I choose five other in-dicators, the first one being oncology - the percentage of activity in oncology -, because most medicines of the “liste en sus” are oncological drugs. The four other indicators are quality indicators: technicality, severity, emergency, beds occupancy. Technicality is the
Figure 3: Prices before and after group entry, as compared to prices one year before entry
Note - This Table shows how all medicine prices vary depending on the number of years before or after group creation, using hospital - medicine fixed effects and medicine - year fixed effects. The reference year is the year before entering a purchasing group. The outcome is log prices. Standard errors clustered at the hospital level in parenthesis. In this table, we can see that within a hospital-medicine pair, log prices before treatment do not significantly differ from log prices one year before treatment, for all medicines, for oligopoly medicines and for monopoly medicines. On the opposite, log prices are significantly different from log prices one year before treatment for all medicines and oligopoly medicines one to four years after25
Table 1: Hospitals in and out of the the sample
(1) (2) (3)
In sample Out of sample Difference Mean SD Mean SD P-value Spending 1.3e+06 2.6e+06 1.4e+06 2.0e+06 0.63 ATC1 B 0.54 0.40 0.38 0.32 0.00 ATC1 J 0.10 0.15 0.13 0.14 0.00 ATC1 L 0.35 0.35 0.47 0.31 0.00 Cancerology 11.37 11.36 10.56 8.00 0.39 Technicality 1.21 1.08 1.15 1.00 0.51 Severity 13.54 10.22 12.56 8.30 0.27 Emergency 38.92 25.48 43.07 22.45 0.07 Beds occupancy rate 81.99 12.37 82.49 17.92 0.73
Note - This Table shows how hospitals in the sample compare to hospitals out of the sample. SD stands for standard deviation and column 3 reports two-sided p-value of a t-test comparing averages of variables for hospitals in the sample and other hospitals. Spending: total spending at average prices. ATC1: proportions of observations in the three major anatomical groups per hospital Cancerology: percentage of activity in cancerology. Technicality: indicator of number of patients coming from an university hospital. Severity: percentage of stays with high level of severity. Emergency: share of activity coming from the emergency department, proxy for low attractiveness
share of patients who are mainly (but not exclusively) treated in university hospitals. This is a measure of the complexity of the hospitals’ case-mix. For each homogeneous patient group, there are four levels of severity. The indicator “Severity” is the share of patients classified in the highest levels, three and four. Emergency measure the share of activity coming from the emergency department, which has an impact on the hospitals’ planning, and is a proxy for low attractiveness. Finally, I use beds occupancy rates in medicine, to proxy for the efficient use of resources.
Table 2: Treated and control hospitals
(1) (2) (3)
Treated Non-Treated Difference Mean SD Mean SD P-value Spending 1.3e+06 1.9e+06 1.4e+06 2.0e+06 0.63 ATC1 B 0.32 0.30 0.39 0.33 0.15 ATC1 J 0.10 0.10 0.14 0.15 0.05 ATC1 L 0.57 0.30 0.44 0.31 0.01 Cancerology 10.73 3.30 10.50 8.89 0.86 Technicality 1.02 0.43 1.18 1.10 0.34 Severity 13.31 5.58 12.32 8.89 0.47 Emergency 45.10 21.93 42.62 22.55 0.50 Beds occupancy rate 86.44 9.17 81.41 19.53 0.09
Note - This Table shows how hospitals in the treatment group compare to hospitals in the control group. SD stands for standard deviation and column 3 reports two-sided p-value of a t-test comparing averages of variables for hospitals entering a group and other hospitals. Spending: total spending at average prices. ATC1: proportions of observations in the three major anatomical groups per hospital Cancerology: percentage of activity in cancerology. Technicality: indicator of number of patients coming from an university hospital. Severity: percentage of stays with high level of severity. Emergency: share of activity coming from the emergency department, proxy for low attractiveness.
Table 3: Hospitals never in a group and always in a group
(1) (2) (3)
Never in a group Always in a group Difference Mean SD Mean SD P-value Spending 1.3e+06 2.1e+06 1.5e+06 1.9e+06 0.47 ATC1 B 0.41 0.34 0.39 0.32 0.55 ATC1 J 0.13 0.16 0.15 0.14 0.41 ATC1 L 0.43 0.32 0.45 0.30 0.60 Cancerology 12.14 13.26 9.36 3.04 0.05 Technicality 1.24 1.54 1.14 0.64 0.58 Severity 13.44 11.25 11.53 6.67 0.17 Emergency 41.71 26.01 43.28 19.83 0.66 Beds occupancy rate 83.83 28.01 79.68 9.61 0.18
Note - This Table shows how hospitals always in a group compare to hospitals never in a group. SD stands for standard deviation and column 3 reports two-sided p-value of a t-test comparing averages of variables for hospitals in the sample and other hospitals. Spending: total spending at average prices. ATC1: proportions of observations in the three major anatomical groups per hospital Cancerology: percentage of activity in cancerology. Technicality: indicator of number of patients coming from an university hospital. Severity: percentage of stays with high level of severity. Emergency: share of activity coming from the emergency department, proxy for low attractiveness.
D.3
Trends in prices in different hospitals
E
Results
Table 4: Impact of group purchasing on medicine prices
Variable All medicine Monopolies Oligopolies POLS -0.0046 0.0039** -0.041**
(0.0065) (0.0020) (0.019) FE -0.017** -0.000060 -0.075***
(0.0069) (0.0053) (0.017)
Row one presents the results from a pooled OLS regression, controlling for medicine - specific time trends. Row two presents the main results, using a regression with hospital medicine fixed effects, and medicine -year fixed effects. The outcome is log prices. Standard errors clustered at the hospital level in parenthesis. The numbers of observations in the POLS model are 44, 689 for all medicines, 6, 778 for monopoly medicines and 9, 130 for oligopoly medicines. The numbers of observations in the FE model are 39, 052 for all medicines, 6, 253 for monopoly medicines and 8, 014 for oligopoly medicines.
Figure 4: Prices variations in reference groups, all medicines
Note - This graph shows the variation of average prices and average reimbursement rates of all medicines.
Figure 5: Prices variations in reference groups, monopolies
Note - This graph shows the variation of average prices and average reimbursement rates of medicines that have no competitors. For medicines that have no competitors, hospitals pay prices that are close to the reimbursements rates.
Figure 6: Prices variations in reference groups, oligopolies
Note - This graph shows the variation of average prices and average reimbursement rates of oligopoly medicines. For medicines that have competitors, hospitals manage to get purchase prices that are below the reimbursements rates.
Figure 7: Prices in the treatment groups and the control group, all medicines
Note - This graph shows the variation of prices of all medicines in hospitals entering a group in 2010, 2011, 2014 - treatment group -, and in hospitals not entering - the control group, either hospitals always in a groups or hospitals never in a group. Before group creation, prices in hospitals in the treatment group follow the same trends as in the control group.
Figure 8: Prices in the treatment groups and the control group, monopolies
Note - This graph shows the variation of prices of monopoly medicines in hospitals entering a group in 2010, 2011, 2014 - treatment group -, and in hospitals not entering - the control group, either hospitals always in a groups or hospitals never in a group. Before group creation, prices in hospitals in the treatment group follow the same trends as in the control group.
Figure 9: Prices in the treatment groups and the control group, oligopolies
Note - This graph shows the variation of prices of oligopoly medicines in hospitals entering a group in 2010, 2011, 2014 - treatment group -, and in hospitals not entering - the control group, either hospitals always in a groups or hospitals never in a group. Before group creation, prices in hospitals in the treatment group follow the same trends as in the control group.
Table 5: Trends in log prices before and after entry
Variable All medicines Monopolies Oligopolies 5 years before entry (k-5) 0.0084 0.0020 -0.015
(0.016) (0.0064) (0.072) 4 years before (k-4) -0.0086 -0.015 -0.011 (0.015) (0.011) (0.044) 3 years before (k-3) 0.010 -0.0056 -0.0058 (0.013) (0.0072) (0.037) 2 years before (k-2) 0.011 0.0023 0.014 (0.014) (0.013) (0.034) Year of entry (k) -0.0059 0.0010 -0.048** (0.011) (0.0052) (0.020) 1 years after (k+1) -0.022** -0.0071 -0.082*** (0.0098) (0.0083) (0.024) 2 years after (k+2) -0.038*** -0.0035 -0.13*** (0.0092) (0.0065) (0.029) 3 years after (k+3) -0.031*** 0.00055 -0.13*** (0.0086) (0.0078) (0.033) 4 years after (k+4) -0.024*** -0.0073 -0.099*** (0.0087) (0.0087) (0.026)
Note - This Table shows how all medicine prices vary depending on the number of years before or after group creation, using hospital - medicine fixed effects and medicine - year fixed effects. The reference year is the year before entering a purchasing group. The outcome is log prices. Standard errors clustered at the hospital level in parenthesis. In this table, we can see that within a hospital-medicine pair, log prices before treatment do not significantly differ from log prices one year before treatment, for all medicines, for oligopoly medicines and for monopoly medicines. On the opposite, log prices are significantly different from log prices one year before treatment for all medicines and oligopoly medicines one to four years after treatment. The numbers of observations are 39, 052 for all medicines, 6, 253 for monopoly medicines and 8, 014 for oligopoly medicines.
Table 6: Robustness checks: using various control groups
(1) (2) (3)
Group effect Baseline Never in a group Always in a group All medicines -0.017** -0.021** -0.013* (0.0069) (0.0089) (0.0073) Monopoly -0.000060 -0.00023 0.00092 (0.0054) (0.0056) (0.0059) Oligopoly -0.075*** -0.087*** -0.068*** (0.017) (0.024) (0.016)
Column (1) is the baseline. Column (2) uses an alternative control group: hospitals never in a group. Column (3) uses an another alternative control group: hospitals always in a group. The outcome is log prices. Standard errors clustered at the hospital level in parenthesis
Significance levels : ∗ : 10% ∗∗ : 5% ∗ ∗ ∗ : 1%
Table 7: Robustness checks: changing the pool of purchasing groups
Variable (1) (2) (3) (4) All medicines -0.0089 -0.014* -0.023*** -0.019** (0.0069) (0.0073) (0.0065) (0.0090) Monopoly -0.0028 0.0024 0.00093 -0.0031 (0.0075) (0.0056) (0.0059) (0.0050) Oligopoly -0.045*** -0.078*** -0.079*** -0.098*** (0.016) (0.019) (0.019) (0.021)
Columns (1) to (4) show how the results vary when we withdraw one of the four a purchasing groups contributing to our estimation. The outcome is log prices. Standard errors clustered at the hospital level in parenthesis Significance levels : ∗ : 10% ∗∗ : 5% ∗ ∗ ∗ : 1%
Table 8: Robustness checks: impact of group purchasing on medicines prices
(1) (2) (3) (4) (5) (6)
Variable FE EV Balanced No entry year Medicines Hospitals All medicines -0.0034 -0.024*** -0.018*** -0.036*** -0.017** -0.015** (0.0099) (0.0045) (0.0053) (0.0067) (0.0069) (0.0064) Monopoly -0.017 0.00024 -0.0020 -0.0069 0.0012 0.0017 (0.013) (0.0055) (0.0044) (0.0075) (0.0051) (0.0051) Oligopoly -0.072*** -0.082*** -0.060** -0.13*** -0.076*** -0.069*** (0.016) (0.017) (0.027) (0.027) (0.017) (0.016)
Column (1) uses hospital, medicine fixed effects, instead of hospital - medicine fixed effects. Column (2) withdraw 5% extreme values (EV) for quantities (compared to median quantities and hospital size) and 5% extreme values for prices (compared to median prices), column (3) keeps only hospital - medicine pairs that are in the database for the whole period. Column (4) does not use the year of the first group purchases. Column (5) uses an alternative definition of oligopoly and monopoly medicines. Column (6) adds hospital that enter a group another year than the entry year to the treatment group. The outcome is log prices. Standard errors clustered at the hospital level in parenthesis