HAL Id: hal-00691985
https://hal-upec-upem.archives-ouvertes.fr/hal-00691985v2
Submitted on 30 Apr 2012
HAL is a multi-disciplinary open access
archive for the deposit and dissemination of
sci-entific research documents, whether they are
pub-lished or not. The documents may come from
teaching and research institutions in France or
abroad, or from public or private research centers.
L’archive ouverte pluridisciplinaire HAL, est
destinée au dépôt et à la diffusion de documents
scientifiques de niveau recherche, publiés ou non,
émanant des établissements d’enseignement et de
recherche français ou étrangers, des laboratoires
publics ou privés.
YARTISS: A Tool to Visualize, Test, Compare and
Evaluate Real-Time Scheduling Algorithms
Younès Chandarli, Frédéric Fauberteau, Damien Masson, Serge Midonnet,
Manar Qamhieh
To cite this version:
Younès Chandarli, Frédéric Fauberteau, Damien Masson, Serge Midonnet, Manar Qamhieh.
YARTISS: A Tool to Visualize, Test, Compare and Evaluate Real-Time Scheduling Algorithms.
WA-TERS 2012, Jul 2012, Italy. pp.21–26. �hal-00691985v2�
CONTENTS
I Introduction 2
II Motivations: A Brief History of YARTISS 2
III Related Works 3
IV Functionalities 3
IV-A Single Task Set Simulation . . . 3
IV-A1 Task Models . . . 3
IV-A2 Uniprocessor / Multiprocessor . . . 3
IV-A3 Energy Profile . . . 4
IV-A4 Scheduling Policy . . . 4
IV-B Run Large Scale Simulations . . . 4
IV-C Task Sets Generation . . . 4
IV-D Graphical User Interface . . . 5
V Architecture 5 V-A Engine Module . . . 5
V-B Service Module . . . 5
V-C Framework Module . . . 5
V-D View Module . . . 6
VI Case Studies 6 VI-A Adding a Scheduling Policy . . . 6
VI-B Adding an Energy Profile . . . 6
VI-C Adding a Traffic Model . . . 6
VI-D Using an External Module to Generate Tasks . . . 7
VI-E Adding More Metrics . . . 7
VII Distribution 7
VIII Future Works 7
IX Conclusion 7
YARTISS: A Tool to Visualize, Test, Compare and
Evaluate Real-Time Scheduling Algorithms
Younès Chandarli
∗†, Frédéric Fauberteau
‡, Damien Masson
∗, Serge Midonnet
†and Manar Qamhieh
†Université Paris-Est, LIGM UMR CNRS 8049,
∗ESIEE Paris, 2 bld Blaise Pascal, BP 99, 93162 Noisy-le-Grand CEDEX, France
†Université Paris-Est Marne-la-vallée, 5 bld Descartes, Champs sur Marne, 77454 Marne-la-Vallée Cedex 2, France ‡CEA List, LaSTRE, Point Courrier 94, Gif-sur-Yvette, F-91191 France
Abstract—In this paper, we present a free software written in Java, YARTISS, which is a real-time multiprocessor scheduling simulator. It is aimed at comparing user-customized algorithms with ones from the literature on real-time scheduling. This simulator is designed as an easy-to-use modular tool in which new modules can be added without the need to decompress, edit nor recompile existing parts. It can simulate the execution of a large number of concurrent periodic independent task sets on multiprocessor systems and generate clear visual results of the scheduling process (both schedules and tunable metrics presentations). Other task models are already implemented in the simulator, like graph tasks with precedence constraints and it is easily extensible to other task models. Moreover, YARTISS can simulate task sets in which energy consumption is a scheduling parameter in the same manner as Worst Case Execution Time (WCET).
I. INTRODUCTION
In order to evaluate the efficiency of a new approach in real-time systems, software simulation against other algorithms are commonly used. Due to the lack of a standard simulation tool approved by the real-time community, most of the researchers tend to create their own. This situation raises some concerns. On one hand, the presented results are hard to be validated without careful examination of the simulation tool. So these results might be biased toward the proposed approach either by adapted generation of testing tasks or by biased imple-mentation against the compared algorithms. On another hand, reasons as out-of-date simulation tools or lack of good doc-umentation can incite researchers to create new tools, which will lead to repetitive algorithms’ implementations specially the common ones (e.g. RM, DM, EDF) while consuming the time and effort of researchers. Moreover, if a standard platform succeeds to emerge, one can compare his own policy with a very complicated one without having to understand the very specificity and optimizations of this one. Finally, the simulation protocols could be standardized, and more easily describable by the use of such a reference tool.
In this paper, we introduce YARTISS, a new simulation tool for real-time systems. Genericity is its main feature, by which we hope to overcome the problems mentioned before. New users are allowed to add their own implemented algorithms easily, with no need to understand how the simulator is built or works. We do not pretend to propose a perfect simulator, however we tried during its development to learn from our past
tries [1], [2]. YARTISS is written in the Java programming language, which is very popular nowadays and offers valuable attributes regarding portability. In order to ensure indepen-dence between the different features of the simulator and to reduce the possibilities of massive failures among them, we used modern programming paradigms, like module oriented programming and Java unit tests (JUnit) oriented development. We tried to develop YARTISS keeping in mind that in order for a simulator to became a reference tool, it should have the following properties: 1) the software must be available under an open source license which gives any researcher the freedom to analyze, verify or modify its implementation ; 2) the Application Programming Interface (API) of the software must be well documented and the developer who wants to add or modify an algorithm should not have to read the entire source code in order to understand its behavior ; 3) each part of the simulator (its core, the tasks generator, the results analyzer, ...) must be independent from each other, and easily replaceable by an external module ; and 4) the simulator has to be easy to use in a way that a non-developer researcher can be able to use it. Due to its generality and modularity, we hope that YARTISS makes a valuable contribution to the long process of developing a standard simulation tool recognized by the real-time scheduling research community.
We expose our motivations in Section II. We review related works in Section III. Section IV presents the simulator func-tionalities. The program architecture is described in Section V. Case studies which demonstrate the extensibility of the tool are presented in Section VI. How to get the tool is explained in Section VII. Future works are discussed in Section VIII and finally we conclude in Section IX.
II. MOTIVATIONS: A BRIEFHISTORY OFYARTISS Our first try in writing a real-time system simulator was called RTSS [1] and developed between 2005 and 2008. The tool was first developed to test some algorithms to handle temporal fault tolerance and was later extended in order to test aperiodic tasks handling algorithms [3], [4]. Lots of mod-ifications had been made in a hurry with some assumptions on the behavior of existing classes without documentation. Then modifying anything could result in errors in another completely different parts. Moreover, although the tool was initially programmed in Java, it began to rely more and more
on bash scripts to be launched and to transform output into human readable files. Based on this first tool, a second one, RTMSim [2], was developed between 2008 and 2011 in the purpose to simulate multiprocessor platforms [5]. The general key ideas were kept, but the first tool had become such complicated and unmaintainable that we had to start it over. Of course, all validated parts of RTSS which were of no interest at the time, were not reimplemented and so were lost (e.g. an implementation of DOV ER [6]). A third try was made
in early 2011, RTSS v2 [1], which was basically a rebuild of RTSS including energy consuming tasks and used for [7]. Unfortunately, even if it is more usable today than the first RTSS, it suffered from the same problems of documentation, modularity and usability to simulate and exploit results of large scale simulations. Moreover, it seems difficult to extend it to simulate multiprocessor platforms.
So we came to the development of a new software: YARTISS. From the start, we aimed to produce a tool where the task model, the number of processors and behavior such as the energy consumption model are as easy as possible to modify. Another point on which we focused our attention is the usability of the user interface to produce human readable traces. Our goal was to develop a simulator able to produce evaluations as well as to debug our energy-related algorithms. When we wanted to use YARTISS for an another purpose, namely the simulation of directed graph model of real-time tasks which is a model of tasks with precedence constraints and concurrency (see [8]), this was done without any problems, validating its extensibility.
III. RELATEDWORKS
It exists a lot of tools to simulate or visualize instrumented real-time systems execution traces. Due to space limitation, we cannot provide here an extensible list of existing tools. For the instrumented execution analyzer tools, one can refer to [9], [10]. Among open simulation tools, we can cite MAST [11], Cheddar [12], STORM [13] and FORTAS [14]. MAST permits to model distributed real-time systems and offer tools to e.g. test their feasibility or perform sensitivity analysis. Cheddar is written in Ada, handles the multiprocessor case and provides many implementations of scheduling, partitioning and analysis algorithms. It also comes with a user-friendly Graphical User Interface (GUI). Unfortunately, no API doc-umentation is available to help with the implementation of new algorithms. Moreover, the choice of the Ada language reduces the potential additional developers number. Finally, FORTAS and STORM are tools which, as YARTISS, are written in Java, had modular architectures and permits to simulate task sets on multiprocessor architectures. They both represent very valuable contributions in the effort to provide open and modular tools and they are good candidates in our opinion to be widely used. Unfortunately, even if it is in its current state more usable than our previous tools, FORTAS seems to suffer from the same issues: its development is not open to other developers for now, we can only download .class files, no documentation is yet provided and it seems that no
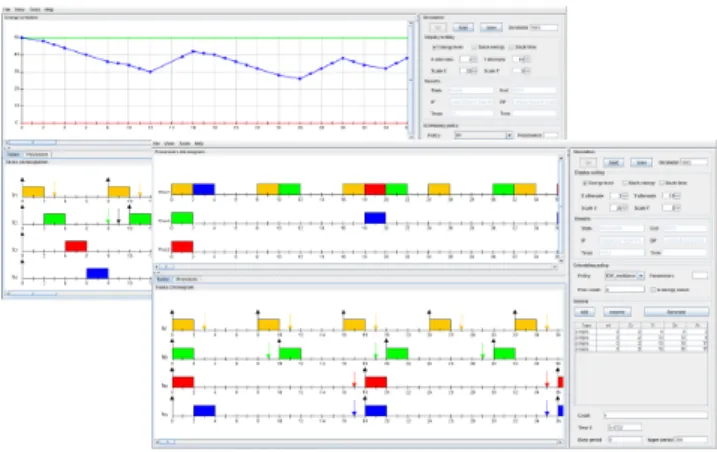
Figure 1. Energy and Multiprocessor Simulation views
new version has been released to public since its presentation last year in WATERS.
IV. FUNCTIONALITIES
The two main features of our simulator are the simulation of the execution of one task set scheduled by a specific scheduling policy and the large-scale comparison of several scheduling policies in different scenarios, which implies its third feature: the random task sets generation.
A. Single Task Set Simulation
Through the GUI, we can load a task set either from a file, by random generation or entering its parameters manually. We can parametrize the desired simulation and run it by the click of a button. Several views are then proposed. The simulation parameters are the task set, the number of processors, the scheduling algorithm and the energy profile.
1) Task Models: YARTISS offers an open architecture that greatly facilitates the integration of different task models. The current version proposes two models, the first one is the Liu and Layland task model augmented with energy related parameters. All the tasks are independents and one task is characterised by its WCET Ci, its worst case energy
consumption Ei, its period Tiand its deadline Di. The second
one is the Graph task model which is a common real-time task model on multiprocessor systems. It is used to implement systems consisting of number of missions in which there exist dependencies controlling their execution flow. In this model, a graph Gi is a collection of real-time tasks {τi,1, τi,2, τi,q},
sharing the same deadline Di and period Pi of the graph,
and they differ in their WCET Ci,j. The directed edges
between the tasks of the graph determine their precedence constraints, and since each task in the graph might have more than one successor and predecessor, concurrent execution can be generated. We will see in Section VI-C that it is easy to propose other task models.
2) Uniprocessor / Multiprocessor: Using the simulator, one can implement and test his own multiprocessor algorithms and partitioning policies. Some multiprocessor scheduling
algorithms were implemented to test this feature like EDF and FP.
3) Energy Profile: Unlike many other simulators, this one permits to model the production and the consumption of energy in the system. It permits the user to model an energy harvester like a battery or a capacitor with limited or unlimited capacity. It can also model a renewable energy source by a charging function. The user can implement and use his own energy profiles. Figure 1 shows the GUI. Note that the view used to print the energy level can easily be augmented to print other metrics, such as system slack times for example.
a) Energy Source Model: We have implemented an en-ergy source profile that models a renewable enen-ergy source represented by a battery with limited capacity and a linear charging function. This model is not the only possible one, the user can add his own profile by implementing the interface and injecting it into the engine of the simulator in few lines of code and without the need to open packages. An example is given in Section VI-B.
b) Consumption Model: It is important to note that for some works, energy consumption of a task must be modeled independently from its WCET [15]. This is why our simulator provides the ability to specify a consumption profile for each task of the system or choose one global profile applied to all tasks. A consumption model is represented by a function and must be able to provide the amount of energy consumed between two dates during the tasks execution i.e. the integral of the consumption function. Implemented models so far are: Linear consumption(not realistic but permits to establish some interesting preliminary conclusions) and Early instantaneous consumption where all the energy cost of a task is consumed as soon as a task is scheduled. This later model is assumed to represent the worst case scenario. As the energy source profile, a new consumption model can be added without having to open the simulator packages. An example is given in Section VI-B.
4) Scheduling Policy: The main purpose of the simulator is to test scheduling algorithms, compare them and show their performances and efficiency. Much attention has been focused on the design of this part of the simulator to make it as generic as possible so that users can add, override and inject new scheduling policies easily. There are currently twenty algorithms implemented including classic algorithms (RM, DM, EDF uni- and multiprocessor), heuristics for the energy constrained scheduling problem and policies for precedence graph model based on Least-Laxity-First (LLF). As with other parameters of the simulator run-time environment, the user can add and link his own algorithms in some lines of code without open core packages. An example is given in Section VI-A. B. Run Large Scale Simulations
A major utility of the simulator is the large scale comparison of several algorithms or scheduling policies. It is done in the same way of a simple single simulation but on a large set of systems on different scenarios. The comparison is based on statistics that currently can be the number of failure or
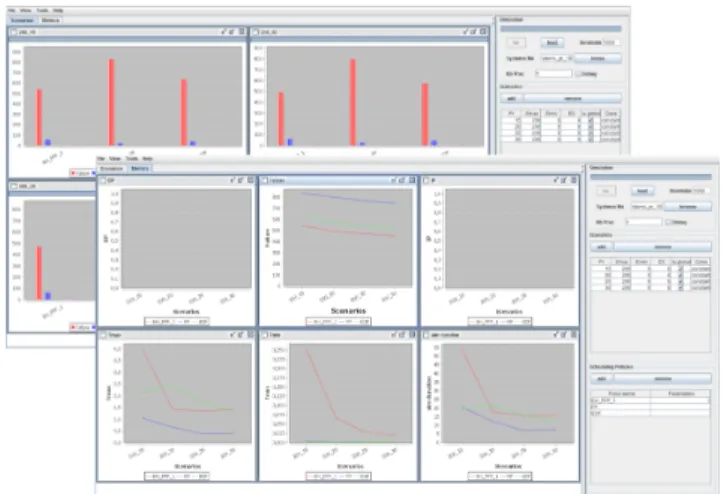
Figure 2. Concurrent large scale simulations: histogram and curves views
missed deadlines, the system lifetime, the amount of time spent at maximum energy level Emax and minimum level Emin
and the average duration of idle period and busy periods. One can add his own metrics as demonstrated in Section VI-E. Multiple simulations are run concurrently by using the java multi-threading concept and so the duration of simulations is hardly reduced, taking advantage of hardware parallelism. We show in Figure 2 examples of charts which can be displayed with YARTISS.
C. Task Sets Generation
Performing large-scale tests requires a large set of task systems. To be credible, we have to use sufficiently varied systems to cover the possible task systems space. The simu-lator provides the ability to choose a generator according to desired scenarios and algorithms. The current version includes a generator inspired by the UUniFast-Discard algorithm [16] adapted to energy constraints. This algorithm generates task sets that respect the CPU utilization (U = PCi
Ti) and the
energy utilization (Ue = PTEi
i×P r) imposed by the user.
The basic version was not energy aware. We had to adapt it to produce time feasible and energy feasible systems. The principle is to distribute the load imposed on the tasks which compose the system. When we add energy cost to the task and an energy load to the system we end up with two parameters to vary and two conditions to satisfy. The algorithm in its current version distribute U and Uein the same way on the tasks then
tries to find the pair (Ci, Ei) which satisfies all the conditions
namely Ui, Ueand P r < ECii − P r < Emax. The operation is
repeated a few times and keeps the pair that approaches most the imposed conditions, finally, the algorithm returns a time and potentially1 energy feasible system. The user can use the described generator as he can write and use his own.
1Until now there is no feasibility test that takes into account energy
constraints, we hope to have the possibility to present some key ideas to RTSOPS, conjointly organized with ECRTS and WATERS
Figure 3. Modules connexion UML Diagram
D. Graphical User Interface
To facilitate the use of the simulator by a large number of users, we provide our application with a GUI to make the features mentioned above available in an interactive and intuitive way. After the simulation of a single system with an energy profile and a scheduling policy, the user can follow and analyze the schedule on three different views: a time chart, a processor view and the energy curve which shows the evolution of energy (as mentioned before, other data can be monitored and print on this view).
In order to run simulations and get the results of a com-parison of scheduling policies, the application offers a view that allows the user to select the scheduling policies to be compared, the energy scenarios and to run simulations. Thus the user can see the results as graph per scenario or per comparison criterion. This view offers also a debugging tool in which the user can analyze the result of comparison system by system and can optionally display the time chart of each system and in each scheduling policy. This can help to detect behaviors that differ in one algorithm to another. Then this simulator can produce results on a large scale of randomly generated task systems in order to evaluate a scheduling policy, but also easily explore properties of a new algorithm, find counter examples on hypothesis we can make by easily isolating degenerate cases. For example, in the case of energy scheduling, no optimal algorithm exists yet. In order to test empirically if a new algorithm is, an approach consists in running it on a large number of task systems, and ask the simulator to present only the systems where this algorithm fails whereas other heuristics succeed.
V. ARCHITECTURE
To meet the requirements specified in Section II, we have ensured that the design is as generic and open as possible by applying the appropriate design patterns and modular pro-gramming practices. We cut the project in four main modules: the engine or core module, the service module responsible for handling input/output with the engine, a module for GUI and finally a framework module that contains general tools necessary for the application. This module separation follows the classical Model-View-Controller design pattern (see Figure 3) which permits to isolate the core application part from its presentation and thus permits the engine to be generic and easily integrable in other tools.
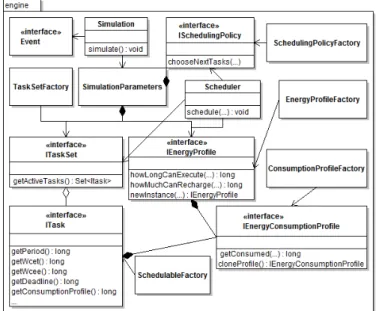
Figure 4. The engine module UML diagram
A. Engine Module
The Simulation class, responsible of running a simulation, takes as parameters a container which embeds a scheduling policy, an energy profile and a set of tasks. An UML diagram of this module is given in Figure 4. The simulator is event-triggered: on receipt of an event the scheduler is called to update the running tasks. It then calls the scheduling policy to choose the tasks to execute and the associated processors. This module so defines interfaces needed to execute (i.e. the scheduling policy) the energy source model and task energy consumption model. The interface implementation is not directly linked to the simulation object. In order to build an energy profile, for example, one have to register an instance of this class in a factory. This factory is responsible to create new instances when needed and completely hides the imple-mentation. This allows anybody to create his own scheduling policy or his own task consumption model in a transparent way: one only has to write the model code and register an instance of his class by calling a method of the factory in order to make the new class available through the GUI. Case study are given in Section VI in order to demonstrate this assertion.
B. Service Module
This module makes the interface between the simulator core and the user interfaces. It serves the necessary data to the GUI and gets back the user modifications from it. It also enables to prepare the simulation parameters, or to set up a large scale test. This module component has been made in such a way it permits to reuse the same classes for an other interface. (e.g. a textual user interface).
C. Framework Module
This is a toolbox module that contains generic classes and functions in order to facilitate the code writing. This module
1 p u b l i c c l a s s MainDemoSP { p u b l i c s t a t i c v o i d main ( S t r i n g [ ] a r g s ) { 3 S c h e d u l i n g P o l i c y F a c t o r y . r e g i s t e r P o l i c y ( new LLF ( ) ) ; D e s k t o p M a i n main = new D e s k t o p M a i n ( ) ; 5 main . s e t V i s i b l e ( t r u e ) ; } 7 } 9 c l a s s LLF e x t e n d s A b s t r a c t M u l t i P r o c S c h e d u l i n g P o l i c y { @ O v e r r i d e p u b l i c S t r i n g g e t P o l i c y N a m e ( ) { 11 r e t u r n " LLF " ; } 13 @ O v e r r i d e p u b l i c I T a s k S e t c r e a t e T a s k S e t ( ) { r e t u r n new A b s t r a c t T a s k S e t ( new C o m p a r a t o r < I T a s k > ( ) { 15 @ O v e r r i d e p u b l i c i n t c o m p a r e ( I T a s k t 1 , I T a s k t 2 ) { l o n g l a x i t y 1 = t 1 . g e t D e a d l i n e ( ) − t 1 . g e t R e m a i n i n g C o s t ( ) ; 17 l o n g l a x i t y 2 = t 2 . g e t D e a d l i n e ( ) − t 2 . g e t R e m a i n i n g C o s t ( ) ; i n t cmp = ( i n t ) ( l a x i t y 1 − l a x i t y 2 ) ; 19 i f ( cmp ==0) r e t u r n ( i n t ) ( t 1 . g e t P r i o r i t y ( ) − t 2 . g e t P r i o r i t y ( ) ) ; 21 r e t u r n cmp ; } 23 } ) { @ O v e r r i d e p u b l i c S o r t e d S e t < I T a s k > g e t A c t i v e T a s k s ( l o n g d a t e ) { 25 S o r t e d S e t < I T a s k > a c t i v e T a s k s = new T r e e S e t < I T a s k > ( c o m p a r a t o r ) ; f o r ( I T a s k t : t h i s ) 27 i f ( t . i s A c t i v e ( ) ) a c t i v e T a s k s . add ( t ) ; 29 r e t u r n a c t i v e T a s k s ; } 31 } ; } 33 @ O v e r r i d e p u b l i c P r o c e s s o r [ ] c h o o s e N e x t T a s k s ( 35 P r o c e s s o r [ ] p r o c e s s o r s , I T a s k S e t t a s k S e t , I E n e r g y P r o f i l e e n e r g y P r o f i l e , l o n g d a t e , 37 E v e n t G e n e r a t o r evGen ) { i n t i = 0 ; 39 f o r ( I T a s k t a s k : t a s k S e t . g e t A c t i v e T a s k s ( d a t e ) ) { i f ( i < p r o c e s s o r s . l e n g t h ) { 41 l o n g h l c e t = e n e r g y P r o f i l e . howLongCanExecute ( t a s k ) ; i f ( h l c e t <= 0 ) { 43 evGen . g e n e r a t e E v e n t ( " e n e r g y _ f a i l u r e " , t a s k , d a t e , n u l l ) ; p r o c e s s o r s [ i ] . s e t N e x t T a s k ( n u l l ) ; 45 } e l s e { 47 evGen . g e n e r a t e E v e n t ( " c h e c k _ e n e r g y _ s t a t e " , t a s k , d a t e + 1 , n u l l ) ; p r o c e s s o r s [ i ] . s e t N e x t T a s k ( t a s k ) ; 49 } } 51 i + + ; } 53 f o r ( ; i < p r o c e s s o r s . l e n g t h ; i + + ) { p r o c e s s o r s [ i ] . s e t N e x t T a s k ( n u l l ) ; 55 } r e t u r n p r o c e s s o r s ; 57 } 59 @ O v e r r i d e p u b l i c I S c h e d u l i n g P o l i c y n e w I n s t a n c e ( ) { r e t u r n new LLF ( ) ; 61 } }
Listing 1. How to add a scheduling policy
makes good use the Java concurrency API and capacities of modern multiprocessor to accelerate the execution of several simulations. It follows the producer consumer design pattern in order to permit e.g. to run several simulations in the same time, sending the result of each one to the consumer which computes statistics and updates the GUI. This is also used for the task set generation. Several producers can run in concurrency, sending the produced tasks to consumers which write them in files. This speeds up the generation and simulation of large scale tests.
D. View Module
This module contains the necessary classes for the GUI. VI. CASESTUDIES
We demonstrate in this section that it is easy to tune the simulator to address specific needs.
A. Adding a Scheduling Policy
To add a new scheduling policy, e.g. LLF, one first needs to add the simulator’s .jar files to a new project in his favorite
1 p u b l i c c l a s s MainDemo { p u b l i c s t a t i c v o i d main ( S t r i n g [ ] a r g s ) { 3 S c h e d u l i n g P o l i c y F a c t o r y . r e g i s t e r P o l i c y ( new LLF ( ) ) ; C o n s u m p t i o n P r o f i l e F a c t o r y . r e g i s t e r C o n s u m p t i o n P r o f i l e ( new L o g C o n s u m p t i o n ( ) ) ; 5 D e s k t o p M a i n main = new D e s k t o p M a i n ( ) ; main . s e t V i s i b l e ( t r u e ) ; 7 } } 9 c l a s s L o g C o n s u m p t i o n i m p l e m e n t s I E n e r g y C o n s u m p t i o n P r o f i l e { 11 @ O v e r r i d e p u b l i c S t r i n g getName ( ) { r e t u r n " l o g " ; } @ O v e r r i d e p u b l i c L i s t < Double > g e t P a r a m e t e r s ( ) { r e t u r n n u l l ; } 13 @ O v e r r i d e p u b l i c v o i d s e t P a r a m e t e r s ( L i s t < Double > p a r a m s ) {} 15 @ O v e r r i d e p u b l i c l o n g g e t C o n s u m e d ( l o n g wcet , l o n g wcee , l o n g r o m a i n i n g T i m e C o s t , l o n g d u r a t i o n ) { 17 d o u b l e a = w c e t − r o m a i n i n g T i m e C o s t ; d o u b l e b = a + d u r a t i o n ; 19 i f ( b > w c e t ) b = w c e t ; i f ( ( b−a ) <= 0 ) r e t u r n 0 ; 21 l o n g r e s u l t = ( l o n g ) Math . l o g ( b / a ) ; i f ( r e s u l t > wcee ) r e s u l t = wcee ; 23 r e t u r n r e s u l t ; } 25 @ O v e r r i d e p u b l i c I E n e r g y C o n s u m p t i o n P r o f i l e c l o n e P r o f i l e ( ) { 27 r e t u r n new L o g C o n s u m p t i o n ( ) ; } 29 }
Listing 2. How to add a new energy profile
IDE and then to provide an implementation of the interface ISchedulingPolicy. The policies are named to identify them among all others. The method getPolicyName() must so return the policy’s name. To permit the scheduling policy factory to instantiate the new class, one must implement the method newInstance() that returns a new instance of his policy class. Then he specifies the task set model by implementing the method createTaskSet(), giving him the choice to use the available task models or to create a new one according to how tasks must be sorted. ITaskSet is an iterable of ITasks that sorts tasks and returns a sorted set of activated tasks at time t. For LLF, tasks must be sorted by their laxity. To decide which tasks to execute and on which processor the method chooseNextTasks() must be implemented. Listing 1 shows the code needed to use LLF as an external module with the simulator.
B. Adding an Energy Profile
The same methodology can be applied to add a new energy consumption profile. Listing 2 shows the code needed to use a logarithmic consumption profile, still as an external module. C. Adding a Traffic Model
To add a new task model, one has to implement the interface ITaskand register the class into the Schedulable factory. The current version of the interface describes a standard Liu and Layland task. It can be used in its current state to model another kind of tasks like we do with graph tasks and tasks with precedences without open the packages. If it is not sufficient, one can extend it to make it more suitable to his needs. For example, to implement uncertain task model where the tasks execution times are specified into an interval, one can implement the interface ITask and modify the behavior of some methods to permit the exceeding of WCET by manipulating the remainingCost() method and the conditions of jobs end. Due to space limitation, we cannot give the code here, but it will be added to the demonstration package code suite (see Section VII).
D. Using an External Module to Generate Tasks
One of the advantages of the simulator is that it works with files of standard format like XML. It lets us use external tools if needed to generate tasks by converting the output file with XSL transformation to get an input file understandable by our simulator.
E. Adding More Metrics
If one wants to count the number of preemptions, for example, he has to modify the class Simulator to check each of tasks begin and end events to detect preemptions and increment a counter in the statistics container. Then, to show the new metric on GUI he must modify the class Metric to add the new one and the necessary algorithms to compute maximum, minimum and average. Clearly, this is not a good design. This point is discussed in Section VIII.
VII. DISTRIBUTION
The project is available from the GForge collaborative development environment hosted at https://svnigm.univ-mlv. fr/projects/yartiss/. This environment provides a subversion server allowing anonymous checkouts, documentation hosting, RSS feeds subscriptions, and public forums. A web page dedi-cated to YARTISS is also available at http://yartiss.univ-mlv.fr. In addition to a general presentation of the tool, it proposes a demo applet version which allows interested readers to try YARTISS directly from their web browser and an application form to allow anybody to share external modules.
VIII. FUTUREWORKS
The actual release offers many important and expandable features but the simulator is still under development. Some parts of the project have been made in a hurry which has prevented them to be as clean as they could. For example, the implementation of comparison metrics is strangely coupled with simulation classes and if we want to add a new metric we will be forced to open the engine module and modify internal classes as described in Section VI-E. This may be dangerous and not acceptable architecturally. Improvements are planned to address such weaknesses, like we have done with energy profiles and scheduling policies. Some other future works are planned: 1) We want to provide a command line user interface to allow the use of our simulator without the graphic environment to permits its use inside automated scripts and/or through a distant machine. This should be done easily because of the adopted architecture and responsibilities separation. 2) If we use XML format mostly in all inputs and outputs in order to be able to reuse other external tool functionalities, this feature must be generalized to the simulation results in order to permit their visualization with an external tool (e.g. GRASP[10]). 3) An additional work is needed on the description of processors and we need to add the ability to execute on heterogeneous and independent processors in terms of computational power, memory and energy consumption. This could also lead to in-tegrate research on distributed systems. 4) Finally, concerning the energy part, we must integrate the Dynamic Voltage and
Frequency Scaling (DVFS) model in order to be compliant with most recent works in this area.
IX. CONCLUSION
In this paper we presented YARTISS, a real-time multi-processor scheduling simulator. A consequent effort has been made to make it as extensible as possible. To justify the need for an open and generic tool, we presented the history of YARTISS development. Then we briefly presented existing simulation tools. We have described the three main function-alities of YARTISS: 1) simulate a task set on one or several processors with monitoring the system energy consumption, 2) concurrently simulate a large number of task sets and present the results in a user friendly way that permits to isolate interesting cases, and 3) randomly generate a large number of task sets. Then, in order to demonstrate the modularity and extensibility of our tool, we presented its architecture and five case studies that show how to add functionalities, in most cases without having to open the project archive. Finally we gave the instructions to test YARTISS and presented some improvement features we will implement.
We hope that this software can become a first step toward a widely adopted simulation tool through the real-time schedul-ing community.
REFERENCES
[1] D. Masson, “RTSS v1 and v2,” https://svnigm.univ-mlv.fr/projects/ rtsimulator/.
[2] F. Fauberteau, “RTMSIM,” http://rtmsim.triaxx.org/.
[3] D. Masson and S. Midonnet, “Userland Approximate Slack Stealer with Low Time Complexity,” in Proc. of RTNS, 2008, pp. 29–38.
[4] ——, “Handling non-periodic events in real-time java systems,” in Distributed, Embedded and Real-time Java Systems, M. T. Higuera-Toledano and A. J. Wellings, Eds. Springer US, 2012, pp. 45–77. [5] F. Fauberteau, S. Midonnet, and L. George, “Laxity-Based
Restricted-Migration Scheduling,” in Proc. of the 16th IEEE ETFA. IEEE Computer Society, 2011, pp. 1–8.
[6] G. Koren and D. Shasha, “Dover: An Optimal On-Line Scheduling
Algorithm for Overloaded Uniprocessor Real-Time Systems,” SIAM J. Comput., vol. 24, no. 2, pp. 318–339, Apr. 1995.
[7] M. Chetto, D. Masson, and S. Midonnet, “Fixed priority Scheduling strategies for Ambient Energy-Harvesting embedded systems,” in Proc. of GreenCom, 2011, pp. 50–55.
[8] M. Qamhieh, S. Midonnet, and L. George, “A Parallelizing Algorithm for Real-Time Tasks of Directed Acyclic Graphs Model,” in Proc. of WiP RTAS, 2012.
[9] S. K. Kato, R. R. Rajkumar, and Y. Ishikawa, “A Loadable Real-Time Scheduler Suite for Multicore Platforms,” Tech. Rep., 2009.
[10] M. Holenderski, M. v. d. Heuvel, R. Bril, and J. Lukkien, “Grasp: Tracing, visualizing and measuring the behavior of real-time systems,” in Proc. of WATERS, 2010.
[11] M. G. Harbour, J. J. G. García, J. C. P. Gutiérrez, and J. M. D. Moyano, “MAST: Modeling and analysis suite for real time applications,” in Proc. of ECRTS, 2001.
[12] F. Singhoff, J. Legrand, L. Nana, and L. Marcé, “Cheddar: a Flexible Real Time Scheduling Framework,” in Proc. of SIGAda, 2004. [13] R. Urunuela, A.-M. Déplanche, and Y. Trinquet, “STORM: a Simulation
Tool for Real-time Multiprocessor Scheduling Evaluation,” GDR SOC SIP, p. 1, 2009.
[14] P. Courbin and L. George, “FORTAS: Framework fOr Real-Time Anal-ysis and Simulation,” in Proc. of WATERS, 2011, pp. 21–26.
[15] R. Jayaseelan, T. Mitra, and X. Li, “Estimating the Worst-Case Energy Consumption of Embedded Software,” in Proc. of RTAS, 2006, pp. 81– 90.
[16] E. Bini and G. C. Buttazzo, “Measuring the Performance of Schedula-bility Tests,” Real-Time Syst., vol. 30, no. 1-2, pp. 129–154, May 2005.