HAL Id: cea-01802412
https://hal-cea.archives-ouvertes.fr/cea-01802412
Submitted on 24 Mar 2020HAL is a multi-disciplinary open access archive for the deposit and dissemination of sci-entific research documents, whether they are pub-lished or not. The documents may come from teaching and research institutions in France or abroad, or from public or private research centers.
L’archive ouverte pluridisciplinaire HAL, est destinée au dépôt et à la diffusion de documents scientifiques de niveau recherche, publiés ou non, émanant des établissements d’enseignement et de recherche français ou étrangers, des laboratoires publics ou privés.
On scattering effects for volume sources in low-energy
photon spectrometry
Marie-Christine Lépy, Laurine Brondeau, Laurent Ferreux, Sylvie Pierre
To cite this version:
Marie-Christine Lépy, Laurine Brondeau, Laurent Ferreux, Sylvie Pierre. On scattering effects for volume sources in low-energy photon spectrometry. Applied Radiation and Isotopes, Elsevier, 2013, 81, pp.71 - 75. �10.1016/j.apradiso.2013.03.071�. �cea-01802412�
ON SCATTERING EFFECTS FOR VOLUME SOURCES IN LOW-ENERGY PHOTON SPECTROMETRY
Marie-Christine Lépy, Laurine Brondeau, Laurent Ferreux, Sylvie Pierre CEA, LIST, Laboratoire National Henri Becquerel, Gif-sur-Yvette, F-91191, France
ABSTRACT
In this study, different aspects of the Compton scattering inside volume sources are illustrated
using experimental approach and Monte Carlo simulation. For the low-energy range (below
100 keV) scattered events represents around 30 % of the whole spectrum. Influence of the
source-detector geometry is discussed. The scattering effects induce strong differences in
spectrum shape for different geometrical conditions. This should influence efficiency transfer
factors. A new approach is proposed, including the scattered events, to avoid complex peak
area determination.
Keywords: Compton scattering, low-energy, Monte Carlo simulation, PENELOPE,
efficiency calibration
Highlights:
Compton scattering is unavoidable effect in volume sources.
In the low-energy range, this induces registration of scattered photons close to the full-energy
peak.
The respective contributions of the source material and container are studied for different
geometrical conditions.
INTRODUCTION
Gamma-ray and X-ray spectrometry in the low-energy range (20-150 keV) suffers a number
of difficulties that increase uncertainties associated with quantitative results derived from this
region. The main point is the full-energy peak (FEP) efficiency calibration in this energy
range, where the curvature of the efficiency versus energy function changes, around its
maximum value. Nowadays, Monte Carlo simulation is currently used to calculate
efficiencies; however, the validity of the calculation must be carefully checked by comparing
the calculated efficiencies with experimental values. Moreover, photon spectra are strongly
distorted by scattering effects. Compton scattering occurs either in the source (matrix and
container for a volume source), in the source holder, in the detector itself or its shielding. The
resulting scattered « peak » is a combination of the relevant scattering angles, thus giving a
continuous wide bump close to the FEP: the lower the energy, the closer the scattered events.
Consequently, this effect prevents accurate determination of the FEP area that is used either
for the calibration or for quantitative measurements. In this study, qualitative information of
the scattering effect is derived from Monte Carlo simulation and illustrated with experimental
approach.
1. Experimental
This study concentrates on spectra recorded with a coaxial n-type high purity germanium
(HPGe) detector, linked to analogue electronics, described in (Ferreux et al., 2012). The
detector has an active volume of 100 cm3 and a beryllium window with a thickness of
500 µm. Three types of sources with an activity of about 40 kBq are used:
Point sources, constituted by a weighted drop of standard radioactive solution included between one Mylar® foil adhesive tape (top), these foils being maintained by a plastic ring;
Liquid volume sources in plastic cylindrical containers, with volumes 50 cm3 and 500 cm3;
Gaseous volume sources in a stainless steel 100 cm3 cylindrical container.
1.1 Efficiency calibration in the low-energy range
To get experimental efficiency calibration, one of the difficulties is the lack of reliable photon
emission references, since standard radionuclides emitting photons at energies below 100 keV
are scarce. The Laboratoire National Henri Becquerel (LNHB) develops and maintains the “Table des Radionucléides” (Bé et al., 2011) providing carefully evaluated radionuclide decay data with extensive information on the data origin. For the energy range of interest, these
include a few gamma emitters (57Co, 75Se, 109Cd, 133Ba, 210Pb, 241Am) with some questionable
photons emission intensities. In addition, KX-rays of these radionuclides and some others can
be used, but it must be noted that their emission intensities are derived from computation,
using K capture or conversion-electron probabilities and fluorescence yields. For this last
parameter, strong correlation exists in the database, inducing correlated X-ray emission
intensities values.
The efficiency calibration of the detector is obtained using standard solutions and is
accurately established for point and 50 cm3 liquid sources, at 10 cm from the detector
window, and for 500 cm3 liquid sources at 8.33 cm.
1.2 Scattering effect in the low-energy range
A previous study (Plagnard et al., 2008) was carried out to determine the contribution of
should be taken to reduce unwanted bumps, particularly by reducing the material immediately
around the radioactive deposit. Furthermore the use of a source collimator significantly
reduces the scattering effect in the resulting spectra. However, these favourable geometrical
conditions cannot always be attained, depending on the sample shape, source-to-detector
distance, etc. Particularly, in low-level measurements, volume samples are currently used,
thus scattering in the sample volume is unavoidable and must be considered. Figure 1
compares spectra obtained with 241Am in the 5 to 70 keV energy range, using a point source
(black) and a 50 cm3 volume source (red) at 10 cm from the detector window. On the left of
the 59.6 keV peak, clearly, for the point source, a scattering bump appears around 52.5 keV,
whereas for the volume source, the scattering effect gives a continuous distribution ranging
from 40 keV up to the full-energy peak (FEP) energy.
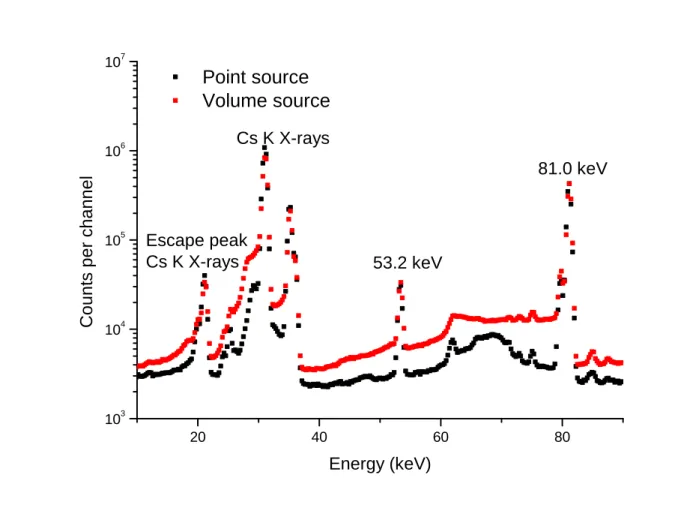
Spectra obtained with 133Ba in the same conditions are presented in Figure 2, in the 10 to
90 keV energy range where are both the caesium K X-rays and the 79-80 keV doublet of
133Ba. Here the features seen in 241Am spectra are also shown for both energy regions. The
scattered events induce a relatively distinct bump for the point source, centred at 28.8 and
around 68 keV for the 30 and 80 keV, respectively. For the volume source, they lead to a
continuous distribution, starting from around 27 and 60 keV up-to the FEP energy, thus
strongly disturbing the FEP background.
2. Monte Carlo simulations
To estimate the respective contributions of the source and container materials in the scattering
distributions, Monte Carlo simulations were performed, using the PENELOPE code (Salvat et
al., 2009). PENELOPE2008 performs simulation of coupled electron and photon transport in
implementation. The PENMAIN routine performs particle tracking in material systems
consisting of homogeneous regions (bodies) limited by quadric surfaces. One of the output
files provides the distribution of absorbed energy in selected bodies (energy deposition
spectrum). The code is written in FORTRAN and has been adapted to track any Compton
scattering event in elements surrounding the source before energy deposition in the
germanium crystal. The main sites of scattered events are then identified and the resulting
energy distributions are given for each material.
2.1 Volume and distance effects
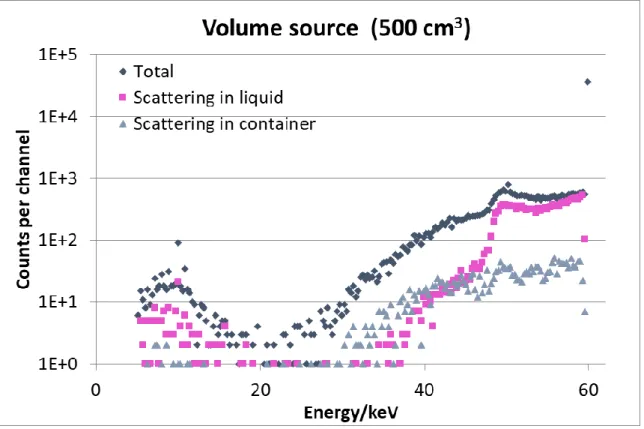
Figures 3-5 present the results of the Monte Carlo simulation for 60 keV photons, for three
geometries under study: point source, 50 and 500 cm3 volume (water) sources. In the last
ones, the events consecutive to scattering, either in the liquid or in the container, are plotted.
These simulated spectra can be compared with the americium-241 spectra (Figure 1). For 60
keV photons, the relative contribution of Compton scattering (total spectrum minus
full-energy peak) represents 11.3 % of whole spectrum for the point source, whereas it amounts to
32.5 % and 45.3 % for 50 and 500 cm3 volume sources, respectively. It can also be stated that,
for the point source, the scattered events lead to a peaked distribution, centred around 52 keV,
far from the FEP. For the volume sources, this distribution starts around 40 keV up to the
incident photons energy. In addition, the detailed analysis demonstrates that the scattering
effect in the liquid is the main contribution to the continuous bump obtained in experimental
spectra, whereas scattering in the container has a less significant impact.
Figure 6 presents the simulation results for 60 keV photons emitted from a 50 cm3 volume
source at the contact of window, what can be compared with Figure 4 where the source is at
whole spectrum represents about 28 % when the container is at the contact, and amounts up to
32.5 % when it is at 10 cm from the detector window.
2.2 Energy effect
For the 50 cm3 volume source at 10 cm from the detector window, the Monte Carlo
simulation has been performed with different incident energies. It was stated that the relative
contribution of scattering increases with energy, representing 30.3, 32.5, 35.1 and 37.2 % of
whole spectrum, for energies 40, 60, 80 and 100 keV, respectively.
2.1 Material effect
In the following, the study concentrates on scattering in the source or its container, which
corresponds to the high energy part of the spectra, on the left side of the FEP peak. The
influence of the source material is examined for 60 keV photons either coming from water,
silica or nitrogen included in a 50 cm3 plastic container at 10 cm from the detector window.
The respective results are presented in Figures 4,7 and 8. For water and silica, the scattering
distribution is mainly due to interactions in the matrix source, whereas for the gas source,
scattering in the container is the dominant effect.
Finally, the influence of the container material has been examined by comparing spectra
obtained with 80 keV photons emitted by water either in plastic or aluminium 50 cm3
container. The relative contribution of Compton scattering represents about 34 % and 37 % of
whole spectrum for the plastic and aluminium containers, respectively. Scattering in the water
is of the same size of order (about 22.5 %) for both cases. However, it is twice higher in the
aluminium container (about 6 %) than in the plastic one.
3.1 Influence on FEP area determination
In the low-energy region, scattering effect strongly disturbs spectrum shape and the resulting
high background prevents from accurately determining the FEP areas. In the traditional
approach to determine FEP, background subtraction is performed using either linear or step
function. The spectrum presented in Figure 2 (133Ba – Volume source) can be processed
according to this approach, using COLEGRAM software (Ruellan et al., 1996). However,
according to the above-mentioned results, scattering effect should be taken into account and
the processing should include this feature. On the quantitative aspect, the resulting peak areas
(sum of 79.6 and 81.0 keV) give respectively 1.741 x 10⁶ (“normal” background subtraction)
and 1.786 x 10⁶ (background subtraction including scattering), which gives a relative
difference of more than 2.5 %.
3.2 Efficiency transfer
Monte Carlo simulation can be used to compute efficiency for different geometrical
conditions, thus allowing derivation of transfer factors that can be used to determine
efficiency values for a measurement geometry different from the calibration one (Vidmar et
al., 2010). However, as discussed above, it can be difficult to achieve accurate peak area
determination due to the scattering contribution that strongly depends on the volume
geometry. Such a difference between calibration and measurement geometries is found in the
case of 133Ba and 133Xe: both decays towards excited levels of 133Cs thus emitting the same
photon energies. Consequently, efficiency calibration obtained from 133Ba should be easily
the activity of a 133Xe sample included in a stainless steel container placed at 6.8 cm at from
the detector window. Since no calibration is available for this geometry, the activity
measurement must include an efficiency transfer factor from 133Ba calibration obtained with a
50 cm3 liquid sources. But, due to the nature of the elements (barium is included in a solution,
whereas xenon is a gas), the geometrical conditions are different and so are relevant to the
experimental spectra, with very strong scattering in the case of xenon.
Another approach can thus be suggested for such volume samples: the transfer factor should
consider not only interactions inducing deposit of the whole initial energy of the photons
(FEP), but also those following scattering out of the detector. This is illustrated in Figure 9-a,
that presents Monte Carlo simulation results for 81 keV photons following the decay of 133Xe
(gas in a 100 cm3 stainless steel container). The energy region between 37 and 81 keV allow
calculation of a “transfer factor including scattering” for the 81 keV peak. This can be applied to the experimental spectrum (Figure 9-b) using the net area of the energy region plotted in
red. However, this approach is valid in such a specific case where the full-energy peak is well
isolated with no other contribution in the scattering region.
4. Conclusion
In this study, different aspects of the Compton scattering inside volume sources are illustrated
using experimental approach and Monte Carlo simulation. For the low-energy range (below
100 keV), the scattering contribution is significant in gamma-ray spectra and represents
around 30 % of the recorded events. Influence of the source-detector geometry is discussed:
for liquid sources, scattering in the source are dominant compared to scattering in the
contribution. These scattering effects induce strong differences in spectrum shape for different
geometrical conditions. This should influence efficiency transfer factors and a new approach
is proposed which is valid in specific conditions where the full-energy peak and associated
scattered distribution are well isolated. In these cases, the efficiency transfer factor can be
computed including the scattered events, what avoids complex peak area determination to get
Figures: 0 10 20 30 40 50 60 70 101 102 103 104 105 106 107 Escape Np LX-rays Escape peak 59.5 keV 43.4 keV 33.2 keV Point source Volume source C o u n ts p e r ch a n n e l Energy (keV) 59.5 keV 26.3 keV Np LX-rays
Figure 1: Spectra recorded with 241Am at 10 cm from the detector window: Black: Point source; Red: Water in a 50 cm3 plastic container
Figure 2: Spectra recorded with 133Ba at 10 cm from the detector window: Black: Point source – Red: Water in a 50 cm3 plastic container
20 40 60 80 103 104 105 106 107 Escape peak Cs K X-rays 53.2 keV Point source Volume source C o u n ts p e r ch a n n e l Energy (keV) 81.0 keV Cs K X-rays
Figure 3: Monte Carlo simulation for 60 keV photons emitted by a point source at 10 cm from the detector window
Figure 4: Monte Carlo simulation for 60 keV photons emitted by water in a 50 cm3 plastic container at 10 cm from the detector window
Figure 5: Monte Carlo simulation for 60 keV photons emitted by water in a 500 cm3 plastic
Figure 6: Monte Carlo simulation for 60 keV photons emitted by water in a 50 cm3 plastic container at contact of the detector window
Figure 7: Monte Carlo simulation for 60 keV photons emitted by silica in a 50 cm3 plastic container, at 10 cm from the detector window
Figure 8: Monte Carlo simulation for 60 keV photons emitted by nitrogen in a 50 cm3 plastic container, at 10 cm from the detector window
0 20 40 60 80 100 101 102 103 104 105 Sp e ct re Energy (keV) Figure 9: 133Xe: -
References
Bé, M.-M., Chisté, V., Dulieu, Mougeot, X., C., Browne, E., Chechev, V., Kuzmenko, N.,
Kondev, F., Nichols, A., Luca, A., Galan, M., Arinc, A., Huang, X., 2011. Table of
Radionuclides, Monographie BIPM-5, ISBN 13 978 92 822 2234 8 (set) and ISBN 13 978
92 822 2235 5 (CD), CEA/LNE-LNHB, 91191 Gif-sur-Yvette, France and BIPM, Pavillon
de Breteuil, 92312 Sèvres, France.
Ferreux, L. , Pierre, S., Thanh, T.T, Lépy, M.-C., 2012. Validation of efficiency transfer for
Marinelly geometries. These proceedings
Plagnard, J. Hamon, C., Lépy, M.-C., 2008. Study of scattering effects in gamma-ray
spectrometry. Applied Radiation and Isotopes 66, 769-773.
Ruellan, H., Lépy, M.-C., Etcheverry, M., Morel, J., 1996. A new spectra processing code
applied to the analysis of 235U and 238U in the 60 to 200 keV energy range. Nucl. Instrum.
Meth. in Phys. Res. A369, 651-656.
Salvat, F., Fernandez-Varea, J.M., Sempau, J., 2009. PENELOPE-2008: A code system for
Monte Carlo Simulation of Electron and Photon transport, OECD Nuclear Energy Agency,
Issy-les-moulineaux, France.
Vidmar, T., Çelik, N., Cornejo Díaz, N., Dlabac, A., Ewa, I.O.B., Carrazana González, J.A.,
Vasilopoulou, T. and Vidmar, G. 2010. Testing efficiency transfer codes for equivalence.