HAL Id: insu-02916815
https://hal-insu.archives-ouvertes.fr/insu-02916815
Submitted on 18 Aug 2020
HAL is a multi-disciplinary open access
archive for the deposit and dissemination of sci-entific research documents, whether they are pub-lished or not. The documents may come from teaching and research institutions in France or abroad, or from public or private research centers.
L’archive ouverte pluridisciplinaire HAL, est destinée au dépôt et à la diffusion de documents scientifiques de niveau recherche, publiés ou non, émanant des établissements d’enseignement et de recherche français ou étrangers, des laboratoires publics ou privés.
investigation
Anthony Beauvois, Delphine Vantelon, Jacques Jestin, Camille Rivard,
Martine Bouhnik-Le Coz, Aurélien Dupont, Valérie Briois, Thomas Bizien,
Andrea Sorrentino, Baohu Wu, et al.
To cite this version:
Anthony Beauvois, Delphine Vantelon, Jacques Jestin, Camille Rivard, Martine Bouhnik-Le Coz, et al.. How does calcium drive the structural organization of iron-organic matter aggregates? A multiscale investigation. Environmental science .Nano, Royal Society of Chemistry, 2020, 7 (9), pp.2833-2849. �10.1039/D0EN00412J�. �insu-02916815�
Environmental
Science
Nano
rsc.li/es-nano ISSN 2051-8153 PAPER Leanne M. Gilbertson et al.Methodology for quantifying engineered nanomaterial release from diverse product matrices under outdoor weathering conditions and implications for life cycle assessment
Volume 4 Number 9 September 2017 Pages 1756-1912
Environmental
Science
NanoThis is an Accepted Manuscript, which has been through the Royal Society of Chemistry peer review process and has been accepted for publication.
Accepted Manuscripts are published online shortly after acceptance, before technical editing, formatting and proof reading. Using this free service, authors can make their results available to the community, in citable form, before we publish the edited article. We will replace this Accepted Manuscript with the edited and formatted Advance Article as soon as it is available.
You can find more information about Accepted Manuscripts in the
Information for Authors.
Please note that technical editing may introduce minor changes to the text and/or graphics, which may alter content. The journal’s standard
Terms & Conditions and the Ethical guidelines still apply. In no event
shall the Royal Society of Chemistry be held responsible for any errors or omissions in this Accepted Manuscript or any consequences arising from the use of any information it contains.
Accepted Manuscript
This article can be cited before page numbers have been issued, to do this please use: A. Beauvois, D. vantelon, J. Jestin, C. Rivard, M. Bouhnik-Le-Coz, A. Dupont, V. Briois, T. Bizien, A. Sorrentino, B. Wu, M. Appavou, E. Lotfi-Kalahroodi, A. pierson-wickmann and M. Davranche, Environ. Sci.: Nano, 2020, DOI: 10.1039/D0EN00412J.
Environmental Significance Statement
In environmental systems, the production of iron-organic matter (Fe-OM) nano-aggregates has been significantly increasing in recent decades due to climate change. These nano-aggregates are expected to be a major controlling factor of micro-pollutant mobility. Herein, we demonstrate that with an increasing Ca concentration, Fe-OM structures move from nanometric aggregates to a micrometric network in which the size of Fe phases increases. These results shed new light on the mobility of Fe-OM aggregates and potentially associated micro-pollutants that seems to depend on Fe-OM organization which is modified by major ion species present during their production. These findings are of major importance to discern the structure and behaviour of Fe-OM colloids in their production areas such as riparian wetlands, soil erosions or permafrost thawing. 3 4 5 6 7 8 9 10 11 12 13 14 15 16 17 18 19 20 21 22 23 24 25 26 27 28 29 30 31 32 33 34 35 36 37 38 39 40 41 42 43 44 45 46 47 48 49 50 51 52 53 54 55 56 57 58 59
Environmental
Science:
Nano
Accepted
Manuscript
Published on 05 August 2020. Downloaded by Bibliotheque de L’Universite de Rennes I on 8/18/2020 7:49:49 AM.
View Article Online
How does calcium drive the structural organization of
iron-organic matter aggregates?
A multiscale investigation
Anthony Beauvois*
a,b,c, Delphine Vantelon
b, Jacques Jestin
c, Camille Rivard
b,d,Martine Bouhnik-Le Coz
a, Aurélien Dupont
e, Valérie Briois
b, Thomas Bizien
b,
Andrea Sorrentino
f, Baohu Wu
g, Marie-Sousai Appavou
g, Elaheh
Lotfi-Kalahroodi
a, Anne-Catherine Pierson-Wickmann
aand Mélanie Davranche
aaUniv. Rennes, CNRS, Géosciences Rennes - UMR 6118, F-35000 Rennes, France
bSynchrotron SOLEIL, L’Orme des Merisiers, Saint-Aubin BP48, 91192 Gif-sur-Yvette Cedex
cLaboratoire Léon Brillouin, CEA Saclay, 91191 Gif-sur-Yvette Cedex
dINRAE - UAR 1008 TRANSFORM, F-44316 Nantes, France
eUniv Rennes, CNRS, Inserm, BIOSIT - UMS 3480, US_S 018, F-35000 Rennes, France
fALBA Synchrotron Light Facility, Carrer de la Llum 2-26, 08290 Cerdanyola del Vallès, Spain
gForschungszentrum Jülich, JCNS am MLZ, Lichtenbergstr. 1, 85748 Garching, Germany
*Corresponding author: anthony.beauvois@univ-rennes1.fr
Abstract
Iron-organic matter (Fe-OM) aggregates are a key factor in the control of pollutant mobility. Their physical and structural organization depends on the prevailing physicochemical
3 4 5 6 7 8 9 10 11 12 13 14 15 16 17 18 19 20 21 22 23 24 25 26 27 28 29 30 31 32 33 34 35 36 37 38 39 40 41 42 43 44 45 46 47 48 49 50 51 52 53 54 55 56 57 58 59 60
Environmental
Science:
Nano
Accepted
Manuscript
Published on 05 August 2020. Downloaded by Bibliotheque de L’Universite de Rennes I on 8/18/2020 7:49:49 AM.
View Article Online
conditions during their formation and on subsequent exposure to variations in porewater goechemistry. Among these conditions, calcium (Ca) could be a major parameter given its high concentrations in the environment and its affinity for OM. Mimetic environmental Fe-OM-Ca associations were synthesized at various Fe/organic carbon (OC) and Ca/Fe molar ratios using Leonardite humic acid as OM model. The impact of Ca on Fe-OM aggregates was studied by a combination of X-ray absorption spectroscopy, small angle X-ray and neutron scattering and imaging techniques (TEM, cryo-TEM and cryo-TXM). Iron phases are constituted of Fe(III)-oligomers, Fe(III)-nanoparticles and ferrihydrite (Fh), all bound or embedded by OM. Iron phases exhibit a fractal organization with Fe-primary beads aggregated as Fe-primary aggregates (Fe-PA) which themselves are embedded in an OM aggregates. For Ca/OC (mol/mol) < 0.026, Fe-PA aggregate in a third level as a Fe-secondary aggregate. For Ca/OC ≥ 0.026, OM forms a large Ca-branched network in which Ca is bound as a dimer to OM carboxylic sites. In such conditions, Fe-PA are distributed in the OM network, distant from each other. All these structural transitions are driven by Ca which partially screens the Fe-OM interactions. The formation of such micrometric network should impact both the surface reactivity of the Fe phases as well as the mobility of Fe, OM and associated elements, notably in the soil porosity where they are produced under natural conditions.
3 4 5 6 7 8 9 10 11 12 13 14 15 16 17 18 19 20 21 22 23 24 25 26 27 28 29 30 31 32 33 34 35 36 37 38 39 40 41 42 43 44 45 46 47 48 49 50 51 52 53 54 55 56 57 58 59
Environmental
Science:
Nano
Accepted
Manuscript
Published on 05 August 2020. Downloaded by Bibliotheque de L’Universite de Rennes I on 8/18/2020 7:49:49 AM.
View Article Online
Introduction
Environmental nanoparticles are ubiquitous in natural systems1. Among them, natural
iron-organic matter (Fe-OM) aggregates are of major importance due to their high amounts in natural
systems such as in wetlands2–4, peatlands5,6 or permafrosts7,8. They are mainly produced in soils
via anthropogenic forcing and geochemical and physical processes such as alteration and erosion, oxidation-reduction variations occurrence subsequent to soil
water-saturation/desaturation alternation. The production of these aggregateshas tended to strongly
increase in recent decades due to global warming which result in an increase in rainfall frequency, volume and intensity as well as permafrost thawing. Due to their nanometric size and their high specific surface area, they are known to be a key factor in the mobility of metals
and metalloids in environmental systems1,2,6,9,10. Their ability to adsorb metal(loid)s depends
on the size, morphology and structural arrangement between the Fe and OM phases11,12. Several
studies have investigated the structural organization of Fe phases formed during Fe(II)
oxidation-hydrolysis or Fe(III) hydrolysis in the presence of OM13–18. Irrespective of the
process of formation, the Fe speciation depends on the Fe/organic carbon (OC) ratio. For very
low Fe/OC ratios, the dominant Fe species are Fe(III) oligomers bound to OM11,19 while for
high Fe/OC ratio, nanoparticulate Fe embedded in an OM matrix are formed20,21. For
intermediate Fe/OC ratios, Fe-OM aggregates contain two distinct Fe phases: Fe(III) oligomers
bound to OM and nano-sized ferrihydrite (Fh) embedded in an OM matrix14,18,22. According to
Chen et al.18, a decrease in Fe(III) oligomers occurs to the benefit of Fh with an increasing
Fe/OC ratio. Guénet et al.13 demonstrated that the Fe part is organized according to a fractal
network composed of Fe primary beads (radius ≈ 0.8 nm) that associate to form Fe primary aggregates (radius ≈ 5 nm) that are themselves associated as Fe secondary aggregates (radius > 100 nm). They described the OM part as a compact aggregate (radius ≈ 90 nm) bound to Fe
3 4 5 6 7 8 9 10 11 12 13 14 15 16 17 18 19 20 21 22 23 24 25 26 27 28 29 30 31 32 33 34 35 36 37 38 39 40 41 42 43 44 45 46 47 48 49 50 51 52 53 54 55 56 57 58 59 60
Environmental
Science:
Nano
Accepted
Manuscript
Published on 05 August 2020. Downloaded by Bibliotheque de L’Universite de Rennes I on 8/18/2020 7:49:49 AM.
View Article Online
secondary aggregates as well as isolated molecules bound to Fe primary aggregates. The size of Fe-OM aggregates increases with the increasing Fe/OC ratio.
These species were also observed in organic soil as Fe monomers and Fe oxyhydroxides bound
to OM22 and in boreal rivers as nano-Fh and Fe-OM complexes23. ThomasArrigo et al.6 reported
the presence of lepidocrocite (Lp) and Fh in a peatland soil. Guénet et al.2 studied a riparian
wetland soil and provided evidence of the presence of nano-Lp embedded in an OM matrix, as well as small Fe clusters (i.e. oligomers) and Fe monomers bound to OM.
In the absence of OM, Fe(II) oxidation-hydrolysis leads to the formation of micrometric-sized
aggregates of nano-Lp17,24 whereas with humic acid (HA), Fe oxyhydroxides of nanometric size
are formed2,14,17. Therefore, organic matter controls the behaviour of Fe in organic
environments and the physical, chemical and morphological organization of Fe-OM aggregates is influenced by the prevailing physico-chemical conditions such as pH, ionic strength or other
major cations25–27. In natural waters, calcium (Ca) is a major ion with a concentration ranging
from 1.0×10⁻² to 1.0×10⁻⁴ mol L-1 28. Several studies have investigated the impact of Ca on the
structural organization of natural OM. Calcium acts as a coagulating agent for OM by forming
cationic bridges between molecules, preferentially involving carboxylic groups29–31 but also via
phenolic groups with increasing pH values32. Kalinichev and Kirkpatrick31 reported the
formation of OM supramolecular structures with Ca. Calcium has also been shown to increase
the adsorption of fulvic acids (FA) on goethite33 leading to the formation of goethite-Ca-FA
ternary associations, and to aggregate OM with clay minerals34. Adhikari et al.35 provided
evidence that the hydrolysis of Fe(III) with OM and Ca leads to the formation of Fh-OM-Ca
precipitates in which OM acts as a bridge between Fh and Ca. Davis and Edwards36
demonstrated that Ca2+ complexation by OM enhances Fe(III) hydrolysis resulting in better
polymerization of Fe with Ca. However, there are lacks of information on the overall structural organization of Fe-OM-Ca associations.
3 4 5 6 7 8 9 10 11 12 13 14 15 16 17 18 19 20 21 22 23 24 25 26 27 28 29 30 31 32 33 34 35 36 37 38 39 40 41 42 43 44 45 46 47 48 49 50 51 52 53 54 55 56 57 58 59
Environmental
Science:
Nano
Accepted
Manuscript
Published on 05 August 2020. Downloaded by Bibliotheque de L’Universite de Rennes I on 8/18/2020 7:49:49 AM.
View Article Online
The aim of this study is therefore to provide a complete characterization of the impact of Ca on the composition and structural organization of Fe-OM aggregates. For this purpose, we synthesized Fe-OM-Ca associations with various Fe/OC and Ca/Fe ratios. Calcium interactions with Fe-OM and Fe speciation were investigated by X-ray absorption spectroscopy (XAS) at the Ca and Fe K-edge. The arrangement of nanoparticulate Fe and OM was probed combining angle X-rays scattering (SAXS), angle neutrons scattering (SANS) and very small-angle neutrons scattering (VSANS). The overall size of the aggregates was investigated by cryo-transmission X-ray microscopy (cryo-TXM) and cryo-transmission electron microscopy (cryo-TEM).
Experimental methods
1. Sampling and chemical analyses
1.1. Laboratory syntheses
All aqueous solutions were prepared with ultrapure water (Milli-Q-Integral®, Millipore).
Samples were synthesized at three Fe/OC molar ratios (i.e. 0.02, 0.05 and 0.08) and at four
Ca/Fe molar ratios (i.e. 0, 0.1, 0.5 and 1) following the procedure described by Guénet et al.13.
Samples were labelled Fexx-Cayy, where Fexx and Cayy represent the Fe/OC and the Ca/Fe ratios, respectively. The OM used was Leonardite Humic Acid (HA) (International Humic Substances Society) with the elemental composition C = 63.81%, O = 31.27%, H = 3.70% and
N = 1.23% (as a mass fraction). A 1.79×10⁻² mol L-1 iron(II) stock solution was prepared with
FeCl2.4H2O (Sigma Aldrich). From this solution, three Fe(II)-Ca(II) stock solutions were
prepared at [Ca] = 2.50×10⁻³ mol L-1, 1.25×10⁻² mol L-1 and 2.50×10⁻² mol L-1 with CaCl
2.2H2O
(Sigma Aldrich). Aggregates (Fe-OM-Ca) were synthesized using a titration of a HA
suspension at [OC] = 1.00×10⁻¹ mol L-1 with the Fe(II)-Ca(II) solution at 0.05 mL min-1 in 5×10
-3 mol L-1 of NaCl using an automated titrator (Titrino 794, Metrohm). The pH was kept constant
3 4 5 6 7 8 9 10 11 12 13 14 15 16 17 18 19 20 21 22 23 24 25 26 27 28 29 30 31 32 33 34 35 36 37 38 39 40 41 42 43 44 45 46 47 48 49 50 51 52 53 54 55 56 57 58 59 60
Environmental
Science:
Nano
Accepted
Manuscript
Published on 05 August 2020. Downloaded by Bibliotheque de L’Universite de Rennes I on 8/18/2020 7:49:49 AM.
View Article Online
at 6.5 with a 0.1 mol L-1 NaOH solution using a second titrator (Titrino 794, Metrohm) at a set
pH mode. The accuracy of the pH measurement was ± 0.04 pH units. A fraction of each sample was subjected to filtration at 0.2 µm (cellulose acetate membrane filter, Sartorius) and ultrafiltration at 30 kDa (Vivaspin VS2022, Sartorius). Each 0.2 µm filter was rinsed before use with ultrapure water and each 30 kDa ultrafiltration cell was rinsed 10 times with NaOH 0.1
mol L-1 and two times with ultrapure water. Two samples were also prepared using the same
protocol but without Fe at Ca concentrations of 1.00×10⁻⁴ and 5.00×10⁻³ mol L-1.
1.2. Chemical analyses
OC concentrations were determined using an organic carbon analyser (Shimadzu TOC-V CSH). The accuracy of the OC measurement was determined to be ±5% using a standard solution of potassium hydrogen phthalate (Sigma Aldrich). The Fe and Ca concentrations were measured by ICP-MS using an Agilent Technologies 7700x instrument at the University of
Rennes 1. To eliminate OM, samples were pre-digested with 14.6 mol L-1 HNO
3 and
suprapure® 30% H2O2 at 90°C and evaporated. The final concentrations of Fe, Ca, and OC are
reported in Table 1 for the bulk and in Table SI 1 for the filtrates and ultrafiltrates.
3 4 5 6 7 8 9 10 11 12 13 14 15 16 17 18 19 20 21 22 23 24 25 26 27 28 29 30 31 32 33 34 35 36 37 38 39 40 41 42 43 44 45 46 47 48 49 50 51 52 53 54 55 56 57 58 59
Environmental
Science:
Nano
Accepted
Manuscript
Published on 05 August 2020. Downloaded by Bibliotheque de L’Universite de Rennes I on 8/18/2020 7:49:49 AM.
View Article Online
7
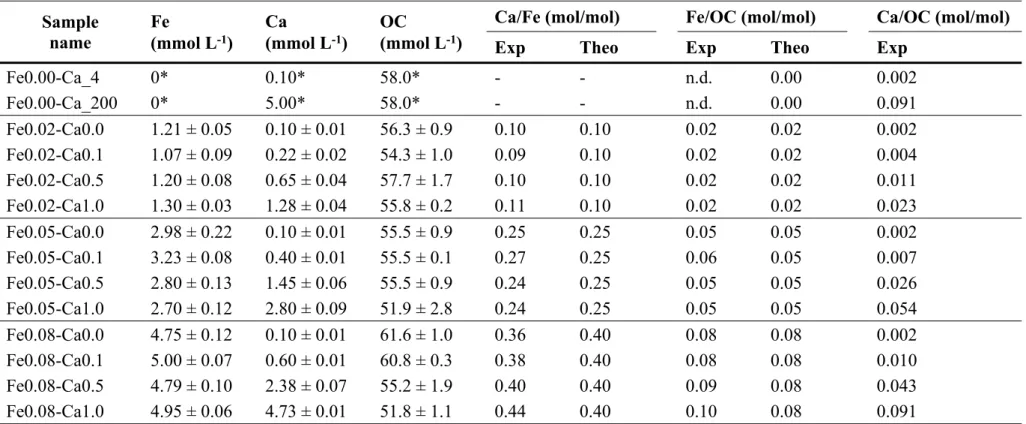
Table 1 – Fe, Ca and OC concentrations. *Theoretical values, n.d.: not determined. Exp: experimental. Theo: theoretical. The uncertainties were calculated from the triplicate.
Fe Ca OC Ca/Fe (mol/mol) Fe/OC (mol/mol) Ca/OC (mol/mol)
Sample
name (mmol L-1) (mmol L-1) (mmol L-1)
Exp Theo Exp Theo Exp
Fe0.00-Ca_4 0* 0.10* 58.0* - - n.d. 0.00 0.002 Fe0.00-Ca_200 0* 5.00* 58.0* - - n.d. 0.00 0.091 Fe0.02-Ca0.0 1.21 ± 0.05 0.10 ± 0.01 56.3 ± 0.9 0.10 0.10 0.02 0.02 0.002 Fe0.02-Ca0.1 1.07 ± 0.09 0.22 ± 0.02 54.3 ± 1.0 0.09 0.10 0.02 0.02 0.004 Fe0.02-Ca0.5 1.20 ± 0.08 0.65 ± 0.04 57.7 ± 1.7 0.10 0.10 0.02 0.02 0.011 Fe0.02-Ca1.0 1.30 ± 0.03 1.28 ± 0.04 55.8 ± 0.2 0.11 0.10 0.02 0.02 0.023 Fe0.05-Ca0.0 2.98 ± 0.22 0.10 ± 0.01 55.5 ± 0.9 0.25 0.25 0.05 0.05 0.002 Fe0.05-Ca0.1 3.23 ± 0.08 0.40 ± 0.01 55.5 ± 0.1 0.27 0.25 0.06 0.05 0.007 Fe0.05-Ca0.5 2.80 ± 0.13 1.45 ± 0.06 55.5 ± 0.9 0.24 0.25 0.05 0.05 0.026 Fe0.05-Ca1.0 2.70 ± 0.12 2.80 ± 0.09 51.9 ± 2.8 0.24 0.25 0.05 0.05 0.054 Fe0.08-Ca0.0 4.75 ± 0.12 0.10 ± 0.01 61.6 ± 1.0 0.36 0.40 0.08 0.08 0.002 Fe0.08-Ca0.1 5.00 ± 0.07 0.60 ± 0.01 60.8 ± 0.3 0.38 0.40 0.08 0.08 0.010 Fe0.08-Ca0.5 4.79 ± 0.10 2.38 ± 0.07 55.2 ± 1.9 0.40 0.40 0.09 0.08 0.043 Fe0.08-Ca1.0 4.95 ± 0.06 4.73 ± 0.01 51.8 ± 1.1 0.44 0.40 0.10 0.08 0.091 Page 8 of 42 Environmental Science: Nano
1 2 3 4 5 6 7 8 9 10 11 12 13 14 15 16 17 18 19 20 21 22 23 24 25 26 27 28 29 30 31 32 33 34 35 36 37 38 39 40 41 42 43 44 45 46 47 48 49 50 51 52 53 54 55 56 57 58
Environmental
Science:
Nano
Accepted
Manuscript
2. Structural characterizations
2.1. XAS data acquisition and analysis
A fraction of each sample was freeze dried (Freeze dryer Alpha 1-2 LD plus, Christ). The obtained powder was pressed into a 6 mm pellet mixed with cellulose (Merck). X-ray
absorption spectroscopy (XAS) at the Ca K-edge was performed on the LUCIA37,38 beamline
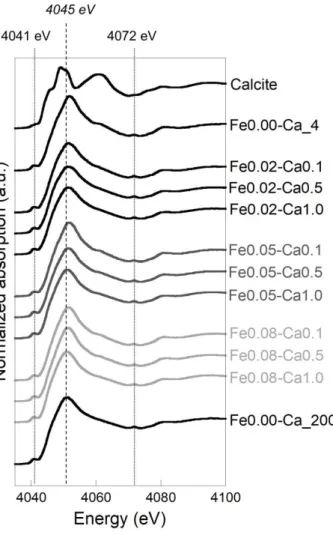
at the SOLEIL synchrotron (Saint-Aubin, France). The fixed exit double-crystal monochromator was equipped with Si(111) crystals. Spectra were recorded in fluorescence mode using a 60 mm² mono-element silicon drift diode detector (Bruker). The energy was calibrated using the calcite reference for which the first inflection point was set to 4045 eV.
The Fe K-edge spectra were recorded on the ROCK39 beamline at the SOLEIL synchrotron. A
Si(111) channel-cut was used as the monochromator. Spectra were recorded in transmission
mode using three ionization chambers (Ohyo Koken) filled with N2. The energy was calibrated
using a Fe foil located between the 2nd and the 3rd ionization chambers and measured
simultaneously with the samples. Calibration was done by setting the maximum of the first derivate of the Fe foil to 7112 eV. The spectra were acquired with the quick-EXAFS technology allowing measuring one spectrum every 1s. For each sample, a total of 1500 spectra were recorded and could be superimposed, suggesting no damage of the sample due to the beam. The final spectrum was obtained by averaging the 1500 spectra. The references used for further data analysis were Fh and Lp synthesized following the procedure described in Schwertmann and
Cornell24.
All XAS data were processed using the Athena software40 including the Autbk algorithm (Rbkb
= 1, k-weight = 3). Normalized Ca spectra were obtained by fitting the pre-edge region with a linear function and the post-edge region with a quadratic polynomial function. The Fourier
transforms of the k3-weighted extended X-ray absorption fine structure (EXAFS) spectra were
calculated over a range of 2-10.5 Å−1 using a Hanning apodization window (window parameter
3 4 5 6 7 8 9 10 11 12 13 14 15 16 17 18 19 20 21 22 23 24 25 26 27 28 29 30 31 32 33 34 35 36 37 38 39 40 41 42 43 44 45 46 47 48 49 50 51 52 53 54 55 56 57 58 59
Environmental
Science:
Nano
Accepted
Manuscript
Published on 05 August 2020. Downloaded by Bibliotheque de L’Universite de Rennes I on 8/18/2020 7:49:49 AM.
View Article Online
= 1). Back Fourier filters were extracted over the R-range of 1.3-3.1 Å, using the same apozidation window shape. The EXAFS fittings were performed in the 1.3–3.6 Å distance range
with the Artemis40 interface to IFEFFIT using least-squares refinements. The paths used to fit
the Ca K-edge EXAFS were calculated from Ca-acetate41 and Ca-2-furancarboxylate42 using
the FEFF6 algorithm included in the Artemis interface43,44. Normalized Fe spectra were
obtained by fitting the pre-edge region with a linear function and the post-edge region with a
quadratic polynomial function. The Fourier transforms of the k3-weighted EXAFS spectra were
calculated over a range of 2-12.5 Å−1 using a Hanning apodization window (window parameter
= 1). Back Fourier filters were extracted over the R-range of 1.15-4.1 Å, using the same apodization window shape. The EXAFS data were analysed by linear combination fitting (LCF)
available in the Athena software on the range 3-12.5 Å−1; all component weights were forced
to be positive. The references used were Fh, Lp and three pure components extracted from the
in situ synthesis of Fe-OM aggregates by Vantelon et al.14, i.e. Fe(II), Fe(III)-oligomers and
Fe(III)-Np that correspond to Fe(III) nano-oxyhydroxides, all bound or embedded in a HA matrix. The best LCF fit was determined for the minimum n-components for which the R-factor was better than 10% of the fit with n+1 components. As without any constraint the total LCF weight for each sample was between 0.95 and 1.05, it was arbitrarily fixed to 1 to facilitate comparisons between each sample.
2.2. SAXS data acquisition and analysis
Small angle X-ray scattering measurements were performed on the SWING beamline at the SOLEIL synchrotron. Two sample-to-detector distances (1 and 6 m) were used with a
wavelength of 1.03 Å. This setup allowed access to a momentum transfer q range of 2.0×10⁻³
-0.7 Å-1. Measurements were also performed on the XEUSS 2.0 spectrometer from Xenocs
(CEA-LIONS/LLB, Saclay, France). Two sample-to-detector distances (33 and 249 cm) were used with a wavelength of 1.54 Å (Cu X-ray source). This setup allowed access to a momentum
3 4 5 6 7 8 9 10 11 12 13 14 15 16 17 18 19 20 21 22 23 24 25 26 27 28 29 30 31 32 33 34 35 36 37 38 39 40 41 42 43 44 45 46 47 48 49 50 51 52 53 54 55 56 57 58 59 60
Environmental
Science:
Nano
Accepted
Manuscript
Published on 05 August 2020. Downloaded by Bibliotheque de L’Universite de Rennes I on 8/18/2020 7:49:49 AM.
View Article Online
transfer range of 4.5×10⁻³-0.5 Å-1. Measurements were performed on the suspensions except
for the three settled samples (Figure SI 1) for which the experiments were carried out on the precipitate. All scattering curves were rescaled as a function of the apparent concentration in the high q range.
The cluster fractal model described in Guénet et al.13 was used to analyse the SAXS curves.
For centrosymmetric nanoparticles dispersed in a continuous solvent, here water, the scattered intensity is described by the following equation (eq. 1):
I(q)=φ.V.Δρ².P(q).S (q)
where φ is the volume fraction, V is the volume of the scattered entities, Δρ² is the contrast term, P(q) is the form factor and S(q) is the structure factor. The model was established considering that the samples are composed of Fe spherical poly-dispersed primary beads (Fe-PB). Part of these PB is organized as Fe primary aggregates (Fe-PA) described by a form factor according to a finite number of PB and a fractal dimension. These Fe-PA self-assembled as a third aggregation level, i.e. the Fe secondary aggregates (Fe-SA).
2.3. SANS and VSANS acquisition and analysis
The neutron scattering length density (SLD) of H2O is SLDH2O = -0.56×1010 cm-2 while SLDD2O
= 6.4×1010 cm-2. Considering SLD = 1.18×1010 cm-2 and = 6.05×1010 cm-213,
Fe-Ca-OM SLDFe
OM aggregates were synthesized in D2O to match the Fe contribution to the neutron scattering
and to only characterize the OM part. We completed the SANS investigation with a second
intermediate contrast at 50/50% H2O/D2O to see whether we can identify a local contribution
of the OM scattering signal. Small-angle neutron scattering (SANS) experiments were performed on the PA20 beamline (LLB, Saclay, France). Three sample-to-detector distances (2, 8 and 18 m) were used with a wavelength of 6 Å. This setup allowed access to a momentum
transfer range of 2.1×10⁻³-0.3Å-1. SANS measurements were also performed on KWS-2
diffractometers45 operated by the Jülich Centre for Neutron Science (JCNS) at the Heinz
Maier-(eq. 1) 3 4 5 6 7 8 9 10 11 12 13 14 15 16 17 18 19 20 21 22 23 24 25 26 27 28 29 30 31 32 33 34 35 36 37 38 39 40 41 42 43 44 45 46 47 48 49 50 51 52 53 54 55 56 57 58 59
Environmental
Science:
Nano
Accepted
Manuscript
Published on 05 August 2020. Downloaded by Bibliotheque de L’Universite de Rennes I on 8/18/2020 7:49:49 AM.
View Article Online
Leibnitz Zentrum (MLZ) in Garching, Germany. Using a sample-to-detector distance of 1.1 m and 7.6 m with a wavelength of 7 Å (Δλ/λ = 10%) and a sample-to-detector distance of 19.5 m
with a wavelength of 10 Å (Δλ/λ = 10%): the q-range 1.9×10⁻³-4.5×10⁻¹ Å-1 was covered. Very
small-angle neutron scattering (VSANS) experiments were carried out with KWS-3
diffractometers46 operated by the JCNS at the MLZ. Using a neutron wavelength of 12.8 Å with
Δλ/λ = 17% and a sample to detector distance of 0.51 m, 1.25 m and 9.2 m, a q-range from
approximately 2.1×10⁻⁴-5.0×10⁻² Å-1 was covered. Like for SAXS, SANS measurements were
performed on suspensions except for the three settled samples (Figure SI 1) for which experiments were carried out on the precipitate. All scattering curves were rescaled to the apparent concentration in the high q range. Data were corrected and calibrated using the Pasinet and QtiKWS softwares.
SANS curves were fitted using the SasView software with the following Guinier-Porod
equation47 (eq. 2): I(q) =
{
G qsexp(
― q2R2 g3 ― s
)
for q < qcut ― off Dqα for q > qcut ― off
where G and D are scaling factors for the Guinier and Porod domains respectively, Rg is the
gyration radius that corresponds to a typical size of the system, s is a parameter illustrating the nonspherical form of the object (s = 0 for a sphere, s = 1 for rods and s = 2 for lamellae) and α
is the slope of the curve related to the fractal dimension (Df) of the object. The q cut-off defines
the limit between the Guinier and the Porod regime.
2.4. Imaging
For the TEM measurements, 5 µL of the samples were dropped on a copper grid with a lacy carbon coated film (Agar scientific, AGS166-3) and then dried at room temperature. Transmission electron microscopy images were recorded using a JEOLL 100CXII instrument at 100 kV (THEMIS Analytical Facility, University of Rennes 1) equipped with an X-ray
(eq. 2) 3 4 5 6 7 8 9 10 11 12 13 14 15 16 17 18 19 20 21 22 23 24 25 26 27 28 29 30 31 32 33 34 35 36 37 38 39 40 41 42 43 44 45 46 47 48 49 50 51 52 53 54 55 56 57 58 59 60
Environmental
Science:
Nano
Accepted
Manuscript
Published on 05 August 2020. Downloaded by Bibliotheque de L’Universite de Rennes I on 8/18/2020 7:49:49 AM.
View Article Online
energy dispersive spectroscopy (XEDS) detector (Kevex detector with an ultrathin window). For the cryo-TEM measurements, samples were vitrified using a Leica EM GP immersion under
controlled humidity and temperature48. Samples were deposited on glow-discharged electron
microscope grids followed by blotting and vitrification by rapid freezing in liquid ethane (-184°C). Grids were transferred to a single-axis cryo-holder (model 626, Gatan) and were observed using a 200 kV electron microscope (Tecnai G2 T20 Sphera, FEI) equipped with a 4k × 4k CCD camera (model USC 4000, Gatan). Micrographs were acquired under low electron doses using the camera in binning mode 1 and at a nominal magnification of 50,000x. For the cryo-TXM measurements, samples were frozen using a Leica EM GP immersion freezer. The environmental chamber was kept at 20°C with 80% humidity. Four μL of the sample were dropped on a hydrophilized (air plasma treated using Henniker HPT-100 plasma treatment) carbon coated copper grid (Quantifoil R2/2 type grid). The grid was blotted with n°1 Whatman filter paper prior to freezing and then automatically plunged into liquid ethane. The samples were stored in liquid nitrogen until further use. The cryo-TXM images were recorded at the full
field transmission soft X-ray microscope installed at the MISTRAL beamline49 of the ALBA
synchrotron. A capillary condenser lens after the monochromator exit slit focuses the radiation to the sample. After the sample, a Fresnel zone plate with outermost zone width of 25 nm was used as objective lens to record a magnified image on a direct illumination CCD detector (Pixis XO by Princeton Instruments with 1024 × 1024 pixels and 13 μm pixel size). The spatial resolution of the system is limited by the objective lens and was estimated to be 23 nm half
pitch at 520 eV using a Siemens star pattern with 30 nm smallest features50. The magnification
used for the transmission image was × 1300, corresponding to an effective pixel size of 10 nm. Twenty images with an exposure time of 3 seconds each were acquired and then averaged. The average transmitted intensity I and the corresponding Flat Field I0 (i.e. the incident intensity on the sample) were used to obtain the transmission T, related to the linear absorption coefficient
3 4 5 6 7 8 9 10 11 12 13 14 15 16 17 18 19 20 21 22 23 24 25 26 27 28 29 30 31 32 33 34 35 36 37 38 39 40 41 42 43 44 45 46 47 48 49 50 51 52 53 54 55 56 57 58 59
Environmental
Science:
Nano
Accepted
Manuscript
Published on 05 August 2020. Downloaded by Bibliotheque de L’Universite de Rennes I on 8/18/2020 7:49:49 AM.
View Article Online
of the sample by the Beer-Lambert law. The energy was set to 520 eV to maximize the contrast between water and carbon, calcium and iron rich regions of the imaged suspension.
Results and discussion
1. Iron speciation within aggregates
Fe speciation within the aggregates was studied by XAS at Fe K-edge. The XANES spectra
(Figure SI 2) are similar and representative of Fe(III) in an octahedral symmetry51. All EXAFS
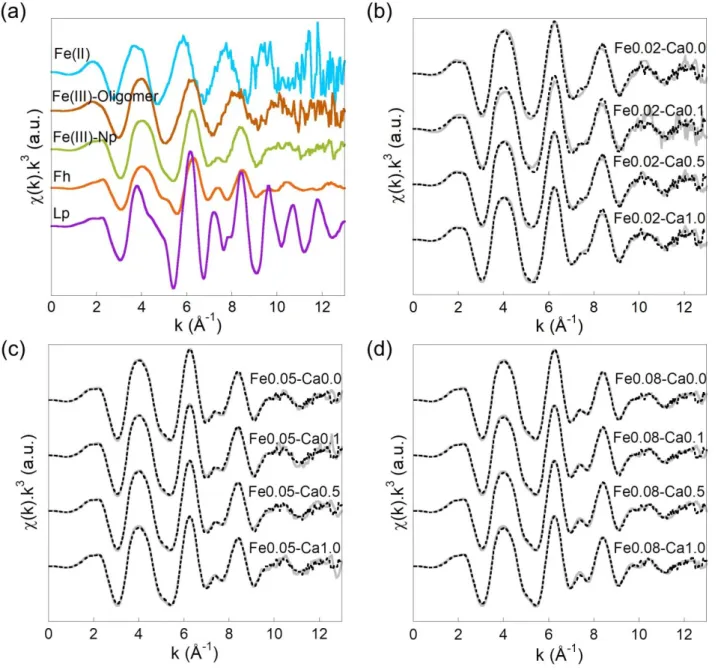
spectra exhibit a maximum of amplitude at 6.3 Å-1 (Figure 1). Fe(II) and Fe(III)-oligomer
spectra exhibit a damping shape that is close to monotonous. The oscillations of the Fe(II) spectra are shifted to low photoelectron wavevector, k, values as compared to Fe(III) species.
Iron(III)-Np and Fh exhibit a shoulder at 5.1 Å-1 and an oscillation at 7.5 Å-1 that are more
intense for Fh than Fe(III)-Np (Figure 1a). The Lp spectrum is well-structured with a shoulder
at 4.7 Å-1, a strong oscillation at 7.2 Å-1 and a smaller one at 7.9 Å-1. For the Fe-OM-Ca
aggregates, the oscillations occurred at the same k values as the Fe(III) references evidencing the presence of Fe(III). More precisely, two different behaviours can be observed depending on
the Fe/OC ratio. Spectra for Fe/OC = 0.02 exhibit a monotonous shape except at 7.5 Å-1 where
a shoulder occurs (Figure 1b). Samples formed at Fe/OC = 0.05 and Fe/OC = 0.08 exhibit more
structured EXAFS spectra with an additional shoulder at 5.1 Å-1 and a pronounced shoulder at
7.4 Å-1 (Figure 1c and d).
Guénet et al.2 demonstrated that nano-Lp coexist with small Fe-clusters bound to OM in
riparian wetland soils. Similar results were demonstrated by ThomasArrigo et al.6 who provided
evidence of Fh and Lp occurrence in OM-rich environmental systems. Moreover, Vantelon et
al.14 demonstrated that within Fe(III)-OM aggregates for Fe/OC = 0.08, Fe(III)-oligomers and
Fe(III)-Np occurred together. Linear combination fittings were performed on the EXAFS spectra of the Fe-OM-Ca aggregates using the signal of Fe(II), Fe(III)-oligomers, Fe(III)-Np, Fh and Lp. Only Fe(III)-oligomers and Fe(III)-Np EXAFS signals were necessary to reproduce
3 4 5 6 7 8 9 10 11 12 13 14 15 16 17 18 19 20 21 22 23 24 25 26 27 28 29 30 31 32 33 34 35 36 37 38 39 40 41 42 43 44 45 46 47 48 49 50 51 52 53 54 55 56 57 58 59 60
Environmental
Science:
Nano
Accepted
Manuscript
Published on 05 August 2020. Downloaded by Bibliotheque de L’Universite de Rennes I on 8/18/2020 7:49:49 AM.
View Article Online
by LCF the experimental data for Fe/OC = 0.02 whereas for the highest Fe/OC ratio, Fe(III)-oligomers, Fe(III)-Np and Fh EXAFS signals were needed. If they exist, Fe(II) and Lp amount were below the detection limit (Figure 1 and Table SI 1). Several studies similarly demonstrated
that with fulvic or humic acids, Fe(II) oxidation-hydrolysis did not produce Lp14,17,52. This
discrepancy regarding the occurrence of Lp could be explained by the variability in the physico-chemical conditions prevailing during aggregate formation.
Figure 1 – Iron K-edge EXAFS spectra of (a) references used for LCF and samples at (b) Fe/OC = 0.02, (c) Fe/OC = 0.05 and (d) Fe/OC = 0.08. Solid lines are experimental data and dotted lines are the LCF results.
For Fe/OC = 0.02, and Ca/Fe = 0.0 and 0.1, the EXAFS signal features at 5.1 and 7.4 Å-1 are
3 4 5 6 7 8 9 10 11 12 13 14 15 16 17 18 19 20 21 22 23 24 25 26 27 28 29 30 31 32 33 34 35 36 37 38 39 40 41 42 43 44 45 46 47 48 49 50 51 52 53 54 55 56 57 58 59
Environmental
Science:
Nano
Accepted
Manuscript
Published on 05 August 2020. Downloaded by Bibliotheque de L’Universite de Rennes I on 8/18/2020 7:49:49 AM.
View Article Online
not perfectly reproduced by LCF. For Fe/OC = 0.08, Fe(III)-oligomers are described as
tetramers bound to OM14. However, Vilgé-Ritter et al.53 and Mikutta et al.11 described
Fe(III)-oligomers as trimers for Fe/OC = 0.02 and 0.004 respectively. For Fe/OC = 0.02, Fe(III)
monomers bound to OM were also reported by Karlsson and Persson19. The tiny discrepancy
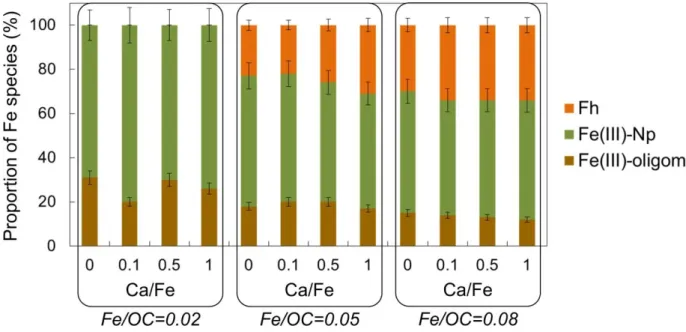
observed between the data and LCF can therefore be explained by the difference in the Fe/OC ratio for the references used for fitting. The Fe(III)-Np signal may also be slightly different than the one used for the fit due to a particle size effect. In any case, for Fe/OC = 0.02, Fe occurs at around 30% as Fe(III)-oligomers and 70% as Fe(III)-Np irrespective of the Ca/Fe ratio (Figure 2). For Fe/OC = 0.05 and 0.08, Fe is organized as Fe(III)-oligomers, Fe(III)-Np and Fh. With increasing Fe/OC and Ca/Fe, Np remains constant (around 55%) whereas oligomers amount decrease in favour of Fh until reaching a steady state at 13% Fe(III)-oligomers, 34% Fh and 53% Fe(III)-Np for Fe/OC = 0.08 and Ca/Fe 0.1. These results are in
agreement with Chen et al.18. By co-precipitating Fe(III) with OM at Fe/OC = 0.44, they
provided evidence that 72 % of Fe was organized as Fh and 28% as so-called “insoluble
Fe(III)-OM” species (described by van Schaik et al.25 as Fe trimers bound to OM).
Figure 2 – Proportion of Fe(III)-oligomers (brown), Fe(III)-Np (green) and Fh (orange) determined by LCF of the EXAFS data shown in Figure 1.
3 4 5 6 7 8 9 10 11 12 13 14 15 16 17 18 19 20 21 22 23 24 25 26 27 28 29 30 31 32 33 34 35 36 37 38 39 40 41 42 43 44 45 46 47 48 49 50 51 52 53 54 55 56 57 58 59 60
Environmental
Science:
Nano
Accepted
Manuscript
Published on 05 August 2020. Downloaded by Bibliotheque de L’Universite de Rennes I on 8/18/2020 7:49:49 AM.
View Article Online
2. Structural organization of Fe particles in the aggregates
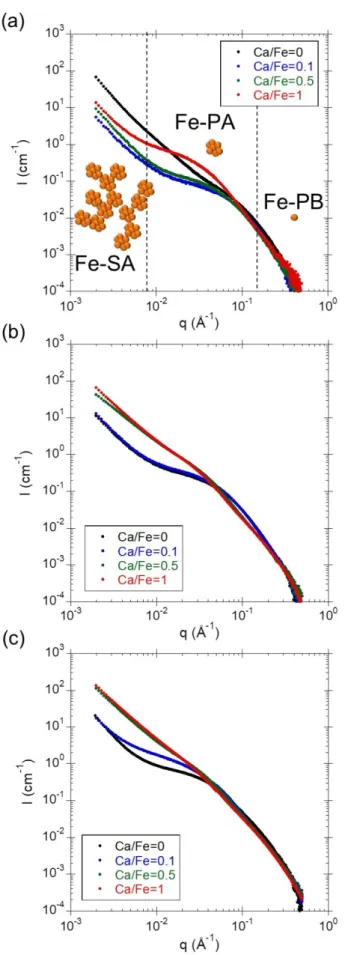
SAXS measurements are used to investigate the Fe part of Fe-OM-Ca aggregates (Figure 3). The X-ray contrast only depends on the electronic density of the element, which is significantly larger for Fe as compared to OM (the OM part is thus invisible in the scattering signal). The high q part of the scattering curve corresponds to the form factor of Fe primary beads (Fe-PB) that can be modelled with a spherical form factor with a radius equal to 0.8 nm. These Fe-PB
are consistent with the coherent scattering domains of Fh described by Michel et al.54. All
curves exhibit a shoulder between 10-2 and 10-1 Å-1 indicating a characteristic size of Fe,
corresponding to Fe primary aggregates (Fe-PA) made of Fe-PB. This shoulder shifts to the lowest q with the increasing Ca/Fe ratio, indicating that the size of the Fe-PA increases. Two different behaviours of the inflexion shape can be observed depending on the Fe/OC ratio. For Fe/OC = 0.02, the inflexion is lower without Ca than with Ca. By contrast, the increasing Ca/Fe ratio leads to the attenuation of the inflexion for Fe/OC = 0.05 and 0.08. At low q, the increase in intensity indicates the aggregation of Fe-PA as larger objects, i.e. Fe secondary aggregates (Fe-SA) for which the size cannot be determined given the limited q range.
3 4 5 6 7 8 9 10 11 12 13 14 15 16 17 18 19 20 21 22 23 24 25 26 27 28 29 30 31 32 33 34 35 36 37 38 39 40 41 42 43 44 45 46 47 48 49 50 51 52 53 54 55 56 57 58 59
Environmental
Science:
Nano
Accepted
Manuscript
Published on 05 August 2020. Downloaded by Bibliotheque de L’Universite de Rennes I on 8/18/2020 7:49:49 AM.
View Article Online
Figure 3 – SAXS curves for samples with (a) Fe/OC = 0.02, (b) Fe/OC = 0.05 and (c) Fe/OC = 0.08. In (a) Fe-PB, Fe-PA and Fe-SA are represented in their corresponding scattering domain.
3 4 5 6 7 8 9 10 11 12 13 14 15 16 17 18 19 20 21 22 23 24 25 26 27 28 29 30 31 32 33 34 35 36 37 38 39 40 41 42 43 44 45 46 47 48 49 50 51 52 53 54 55 56 57 58 59 60
Environmental
Science:
Nano
Accepted
Manuscript
Published on 05 August 2020. Downloaded by Bibliotheque de L’Universite de Rennes I on 8/18/2020 7:49:49 AM.
View Article Online
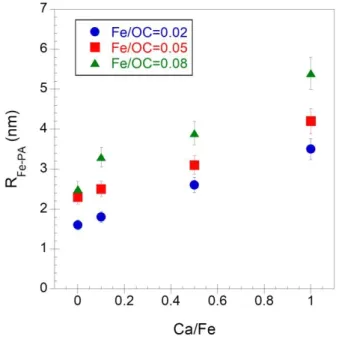
At intermediate q, the form factor of Fe-PA was extracted to determine their radius (Figure SI 4, Table SI 2 and Figure 4) which increases with the increasing Fe/OC ratio as demonstrated
by Guénet et al.13. Furthermore, the Fe-PA size also increases with the increasing Ca/Fe ratio
while their morphology remains constant as highlighted by the Fe-PA fractal dimension which is ⁓2.4 irrespective of the Fe/OC or Ca/Fe ratio (Table SI 2).
Figure 4 – Variations in the radius of the Fe primary aggregates relative to Ca/Fe for Fe/OC = 0.02 (blue circles), 0.05 (red squares) and 0.08 (green triangles).
The total structure factor (ST(q)) can be extracted by dividing the total scattering intensity by
the form factor of Fe-PA (Figure SI 5). The increase of the ST(q) intensity as a power law in the
range 8×10⁻²-1×10⁻³ Å-1 is relevant to the Fe-SA contribution. The shoulder observed between
3×10⁻¹ and 7×10⁻² Å-1 in S
T(q) indicates interactions between the Fe-PA inside the Fe-SA. This
shoulder can be used to calculate the centre-to-centre distance d0 between Fe-PA within Fe-SA
(Table 2 and Figure SI 5). For samples exhibiting the lowest Ca contents, d0 increases with
increasing Fe/OC and Ca/Fe ratios as a response to the increase in Fe-PA size since the d0 values
range from 2×RPA to 2.8×RPA. However, the key result is observed for the four samples
exhibiting the highest Ca contents for which no peak occurred, suggesting a loss of correlation
between Fe-PA in response to a longer distance between Fe-PA and/or a larger d0 dispersity.
3 4 5 6 7 8 9 10 11 12 13 14 15 16 17 18 19 20 21 22 23 24 25 26 27 28 29 30 31 32 33 34 35 36 37 38 39 40 41 42 43 44 45 46 47 48 49 50 51 52 53 54 55 56 57 58 59
Environmental
Science:
Nano
Accepted
Manuscript
Published on 05 August 2020. Downloaded by Bibliotheque de L’Universite de Rennes I on 8/18/2020 7:49:49 AM.
View Article Online
As a result, the presence of Ca leads to a long range correlation between the Fe-primary aggregates.
Table 2 – Values of the centre-to-centre distance d0 between Fe-PA. A ‘-’ is reported when the correlation peak of Fe-PA did not occur, indicating an increase in the distance between Fe-PA.
Ca/Fe d0 (nm) 0.0 0.1 0.5 1.0 Fe/OC 0.02 4.4 4.9 6.0 6.5 0.05 5.5 5.9 - -0.08 4.7 7.2 -
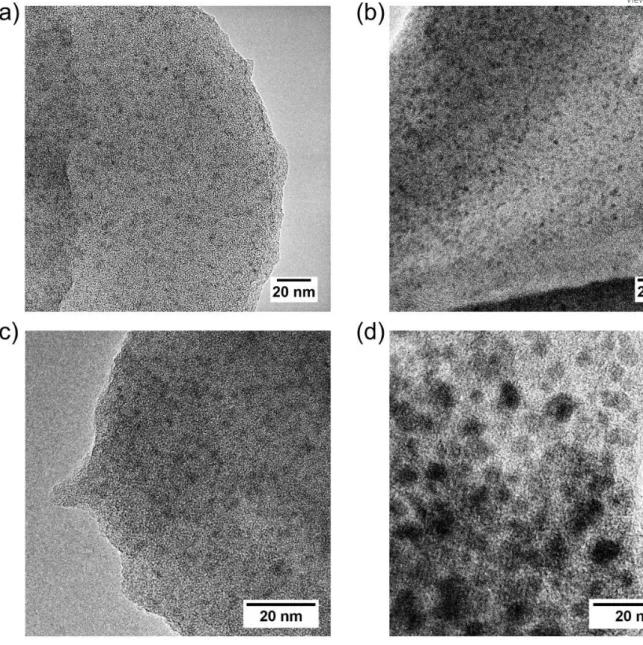
-At Fe/OC = 0.05, TEM observations showed black spherical entities (Figure 5). The XEDS analysis revealed the presence of Fe indicating that these black dots are Fe particles, as
previously observed for synthetic and natural samples3,13,55. Their compact spherical and
nanometric size (between 2 and 6 nm) is consistent with Fe-PA identified by SAXS. Moreover, their size increases with the increasing Ca/Fe ratio from ⁓ 2 nm for Ca0.0 and Fe0.05-Ca0.1 (Figure 5a and b) to ⁓ 5.5 nm for Fe0.05-Ca1.0 (Figure 5d), confirming the SAXS results. 3 4 5 6 7 8 9 10 11 12 13 14 15 16 17 18 19 20 21 22 23 24 25 26 27 28 29 30 31 32 33 34 35 36 37 38 39 40 41 42 43 44 45 46 47 48 49 50 51 52 53 54 55 56 57 58 59 60
Environmental
Science:
Nano
Accepted
Manuscript
Published on 05 August 2020. Downloaded by Bibliotheque de L’Universite de Rennes I on 8/18/2020 7:49:49 AM.
View Article Online
Figure 5 – Transmission electron microscopy images of the aggregates for Fe/OC = 0.05 and (a) Ca/Fe 0, (b) Ca/Fe 0.1, (c) Ca/Fe 0.5 and (d) Ca/Fe 1. The grey scales are arbitrary.
3. Structural arrangement of OM in the aggregates
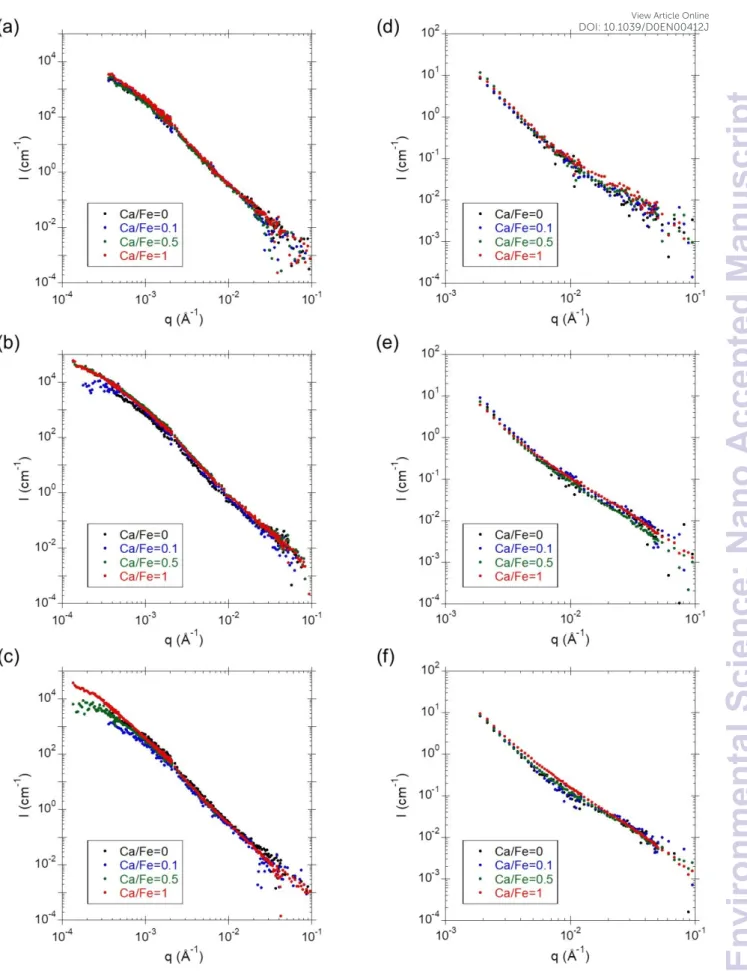
SANS measurements with a 100 % D2O contrast allowed to match the iron scattering
contribution to the signal and to access the OM part of the aggregates. For SANS curves with
100 % D2O contrast (Figure 6a,b,c), the inflexion observed for q < 10-3 Å-1 suggests a typical
size for the OM aggregates. This inflexion shifts to the lower q when increasing Ca/Fe ratio suggesting an increase of the OM size. However, these curves exhibit the same slope in the q
domain between 10-3 and 10-1 Å-1 irrespective to the Fe/OC or the Ca/Fe ratio, suggesting no
local scattering contribution from OM phases. To enforce this observation, SANS curves with
3 4 5 6 7 8 9 10 11 12 13 14 15 16 17 18 19 20 21 22 23 24 25 26 27 28 29 30 31 32 33 34 35 36 37 38 39 40 41 42 43 44 45 46 47 48 49 50 51 52 53 54 55 56 57 58 59
Environmental
Science:
Nano
Accepted
Manuscript
Published on 05 August 2020. Downloaded by Bibliotheque de L’Universite de Rennes I on 8/18/2020 7:49:49 AM.
View Article Online
50/50% H2O/D2O contrast were measured (Figure 6d,e,f). At this specific contrast, both the
contribution of OM and the Fe is visible. For q > 10-2 Å-1, this contrast can also be used to test
if another OM organization (e.g. smaller molecules than the OM aggregates) could contribute
to the signal. In the q domain between 10-3 and 10-2 Å-1, no differences were observed between
samples as all the curves exhibit the same slope. In the q domain between 10-2 and 10-1 Å-1, an
inflexion occurs for samples with the highest Ca/Fe ratios, suggesting a variation in the local organization. In this range, the SANS and SAXS curves can be superimposed showing an identical signal provided mainly by Fe-PA (Figure SI 6). This result confirms that no local modification of OM occurs as its local scattering contribution is the same irrespective of the Fe/OC and Ca/Fe ratios.
3 4 5 6 7 8 9 10 11 12 13 14 15 16 17 18 19 20 21 22 23 24 25 26 27 28 29 30 31 32 33 34 35 36 37 38 39 40 41 42 43 44 45 46 47 48 49 50 51 52 53 54 55 56 57 58 59 60
Environmental
Science:
Nano
Accepted
Manuscript
Published on 05 August 2020. Downloaded by Bibliotheque de L’Universite de Rennes I on 8/18/2020 7:49:49 AM.
View Article Online
Figure 6 – SANS curves with 100% D2O contrast for samples with a Fe/OC ratio of (a) 0.02, (b) 0.05and (c) 0.08, and with contrast at 50/50% H2O/D2O for samples with a Fe/OC ratio of (d) 0.02, (e) 0.05 and (f) 0.08. 3 4 5 6 7 8 9 10 11 12 13 14 15 16 17 18 19 20 21 22 23 24 25 26 27 28 29 30 31 32 33 34 35 36 37 38 39 40 41 42 43 44 45 46 47 48 49 50 51 52 53 54 55 56 57 58 59
Environmental
Science:
Nano
Accepted
Manuscript
Published on 05 August 2020. Downloaded by Bibliotheque de L’Universite de Rennes I on 8/18/2020 7:49:49 AM.
View Article Online
All 100% D2O contrast curves were fitted with the Guinier-Porod equation (eq. 2) (Figure SI
7). The parameters used are reported in Table SI 3. All curves exhibit a fractal dimension, Df
around 2.8, consistent with previous observations on synthetic samples13 and natural
samples56,57. However, several studies reported a D
f value for OM between 2 and 2.558–60.
Osterberg and Mortensen59 and Guénet et al.13, applied a Guinier model on natural and synthetic
aggregates at Fe/OC = 0 or 0.01, respectively to obtain a gyration radius for OM from 30 nm59
to approximately 100 nm13. The Guinier plateau tends to disappear with the increasing Fe/OC
ratio in Guénet et al.13 and Osterberg and Mortensen59. However, Diallo et al.58 did not observe
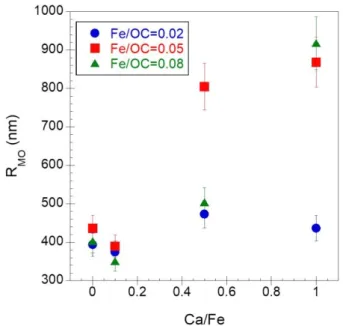
the same trend for natural aggregates. In our work, VSANS was used to reach lower q, to provide better evidence of a Guinier plateau and to calculate the typical OM size (Figure 7 and Table SI 3). The results showed an increase in OM size with the increasing Ca/Fe ratios without any local reorganization of the OM phase.
Figure 7 – Evolution of the OM radius relative to Ca/Fe ratio.
4. Calcium interaction with the aggregates
Calcium interactions with the components of the Fe-OM aggregates were characterized by collecting XAS spectra at Ca K-edge. XANES spectra exhibit a pre-edge at 4041 eV which is
assigned to the 1s→3d transition61,62 with electric dipole character when the 3d orbitals are
3 4 5 6 7 8 9 10 11 12 13 14 15 16 17 18 19 20 21 22 23 24 25 26 27 28 29 30 31 32 33 34 35 36 37 38 39 40 41 42 43 44 45 46 47 48 49 50 51 52 53 54 55 56 57 58 59 60
Environmental
Science:
Nano
Accepted
Manuscript
Published on 05 August 2020. Downloaded by Bibliotheque de L’Universite de Rennes I on 8/18/2020 7:49:49 AM.
View Article Online
hybridized with p orbitals and electric-quadrupole one (Figure 8). The 1s→3d electric dipole transition is forbidden for centrosymmetric complexes, then pre-edge structure gains only weak intensity from electric quadrupole transition. In calcite, Ca is surrounded by six O in an
octahedral geometry63 so that the intensity of its pre-edge is relatively weak. The white line at
4045 eV represents the 1s→4p transition and the resonance at 4072 eV corresponds to a KLII,III
multielectronic excitation62. Thus, according to Martin-Diaconescu et al.61, in our samples the
lack of structure in the XANES spectra and the high intensity of the pre-edge indicate that more than six O are surrounding Ca in the first coordination shell.
Figure 8 – Ca K-edge XANES spectra for sample.
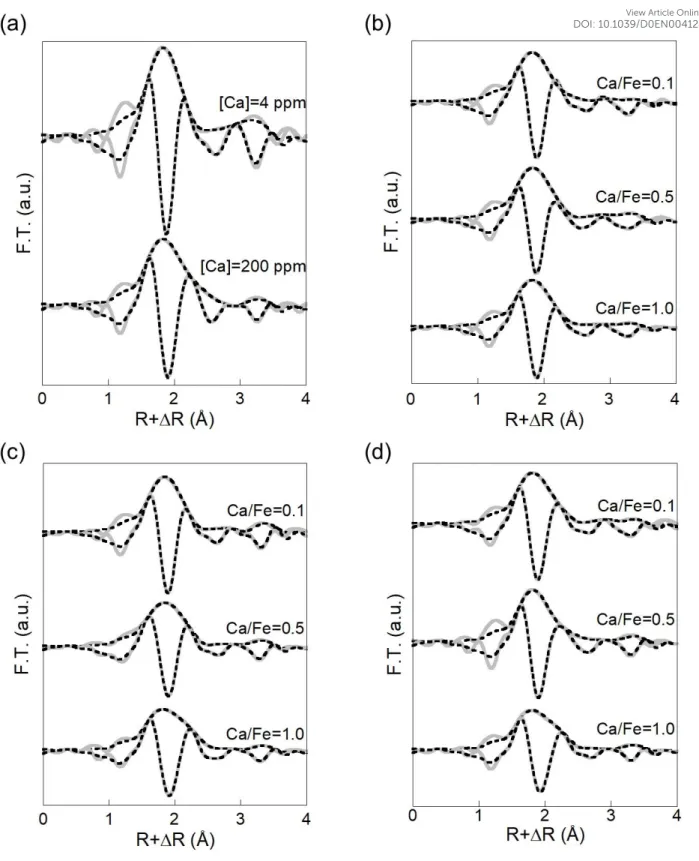
Magnitude of EXAFS Fourier transform exhibits a first intense peak at 1.8 Å corresponding to the contribution of oxygens neighbours in the first coordination shell (Figure 9). A shoulder is visible for the highest Ca content at 2.1 Å. A second weak oscillation is observable at 2.8 Å and
3 4 5 6 7 8 9 10 11 12 13 14 15 16 17 18 19 20 21 22 23 24 25 26 27 28 29 30 31 32 33 34 35 36 37 38 39 40 41 42 43 44 45 46 47 48 49 50 51 52 53 54 55 56 57 58 59
Environmental
Science:
Nano
Accepted
Manuscript
Published on 05 August 2020. Downloaded by Bibliotheque de L’Universite de Rennes I on 8/18/2020 7:49:49 AM.
View Article Online
a third more intense peak occurs at 3.3 Å, not corrected from phase shift. EXAFS spectra
(Figure SI 8) exhibit a maximum of amplitude at 4.5 Å-1. A signal shift can be observed at the
low k value for the highest Ca concentration. Two weak shoulders are also observed at 4 and 6
Å-1. Spectra were first fitted using two Ca-O distances (Ca-O1 at 2.31 Å and Ca-O2 at 2.48 Å)
for the first coordination shell of Ca that was used to reconstruct the first Fourier transform peak. The second peak was fitted with two different C as second neighbours (Ca-C1 at 3.10 Å and Ca-C2 at 3.60 Å). A contribution of Ca as third nearest neighbours at 3.85 Å was then used to fit the third peak, providing evidence of the formation of Ca dimers. The complete fit results are reported in Table 3. The detailed shell-by-shell fitting is reported in Figure SI 9.
3 4 5 6 7 8 9 10 11 12 13 14 15 16 17 18 19 20 21 22 23 24 25 26 27 28 29 30 31 32 33 34 35 36 37 38 39 40 41 42 43 44 45 46 47 48 49 50 51 52 53 54 55 56 57 58 59 60
Environmental
Science:
Nano
Accepted
Manuscript
Published on 05 August 2020. Downloaded by Bibliotheque de L’Universite de Rennes I on 8/18/2020 7:49:49 AM.
View Article Online
Figure 9 – Magnitude and imaginary part of the Fourier transform if the Ca K-edge EXAFS spectra for sample (a) without Fe, (b) Fe/OC = 0.02, (c) Fe/OC = 0.05 and (d) Fe/OC = 0.08. The grey solid lines are the
experimental data and the black dotted lines are the fit results. 3 4 5 6 7 8 9 10 11 12 13 14 15 16 17 18 19 20 21 22 23 24 25 26 27 28 29 30 31 32 33 34 35 36 37 38 39 40 41 42 43 44 45 46 47 48 49 50 51 52 53 54 55 56 57 58 59
Environmental
Science:
Nano
Accepted
Manuscript
Published on 05 August 2020. Downloaded by Bibliotheque de L’Universite de Rennes I on 8/18/2020 7:49:49 AM.
View Article Online
27
Table 3 – Ca K-edge EXAFS fit results.
Ca-O1 Ca-O2 Ca-C1 Ca-C2 Ca-Ca
Sample R-factor N R(Å) N R(Å) N R(Å) N R(Å) N R(Å) OM-[Ca]=4 ppm 0.0089 3.6 2.31 3.0 2.46 0.4 3.10 3.7 3.61 1.1 3.82 Fe0.02-Ca0.1 0.0033 3.4 2.31 3.2 2.47 0.5 3.09 2.7 3.59 0.9 3.83 Fe0.02-Ca0.5 0.0028 3.4 2.31 2.7 2.48 0.6 3.07 2.2 3.59 0.6 3.84 Fe0.02-Ca1.0 0.0029 3.1 2.31 2.8 2.47 0.6 3.09 2.0 3.58 0.6 3.82 Fe0.05-Ca0.1 0.0037 3.6 2.32 3.1 2.47 0.7 3.08 2.4 3.57 1.1 3.85 Fe0.05-Ca0.5 0.0035 2.9 2.30 3.3 2.46 0.6 3.09 2.0 3.61 0.8 3.84 Fe0.05-Ca1.0 0.0012 3.1 2.32 3.6 2.49 1.1 3.08 1.8 3.62 0.7 3.85 Fe0.08-Ca0.1 0.0024 3.6 2.31 3.3 2.48 0.6 3.10 2.6 3.60 0.8 3.85 Fe0.08-Ca0.5 0.0100 3.8 2.33 3.1 2.51 1.0 3.12 1.9 3.63 0.8 3.85 Fe0.08-Ca1.0 0.0038 3.0 2.33 3.2 2.51 0.7 3.14 1.3 3.66 0.6 3.86 OM-[Ca]=200 ppm 0.0026 3.0 2.32 3.0 2.49 1.4 3.07 1.3 3.60 0.5 3.81
The amplitude reduction factor S0² and theenergy shift parameter ∆E were respectively set to 1.00 and 4.95 eV by fitting the signal of calcite over
the range of 1.3-4 Å (the calcite fit is reported in Figure SI 10 and the corresponding fitting parameters are reported in Table SI 4). N is the coordination number and R is the interatomic distance (Å). The Debye-Weller factors σ² were fixed to 0.004 Ų to compare the evolution of each coordination number. The error on N and R are usually estimated to be ± 10% and ± 1%, respectively.
Page 28 of 42 Environmental Science: Nano
1 2 3 4 5 6 7 8 9 10 11 12 13 14 15 16 17 18 19 20 21 22 23 24 25 26 27 28 29 30 31 32 33 34 35 36 37 38 39 40 41 42 43 44 45 46 47 48 49 50 51 52 53 54 55 56 57 58
Environmental
Science:
Nano
Accepted
Manuscript
The O number in the first coordination shell remains constant at 6.5 ± 0.6 for all the samples. This result is consistent with XANES data and is representative of a Ca coordination number
higher than six for an organic Ca complex61 or hydrated soluble Ca62. In the second coordination
shell, the C number also remains constant around 2.8 ± 0.3. Carbon in the second coordination shell is characteristic of the formation of Ca-OM inner sphere complexes. The Ca number was also constant around 0.8 ± 0.1 demonstrating the formation of dimers. The Ca-Ca distance at 3.85 Å corresponds to Ca dimers bound by two O. To summarize, Ca forms dimers bound to OM as an inner sphere complex. Performing OC sorption experiments on Fh with Ca, Sowers
et al.64 suggested the formation of Fe-Ca-OC ternary complexes in which Fe was bound to Ca
via an O. The presence of the Ca-OC inner complex occurrence is consistent with Ca binding
to OM via carboxylic group as previously observed by Kalinichev and Kirkpatrick31 and
Iskrenova-Tchoukova et al.65. In their studies, binding with phenolic groups was also suggested.
However, for our experimental pH at 6.5, phenolic groups remain protonated and weakly
available for binding32. Moreover, during reduction, Adhikari et al.35 reported a higher release
and degradation of phenolic OC as compared to carboxylic OC. Here, Ca binding to carboxylic groups is therefore the more expected process and no Fe neighbour could be added in the fit of the second coordination shell of the Ca EXAFS.
5. Overall organization of Fe-OM-Ca aggregates
The overall organization of Fe-OM-Ca associations was observed by cryo-TEM (Figure 10a,b and c) and cryo-TXM imaging (Figure 10d). The cryo-TEM observation of Fe0.08-Ca0.1 (Figure 10a) exhibits dispersed black spherical entities consistent with Fe-PA described from SAXS and observed by TEM (Figure 5). The yellow arrows highlight dots showing higher Fe-PA density locally. They are embedded in a less intense background of ⁓100 nm which could be assigned to an OM aggregates. This aggregate was subjected to electron beam irradiation. During irradiation, some bubbles were formed (red arrows on Figure 10b) which indicates
3 4 5 6 7 8 9 10 11 12 13 14 15 16 17 18 19 20 21 22 23 24 25 26 27 28 29 30 31 32 33 34 35 36 37 38 39 40 41 42 43 44 45 46 47 48 49 50 51 52 53 54 55 56 57 58 59
Environmental
Science:
Nano
Accepted
Manuscript
Published on 05 August 2020. Downloaded by Bibliotheque de L’Universite de Rennes I on 8/18/2020 7:49:49 AM.
View Article Online
damaged organic compounds. Consequently, the ⁓100 nm aggregate highlighted by yellow
arrows was assigned to Fe-SA in an OM aggregate as described by Guénet et al.13. By contrast,
for higher concentrations of Ca, cryo-TEM observation of Fe0.08-Ca0.5 displays dispersed black dots embedded in a dark background (Figure 10c). These observations indicate Fe-PA embedded in an OM matrix and therefore correspond to an OM network trapping Fe-PA. The cryo-TXM observation of the same sample (Figure 10d) revealed darker features at the centre and on the right of the image, indicating the presence of OM, Ca and Fe that confirms the micrometric network formation. These results clearly provide evidence for the significant impact of Ca on Fe-OM structural organization, varying from aggregates to a micrometric network. 3 4 5 6 7 8 9 10 11 12 13 14 15 16 17 18 19 20 21 22 23 24 25 26 27 28 29 30 31 32 33 34 35 36 37 38 39 40 41 42 43 44 45 46 47 48 49 50 51 52 53 54 55 56 57 58 59 60
Environmental
Science:
Nano
Accepted
Manuscript
Published on 05 August 2020. Downloaded by Bibliotheque de L’Universite de Rennes I on 8/18/2020 7:49:49 AM.
View Article Online
Figure 10 – Cryo-TEM imaging of (a) Fe0.08-Ca0.1, (b) Fe0.08-Ca0.1 after electron beam irradiation, (c) Fe0.08-Ca0.5 and (d) cryo-TXM imaging of Fe0.08-Ca0.5. The dense part at the bottom right in (a) and (b) corresponds to the thin carbon film on the grid. The 2 µm white circles and a grey background in the top left of
(d) correspond to the holes and the carbon film on of the grid, respectively.
The formation of a micrometric network was also confirmed with filtration and ultrafiltration experiments (Table 4). For Fe0.08-Ca0.1 the presence of OM, Fe and Ca in the > 0.2 µm and 0.2 µm-30 kDa fractions demonstrated the existence of aggregates with a size < 200 nm. For Fe0.08-Ca0.5, 96 % of the OC and 100 % of the Fe is in the > 0.2µm fraction while SAXS measurements and TEM observations provided evidence of the existence of Fe-PA with a size ≈ 5 nm. These results encouraged the formation of an OM micrometric network trapping Fe-PA. 3 4 5 6 7 8 9 10 11 12 13 14 15 16 17 18 19 20 21 22 23 24 25 26 27 28 29 30 31 32 33 34 35 36 37 38 39 40 41 42 43 44 45 46 47 48 49 50 51 52 53 54 55 56 57 58 59
Environmental
Science:
Nano
Accepted
Manuscript
Published on 05 August 2020. Downloaded by Bibliotheque de L’Universite de Rennes I on 8/18/2020 7:49:49 AM.
View Article Online
Table 4 – OC, Ca and Fe concentration (mmol L-1) for Fe0.08-Ca0.1 and Fe0.08-Ca0.5. <LOD: below the limit of detection (LOD). Fe0.08-Ca0.1 Fe0.08-Ca0.5 Fractions OC Ca Fe OC Ca Fe >0.2 µm 36.5 ± 3.2 0.35 ± 0.02 3.4 ± 0.3 54.9 ± 2.1 1.2 ± 0.1 4.77 ± 0.1
0.2 µm-30 kDa 17.4 ± 3.2 0.17 ± 0.03 1.6 ± 0.3 <LOD <LOD <LOD
<30 kDa 2.3 ±0.3 0.05 ± 0.01 <LOD 2.2 ± 0.4 1.2 ± 0.1 <LOD
Fe-OM-Ca associations: from aggregates to a micrometric network
It was demonstrated that calcium controls the structural organization of the Fe-OM-Ca association through its binding to OM via carboxylic groups (COOH). It is thus appropriate to present the results depending on Ca/OC molar ratio since SANS measurements highlight a significant increase of the OM size from Ca/OC ≥ 0.026 (Figure 11). This observation is in accordance with cryo-TEM and cryo-TXM images which provide evidence of the OM micrometric network formation from Ca/OC ≥ 0.026.
Figure 11 – Evolution of the OM radius relative to Ca/OC ratio.
Fe-OM-Ca associations therefore exhibit two distinct organizations depending on the Ca/OC ratio. For Ca/OC < 0.026, Fe-OM-Ca associations are organized as aggregates. Iron exhibits a fractal organization in which Fe-PB (radius ≈ 0.8 nm) formed Fe-PA (radius ≈ 5 nm) that is
3 4 5 6 7 8 9 10 11 12 13 14 15 16 17 18 19 20 21 22 23 24 25 26 27 28 29 30 31 32 33 34 35 36 37 38 39 40 41 42 43 44 45 46 47 48 49 50 51 52 53 54 55 56 57 58 59 60
Environmental
Science:
Nano
Accepted
Manuscript
Published on 05 August 2020. Downloaded by Bibliotheque de L’Universite de Rennes I on 8/18/2020 7:49:49 AM.
View Article Online
either isolated or embedded in an OM aggregate (radius ⁓ 100 nm) resulting in the formation
of Fe-SA (radius > 100 nm), as already described13 (Figure 12, left). For Ca/OC ≥ 0.026, the
organization of the Fe-OM-Ca association is drastically different. All OM is branched out by Ca and forms a micrometric network in which all Fe-PB and Fe-PA are embedded (Figure 12, right). The presence of Ca also results in an increase in Fe-PA size from 2 nm to 5 nm. Therefore, while Ca did not directly interact with Fe, Ca atoms screen interactions between Fe and OM thereby allowing for the growth of Fe-PA. Calcium drives the organizational mechanism of OM which in turn controls the size and the distribution of Fe-PA in the OM aggregate or in the OM network. Thus, calcium drives the structural transition in this system. These significant modifications of the structural organizations modify the size of the global aggregates and their colloidal stability (Figure SI 1). For Ca/OC < 0.026, Fe-OM-Ca associations are composed of aggregates which stay in suspension and can be transported with the water flow. For Ca/OC ≥ 0.026, the formation of a micrometric network results in the settlement of Fe-OM-Ca associations and their immobilization by gravitational settling and/or
trapping the soil porous media66.
3 4 5 6 7 8 9 10 11 12 13 14 15 16 17 18 19 20 21 22 23 24 25 26 27 28 29 30 31 32 33 34 35 36 37 38 39 40 41 42 43 44 45 46 47 48 49 50 51 52 53 54 55 56 57 58 59
Environmental
Science:
Nano
Accepted
Manuscript
Published on 05 August 2020. Downloaded by Bibliotheque de L’Universite de Rennes I on 8/18/2020 7:49:49 AM.
View Article Online
33
Figure 12 – Schematic representation of the structural organization of the Fe-OM-Ca associations depending on the Ca/OC ratio.
Page 34 of 42 Environmental Science: Nano
1 2 3 4 5 6 7 8 9 10 11 12 13 14 15 16 17 18 19 20 21 22 23 24 25 26 27 28 29 30 31 32 33 34 35 36 37 38 39 40 41 42 43 44 45 46 47 48 49 50 51 52 53 54 55 56 57 58
Environmental
Science:
Nano
Accepted
Manuscript
In environmental waters, OM is known to control Fe phases by inhibiting their growth and crystallinity. Organic matter also enables the formation of complexes formed with a Fe
oligomer and its carboxylic functional group13–15,17. Given that Leonardite HA is composed of
7.46×10⁻³ mol of COOH per gram of C67, an apparent COOH concentration can be calculated
for our samples (Table 5). In Fe-OM-Ca associations, Ca is bound to OM via COOH with a COOH/Ca = 3. For Fe0.08-Ca0.1, the COOH/Ca ratio within aggregates is close to 9 and therefore some carboxylic groups remain available for the Fe phases. For Fe0.08-Ca0.5, COOH/Ca = 4.2 in the OM micrometric network. As a consequence, carboxylic groups are less available for binding the Fe species. In the OM network, Fe phases are not as covered by the organic molecule and their adsorption capacity should therefore be higher. Furthermore, for the highest Ca amounts, the Fe(III)-oligomer content decreases in favour of Fh, increasing the sorption capacities of the Fe aggregates. Conversely, the size of the nanoparticular Fe phases is
allowed to increase and nanoparticles larger than 20 nm exhibit lower adsorption capacities68.
The Fe-OM-Ca adsorption capacities could therefore be lower with increasing Ca amounts and the subsequent continuous network formation. The formation of a continuous network leads to two antagonist effects with regard to the Fe-OM-Ca adsorption capacities, which need to be investigated in further studies. In addition, the presence of Ca should impact the Fe-OM
aggregates reactivity regards bioreduction processes. Pédrot et al.17 demonstrated that the
bioreduction of Fe(III)-OM colloids was significantly faster than that of nano-Lp. They
suggested that OM acts as an electron shuttle during the reduction process. Adhikari et al.35
reported a decrease of the Fh-OM co-precipitates bioreduction rate in the presence of Ca. The partial screening of the interactions between Fe and OM evidenced in our study could explain this result: the OM, bound to Ca, could not act as electron shuttle anymore.
3 4 5 6 7 8 9 10 11 12 13 14 15 16 17 18 19 20 21 22 23 24 25 26 27 28 29 30 31 32 33 34 35 36 37 38 39 40 41 42 43 44 45 46 47 48 49 50 51 52 53 54 55 56 57 58 59
Environmental
Science:
Nano
Accepted
Manuscript
Published on 05 August 2020. Downloaded by Bibliotheque de L’Universite de Rennes I on 8/18/2020 7:49:49 AM.
View Article Online
Table 5 – Concentration of the carboxylic groups (COOH) (mol L-1) and COOH/Ca ratios for Fe0.08-Ca0.1 and Fe0.08-Ca0.5.
Fe0.08-Ca0.1 Fe0.08-Ca0.5
Fractions
COOH (mol L-1) COOH/Ca COOH (mol L-1) COOH/Ca
> 0.2 µm 3.22×10⁻³ 9.2 4.92×10⁻³ 4.2
0.2 µm-30 kDa 1.56×10⁻³ 8.7 -
-Conclusion
We demonstrated the impact of Ca on the structural organization of Fe-OM aggregates. The structural organization of Fe-OM-Ca associations is controlled by the occurrence of Ca through its binding to OM carboxylic groups. Fe-OM-Ca associations can have two distinct organizations depending on the Ca/OC ratio. For low Ca concentrations, Fe-OM-Ca associations are organized as aggregates in which Fe exhibits three aggregation levels: (i) isolated Fe primary beads bound to organic molecules, that can be aggregated as (ii) Fe primary aggregates which can themselves form (iii) Fe secondary aggregates embedded in an OM aggregate (Figure 12). A structural transition occurs with the increasing Ca/OC ratio until an OM micrometric network is formed. This structural transition is driven by Ca which mainly interacts with OM COOH sites. Calcium acts as a bridge between the organic molecules and allows the formation of a large OM network. As organic molecules are preferentially connected to each other by Ca bridges, they are less available for binding Fe which is less covered by OM, allowing for the growth of ferrihydrite-like nanoparticular structures as indicated by their size increase. The impact of Ca on the overall structural organization is of major importance regarding the increase of Ca amounts in surface waters due to the permafrost thawing, which
one is enhanced by climate change69. Moreover, the interaction of Ca with OM increases the
Fh-like binding sites availability and prevents the ability of OM to act as an electron shuttle in bioreduction processes. Finally, the Ca occurrence controls the mobility of Fe-OM aggregates and associated elements through the formation of a micrometric network.
3 4 5 6 7 8 9 10 11 12 13 14 15 16 17 18 19 20 21 22 23 24 25 26 27 28 29 30 31 32 33 34 35 36 37 38 39 40 41 42 43 44 45 46 47 48 49 50 51 52 53 54 55 56 57 58 59 60
Environmental
Science:
Nano
Accepted
Manuscript
Published on 05 August 2020. Downloaded by Bibliotheque de L’Universite de Rennes I on 8/18/2020 7:49:49 AM.
View Article Online