HAL Id: hal-02600411
https://hal.inrae.fr/hal-02600411
Submitted on 11 Dec 2020
HAL is a multi-disciplinary open access
archive for the deposit and dissemination of
sci-entific research documents, whether they are
pub-lished or not. The documents may come from
teaching and research institutions in France or
abroad, or from public or private research centers.
L’archive ouverte pluridisciplinaire HAL, est
destinée au dépôt et à la diffusion de documents
scientifiques de niveau recherche, publiés ou non,
émanant des établissements d’enseignement et de
recherche français ou étrangers, des laboratoires
publics ou privés.
characterization of natural and agricultural areas
Fabio Güttler, Dino Ienco, Maguelonne Teisseire, Jordi Nin, Pascal Poncelet
To cite this version:
Fabio Güttler, Dino Ienco, Maguelonne Teisseire, Jordi Nin, Pascal Poncelet. Towards the use of
sequential patterns for detection and characterization of natural and agricultural areas. 15th
Inter-national Conference on Information Processing and Management of Uncertainty in Knowledge-Based
Systems (IPMU), Jul 2014, Montpellier, France. pp.97-106, �10.1007/978-3-319-08795-5_11�.
�hal-02600411�
Towards the Use of Sequential Patterns for
Detection and Characterization of Natural and
Agricultural Areas
Fabio Guttler1, Dino Ienco1, Maguelonne Teisseire1, Jordi Nin2, and Pascal
Poncelet3
1 IRSTEA, UMR TETIS, Montpellier, France
{fabio.guttler,dino.ienco,maguelonne.teisseire}@teledetection.fr
2 Barcelona Supercomputing Center (BSC)
Universitat Polit`ecnica de Catalunya (BarcelonaTech), Barcelona, Catalonia, Spain nin@ac.upc.edu
3 LIRMM, CNRS, Montpellier, France
pascal.poncelet@lirmm.fr
Abstract. Nowadays, a huge amount of high resolution satellite images are freely available. Such images allow researchers in environmental sci-ences to study the di↵erent natural habitats and farming practices in a remote way. However, satellite images content strongly depends on the season of the acquisition. Due to the periodicity of natural and agricul-tural dynamics throughout seasons, sequential patterns arise as a new opportunity to model the behaviour of these environments. In this paper, we describe some preliminary results obtained with a new framework for studying spatiotemporal evolutions over natural and agricultural areas using k-partite graphs and sequential patterns extracted from segmented Landsat images.
Keywords: Temporal Patterns, Data Mining and Remote Sensing
1
Introduction
Several regions over the earth are composed of complex landscapes with regard to land cover and land use. Outside urban areas, we commonly observe mo-saics of natural, semi-natural and agricultural areas. In Europe, mapping and monitoring those areas became a major issue and several procedures have been established for guiding and controlling such tasks. With regard to natural areas we can cite the Habitats Directive (92/43/EEC) and the associated Natura 2000 network of protected sites. In this context, member states must report the con-servation status of the habitats within their territory every six years [5]. Con-cerning agriculture, Land Parcel Identification Systems (LPIS) emerged since 1992 (Council Reg. No 3508/1992). LPIS is used as a reference for annual decla-ration by farmers, for administrative and cross-checks, and on the spot controls (including control with remote sensing) [13].
The detection of natural and agricultural areas from remote sensing data is a key point for land cover mapping. Image classification is a widespread method for mapping land cover. The overall objective is to categorize all pixels in an image into land cover classes [9]. Usually, image classification is based on the di↵erential spectral response of land surfaces (radiance values recorded at pixel level). However, most of classifications are based on single image and present lot of bias in their results, or require extensive ground truth data in order to attempt a high accuracy.
Temporal pattern recognition can furnish complementary information to fea-ture identification. Actually, natural vegetation and agricultural crop present distinct evolutions during phenological cycles and growing seasons. In that light, multi-date imagery can enhance the pertinence and the accuracy of land cover de-tection. Time series analysis comprises methods for analysing temporal data [12], several images in our case, in order to extract meaningful statistics and other characteristics of the data. Temporal data allows researchers to create a data model for analysing past values and forecasting future ones [11]. Specifically, this work is focus on natural and agricultural areas modelling over time. Sequential pattern mining is the part of time series analysis concerned with finding statis-tically relevant patterns between data examples where the values are delivered in a di↵erent time moments [10].
Optical remote sensing, such as Landsat images are commonly used in envi-ronmental researches. Image processing techniques are usually grouped in Pixel based analysis or Object based image analysis (OBIA). Several time series pixel-based approaches have been proposed, but OBIA studies rarely uses multi-temporal data [12].
In this paper we combine OBIA with sequential pattern mining to create a k-partite graph to represent natural and agricultural areas. Our approach starts segmenting multi-date satellite images over a same area. From these segmen-tations, a k-partite graph is built considering objects as nodes and represent-ing object image overlap as edges. Later, in order to determine the optimum bounding box of each object and study its dynamics, we propose the creation of k-partite subgraphs. Finally, subgraphs are supplied to an expert in order to be categorized.
1.1 Paper Organisation
This paper is organised as follows: Firstly, we introduce some concepts about optical remote sensing in Section 2. Section 3 describes k-partite graphs and sequential pattern representation. Our technique to maximise image coverage is introduced in Section 4. Experimental findings about agricultural and natural areas are depicted in Section 5. Section 6 concludes and draws future works.
2
Remote Sensing Satellite Images
In general we talk about remote sensing when the acquisition of data is done without making any physical contact. This is the case of Earth observation
plat-Title Suppressed Due to Excessive Length 3
forms such as Landsat. The optical sensors onboard Landsat acquires multispec-tral images (composed by multiple bands), each band representing a portion of the electro-magnetic spectrum. For this study, we used Landsat Thematic Map-per (TM) images without the thermal band. Remote sensing images are usually characterized by di↵erent resolutions and other technical characteristics, in our case they are as follows:
– Spatial resolution. The size of a pixel in a raster image is 30x30 meters. – Spectral resolution. The spectral bands are six: blue, green, red, near
infrared (NIR) and two parts of short wavelength infrared (SWIR-1 and 2). – Radiometric resolution. The sensor is able to distinguish is 256 intensities
of radiation (8 bits).
– Swath width. The scene size is a ground square of about 185 x 185 km.
Apart from these parameters another important issue in time-series studies is the frequency of revisits by the satellite. The revisit time of Landsat is of 16 days, but in practice the number of useful images is lower, mostly due to unsuitable whether conditions during satellite acquisition. For this study, we selected six images covering of the same geographic area (the Natura 2000 Lower Aude Valley site, located in south of France) between February and September 2009.
To avoid errors and misplacement over time, all images were already georef-erenced, as well as radiometrically and atmospherically corrected by CESBIO-CNES [6]. Additional fine spatial positioning corrections were applied in order to keep the spatial shift between all the time stamps less than one pixel.
2.1 Segmentation
Image segmentation is a fundamental step in OBIA and its consists in merging pixels into objects clusters [3]. Objects (or segments) are regions generated by one or more criteria of homogeneity in one or more dimensions of a feature space [4]. The aim of segmentation is to create a new representation of the image more meaningful and easier to analyse. This approach is similar to human visual interpretation of digital images, which works at multiple scales and uses colour, shape, size, texture, pattern and context information [9].
Image segmentation results in a set of objects that collectively cover the entire image without any overlapping. With respect to the homogeneity crite-ria, adjacent objects are expected to be significantly di↵erent between them. In this work we use the software eCognition Developer 8.8.1 for image segmentation (multiresolution segmentation algorithm). Only the pixels within the boundaries of the Lower Aude Valley Natura 2000 site (4,842 ha) were used for segmentation and further processing steps. Nine raster layers (radiometric or ’colour’ informa-tion) were used simultaneously for image segmentation. Six of them correspond to the Landsat spectral bands and the other are spectral indices. Spectral in-dices are commonly used in remote sensing as they can be helpful for detecting and characterizing some specific features, like vegetation, soil, water, etc. We used the Normalized Di↵erence Vegetation Index (NDVI) [8], the Normalized
Fig. 1. Segmentation example representing the time stamp of 10 July 2009.
0 5 km Mediterranean Sea
Lower Aude Valley Natura 2000 site
Di↵erence Water Index (NDWI) [7] and the Visible and Shortwave Infrared Drought Index (VSDI) [14]. In order to obtain objects of interest related to natural and agricultural areas, we conceived a segmentation rule-set composed of 3 main steps:
1. Medium-coarse segmentation to delineate general zones (colour and shape components combined but “color > shape”): about 170-200 objects
2. Very fine segmentation focused on colour component: about 6,000 objects 3. Medium-fine segmentation with balanced weights for colour and shape
com-ponents: about 500-600 objects
This process was independently applied for each Landsat image. The last segmentation level (3) was then exported from each time-stamp and used as input for the subsequent processing steps. Figure 1 illustrates the segmentation layer obtained for the time stamp of 10 July 2009.
3
Sequential Patterns and k-partite Graphs
This section describes the traditional sequential pattern mining problem and high-lights the need for a specific way to handle remote sensing temporal infor-mation by using k-partite graphs.
3.1 k-partite Graphs
A k-partite graph is a graph G = (V, E) with vertex set V and edge set E, whose graph vertices V can be partitioned into k disjoint sets Vk so that no two
vertices within the same set are adjacent. In this work, we assume that any edge eij has a weigh equal to wij where i and j correspond to two vertexes vi 2 Vi
Title Suppressed Due to Excessive Length 5
3.2 Sequential Patterns
Sequential patterns were introduced in [2] and in general, they are considered as an extension of the concept of frequent itemset [1] having timestamps associated to items. Sequential pattern mining aims at extracting sets of items commonly associated over time.
The problem of generating and mining sequential patterns as a n-bipartite graph is defined as follows.
Let X be a set of distinct items. An itemset is a subset of items, denoted by I = (i1, i2, . . . , in), for 1 j n, ij 2 X. A k-partite graph is built as an
ordered list of itemsets, denoted by hI1, I2, . . . , Iki, where Ii 2 X for 1 i n
and correspond with each Vi nodes set.
Once graph nodes are defined, it is required to define the edges and their corresponding weights. To do that, a function f (Ii, Ij) = wij is defined, if
f (Ii, Ij) < 0 it means that there is one edge between a pair of nodes vi and
Vj with weight equal to wij.
3.3 Representation of natural and agricultural areas
In order to represent natural and agricultural area evolutions over time, it is proposed to create a sequential pattern by using a k-partite graph representation in the following way:
1. Segmented images are the di↵erent itemsets hI1, I2, . . . , Iki, note that, the
image timestamp provide us the temporal information for creating the dif-ferent nodes sets and therefore the k-partite graph.
2. Objects extracted from the segmented images allow us to generate the items ilof each itemset Ij.
3. To create the edges, the function f (Ii, Ij) =|pil\ pil+1|/|pil[ pil+1| is
cal-culated, where pil stands for the list of pixels of the item il.
Within this global k-partite graph, it is possible to extract a concrete area of interest evolution creating a sub-graph chosen one or more items. All this process is illustrated in Figure 2.
4
Coverage Algorithm
In this paper we have implemented the following algorithm to (completely) cover one region of interest with sequential patterns: firstly, we detect the previously unprocessed areas of the image where frequent changes in the pixel values are produced. After that, we select from the first image the objects included in the previously selected image area. Later, we generate a sequential pattern and mark this part of the image as processed and recompute object variability. The algorithm stops when the region of interest has been completely processed.
Specifically, we implemented the above coverage algorithm as it is described in Algorithm 1. Firstly, we create a bounding box list containing all the objects
Fig. 2. Overall Sequential Patterns Extraction Process. Preprocessing – data standardization (spatial subset, positioning correction, spectral indexes, …) Segmentation and object features calculation (same rule-set of multiresolution segmentation by temporal layer) Bounding box selection (a set of objects is selected to constraint the spatial extent of the
graphs) Subgraphs and patterns (objects are converted into nodes of graphs) T0 T1 Tn …
Algorithm 1: BoundingBox Selection
Data: g: main graph Result: p: patterns list 1 begin
2 bbList = new BBList;
3 foreach layer l2 g do
4 foreach node n2 l do
5 bb = new bb(n, l, importance(n));
6 bbList = bbList[ bb;
7 while !empty(bbList) do
/* 1. Find the corresponding objects in Layer 0 for the most important bounding box */
8 box = bbList.M ostImportant();
9 n0 = g.getN odesByBB(0, box);
/* 2. Create the pattern for the selected object with the selected bounding box computing the overlap always
with the selected nodes in Layer 0 */
10 p = p[ newP attern(n0, box);
/* 3. Remove all the objects contained in the patterns from the importance of the BB */
11 bbList.updateImportance(p);
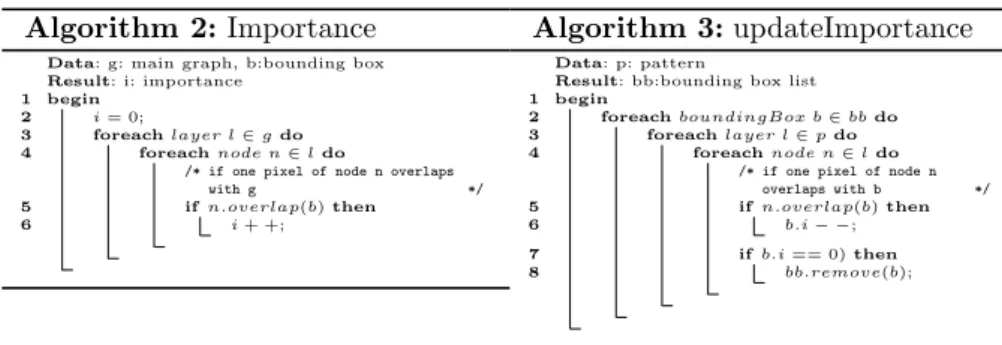
of all the images (lines 2-5), at the same time, we compute the variability of each bounding box (object). Bounding box importance is the amount of other objects overlapping with at least one pixel with the current bounding box, this computation is described in Algorithm 2.
Once the bounding box list is created, all objects are ranked with regards their importance. The importance of a bounding box corresponds with the num-ber of objects in any layer overlapping with at least one pixel with the bounding box. After that, the most important bounding box is selected (line 7) and re-cover the objects overlapping with such bounding box in the first image (line 8). Then, a new pattern is generated as it is described in Section 3.2 (line 9). After that, we update bounding boxes importance, subtracting the processed objects from the importance of each bounding box, if bounding box importance is equal to 0, it is removed from the list (Algorithm 3). This loop is repeated until the bounding box list is empty.
Title Suppressed Due to Excessive Length 7
Algorithm 2: Importance
Data: g: main graph, b:bounding box Result: i: importance
1 begin
2 i = 0;
3 foreach layer l2 g do
4 foreach node n2 l do
/* if one pixel of node n overlaps
with g */
5 if n.overlap(b) then
6 i + +;
Algorithm 3: updateImportance
Data: p: pattern
Result: bb:bounding box list 1 begin
2 foreach boundingBox b2 bb do
3 foreach layer l2 p do
4 foreach node n2 l do
/* if one pixel of node n
overlaps with b */
5 if n.overlap(b) then
6 b.i ;
7 if b.i == 0) then
8 bb.remove(b);
Figure 3 shows the obtained coverage within the perimeter of our study area. Each polygon represents the spatial extent of a specific bounding box, what means that the associated pattern has a bigger spatial coverage taking into account all temporal layers. Polygon color indicates from which time stamp the bounding box was extracted (as assigned on the legend). In total 331 bounding box were selected (about 50 - 60 per timestamp), it corresponds to an overall coverage of 93.56% of the study area.
Fig. 3. Obtained spatial coverage.
0 5 km
Mediterranean Sea Selected bounding box
Colour represents time stamp as follows: T0 T1 T2 T3 T4 T5
5
Experiments
In order to evaluate the pertinence of our approach, graphical results were an-alyzed by a remote sensing expert with field knowledge of the study area. For this analysis, all subgraphs (331 in total) were plotted with an associated unique ID allowing to locate each bounding box in an Geographic Information System (GIS). The expert preselected (without taking into account subgraph results)
about 20 regions of interest (ROI) containing both natural and agricultural ar-eas. Then, the subgraphs corresponding to this set of ROI were identified and an-alyzed. The following subsection details the main di↵erences between the graphs representing spatio-temporal evolutions of agricultural and natural areas within our study area.
5.1 Pattern analysis examples
Fig. 4. Temporal Pattern examples: Agricultural area (subgraph 1) and Natural area (subgraph 2) T0 T1 T2 T3 T4 T5 183 212 264 264 269 248 266 190 227 245 229 87 53 62 50 71 68 41 71 87 76 50 94 100 62 100 94 103 115 98 72 89 75 91 107 98 74 89 87 101 53 subgraph 1 subgraph 2
Agricultural area. In general, agricultural areas present less complex sub-graphs as the fields are usually rectangular and the boundaries of the objects remain very similar from one time stamp to the next one. Even if subgraph structure is quite simple (i.e. Figure 4 - subgraph 1), radiometric information varies sharply throughout the time series. Subgraph 1 (Figure 4) illustrates the temporal pattern of a winter culture (cereal crop in this example). The parcel presents an important augmentation of the NDVI from late winter up to spring, which corresponds to the growing season. The crop is harvest in late spring or early summer, generating a brutal change in the spectral response (between T2 and T3). Afterwards, the field is characterized by bare soil, which remains globally stable until the end of the time series.
Title Suppressed Due to Excessive Length 9
Natural area. In natural areas the boundaries are usually much smoother than in agricultural fields and the objects rarely have rectangular shapes. As a consequence, graph structure tends to be more complex and can englobe several objects per layer. Such kind of graph can also show some drastic radiometric changes, but in general it concerns only a small portion of the area covered by the bounding box. In other words, natural habitats are characterized by more gradual and smoothed evolutions. Subgraph 2 of figure 4 illustrates the temporal pattern of a temporary lake. Usually flooded during winter and spring, this lake becomes progressively dry starting from early summer. Aquatic natural habitat is gradually replaced by some pioneer terrestrial communities, dominated by annual Salicornia sp. or Suaeda sp. Depending mainly on the local variations of soil salinity, the vegetation will cover the former flooded area in di↵erent ways. First developments of such particular habitats can be detected since T2 and they should subsist up to the next flood event (usually during late autumn or winter).
5.2 Discussion
Throughout one year, spatio-temporal evolutions of agricultural and natural ar-eas are enough dissimilar and it is possible to an expert to separate them by analysing the time series of satellite images. In a more automatic way, the sub-graphs generated by our approach synthesizes complex spatio-temporal evolu-tions and can be useful for this kind of time-consuming task. Actually, subgraph structure associated to temporal behaviour of object’s radiometry provides com-plementary and pertinent information allowing detailed analysis.
At this stage, our coverage algorithm is not able to cover 100% of the study area throughout the time series. Most of times, small objects are not included in the subgraphs. However, this issue should be improved as the spatial gaps concerns sometimes also medium-size objects representing interesting natural or agricultural areas. Another point to improve is spatial redundancy. We verified that some subgraphs presents high rates of similar objects, what means that the same area is covered by more than one subgraph. Improving the bounding box selection should reduce such spatial redundancy.
6
Conclusions
In this paper we have described a complete framework for studying evolving natural and agricultural areas using satellite images information and k-partite graph sequential patterns. We have shown that using our approach is possible to cover a great part of the study area (93.56%) and to analyze in detail a concrete region of interest. We have also verified with one domain expert that the obtained sequential patterns are meaningful. As a future work, we would like to develop some clustering algorithms for k-partite graphs to help the expert to post-process the results providing some groups of patterns with similar behaviour, instead of individuals patterns without relation among them.
Acknowledgments. This work was supported by public funds received in the framework of GEOSUD, a project (ANR-10-EQPX-20) of the program ”In-vestissements d’Avenir” managed by the French National Research Agency. This work was also partially supported by the Ministry of Science and Technology of Spain under contract TIN2012-34557 and by the BSC-CNS Severo Ochoa pro-gram (SEV-2011-00067).
References
1. R. Agrawal, R. Imielinski, and A. Swami. Mining association rules between sets of items in large databases. SIGMOD Records, 22(2):207–216, 1993.
2. R. Agrawal and R. Srikant. Mining sequential patterns. In ICDE, 1995.
3. M. Baatz, C. Ho↵mann, and G. Willhauck. Progressing from based to object-oriented image analysis, chapter 2, pages 29–42. Lecture Notes in Geoinformation and Cartography. Springer Berlin Heidelberg, 2008.
4. T. Blaschke. Object based image analysis for remote sensing. ISPRS J. of Pho-togram. and Rem. Sensing, 65(1):2–16, 2010.
5. J. Vanden Borre, D. Paelinckx, C.A. M¨ucher, L. Kooistra, B. Haest, G. De Blust, and A. M. Schmidt. Integrating remote sensing in natura 2000 habitat monitoring: Prospects on the way forward. J. for Nat. Conservation, 19(2):116–125, 2011. 6. O. Hagolle and M. Huc. S´eries temporelles de produits landsat de niveau 2a:
Manuel de l’utilisateur des donn´ees produites au cesbio, 2011.
7. T.J. Jackson, D. Chen, M. Cosh, F. Li, M. Anderson, C. Walthall, P. Doriaswamy, and E. Hunt. Vegetation water content mapping using landsat data derived normal-ized di↵erence water index for corn and soybeans. Remote Sensing of Environment, 92(4):475–482, 2004.
8. JW. Rouse Jr, RH. Haas, JA. Schell, and DW. Deering. Monitoring vegetation systems in the great plains with erts. NASA special publication, 351:309, 1974. 9. T. M. Lillesand. Remote Sens. and Image Interpret. John Wiley & Sons, 2006. 10. J. Nin, A. Laurent, and P. Poncelet. Speed up gradual rule mining from stream
data! a b-tree and owa-based approach. JIIS, 35(3):447–463, 2010.
11. J. Nin and V. Torra. Towards the evaluation of time series protection methods. Information Sciences, 29(11):1663–1677, 2009.
12. F. Petitjean, C. Kurtz, N. Passat, and P. Gan¸carski. Spatio-temporal reasoning for the classification of satellite image time series. Pattern Recognition Letters, 33(13):1805–1815, 2012.
13. P. Troj´aˇcek and R. Kadlubiec. Detailed mapping of agricultural plots using satellite images and aerial orthophoto maps. 2004.
14. N. Zhang, Y. Hong, Q. Qin, and L. Liu. Vsdi: a visible and shortwave infrared drought index for monitoring soil and vegetation moisture based on optical remote sensing. Int. J. of Rem. Sensing, 34(13):4585–4609, 2013.
View publication stats View publication stats