arXiv:1205.3130v3 [hep-ex] 23 Oct 2012
EUROPEAN ORGANISATION FOR NUCLEAR RESEARCH (CERN)
CERN-PH-EP-2012-082
Published in: Physics Letters B 717 (2012) 330-350
Measurement of the t-channel single top-quark production cross
section in pp collisions at
√ s = 7
TeV with the ATLAS detector
The ATLAS Collaboration
Abstract
We report a measurement of the cross section of single top-quark production in the
t
-channel
using 1.04 fb
−1of
pp
collision data at
√
s = 7 TeV
recorded with the ATLAS detector at the LHC.
Selected events feature one electron or muon, missing transverse momentum, and two or three jets,
exactly one of them identified as originating from a
b
quark. The cross section is measured by fitting
the distribution of a multivariate discriminant constructed with a neural network, yielding
σ
t= 83 ±
4 (stat.)
+20−19
(syst.) pb
, which is in good agreement with the prediction of the Standard Model. Using the
ratio of the measured to the theoretically predicted cross section and assuming that the
top-quark-related CKM matrix elements obey the relation
|V
tb| ≫ |V
ts|, |V
td|
, the coupling strength at the
W
-
t
-
b
vertex is determined to be
|V
tb| = 1.13
+0.14−0.13. If it is assumed that
|V
tb| ≤ 1
a lower limit of
|V
tb| > 0.75
is
Measurement of the t-channel single top-quark production cross section in pp
collisions at
√
s = 7 TeV with the ATLAS detector
The ATLAS Collaboration
Abstract
We report a measurement of the cross section of single top-quark production in the t-channel using 1.04 fb−1of pp
collision data at √s = 7 TeV recorded with the ATLAS detector at the LHC. Selected events feature one electron or muon, missing transverse momentum, and two or three jets, exactly one of them identified as originating from a b quark. The cross section is measured by fitting the distribution of a multivariate discriminant constructed with a neural network, yielding σt = 83 ± 4 (stat.)+20−19(syst.) pb, which is in good agreement with the prediction of the
Standard Model. Using the ratio of the measured to the theoretically predicted cross section and assuming that the top-quark-related CKM matrix elements obey the relation |Vtb| ≫ |Vts|, |Vtd|, the coupling strength at the W-t-b vertex
is determined to be |Vtb| = 1.13+0.14−0.13. If it is assumed that |Vtb| ≤ 1 a lower limit of |Vtb| > 0.75 is obtained at the 95%
confidence level.
1. Introduction
At hadron colliders top quarks are predomi-nantly produced in pairs (top-antitop) via the flavour-conserving strong interaction. Alternative production modes proceed via the weak interaction involving a W-t-b vertex, leading to a single top-quark intermediate state. Three subprocesses contribute to single top-quark production: the exchange of a virtual W boson in the t-channel, or in the s-channel, and the associated pro-duction of a top quark and an on-shell W boson. The process with the highest cross section at the Tevatron and at the LHC is the t-channel mode q + b → q′+ t.
In 2009, single top-quark production was observed by the CDF [1] and DØ [2] Collaborations based on analyses counting the t-channel and s-channel processes as signal. The observation of the t-channel production mode has also been recently reported by DØ [3], while the CMS Collaboration has published evidence of this process at the LHC [4].
The single top-quark final state provides a direct probe of the W-t-b coupling and is sensitive to many models of new physics [5]. The measurement of the production cross section constrains the absolute value of the quark-mixing matrix element Vtb[6, 7] without
as-sumptions about the number of quark generations (see Ref. [8] for a recent measurement from the DØ Col-laboration). Alternatively, it allows the b-quark parton distribution function (PDF) to be measured.
At the LHC, colliding protons at √s = 7 TeV, the sum of t and ¯t cross sections is predicted to be: σt =
64.6+2.7
−2.0pb [9] for the leading t-channel process, σWt =
15.7 ± 1.1 pb [10] for Wt associated production, and
σs = 4.6 ± 0.2 pb [11] for the s-channel. The analyses
presented in this Letter consider only the t-channel cess as signal, while the other two single top-quark pro-cesses are treated as backgrounds, assuming the Stan-dard Model (SM) theoretical cross sections for these processes.
The W boson from the top-quark decay is recon-structed in its leptonic decay modes eν, µν or τν, where the τ decays leptonically. Thus, selected events con-tain one charged lepton candidate, e or µ; two or three hadronic high-pTjets; and missing transverse
momen-tum EmissT . Two jets are expected from the leading-order (LO) process, while a third jet may arise from higher-order processes. Exactly one of the jets is required to be identified as originating from a b-quark.
The measurement of σt is based on a fit to a
multi-variate discriminant constructed with a neural network (NN) to separate signal from background and the result is cross-checked using a cut-based method, which ad-ditionally provides a breakdown for the t and ¯t cross sections.
2. Data and simulated event samples
The analyses described in this Letter use proton-proton LHC collision data at a centre-of-mass energy of 7 TeV collected with the ATLAS detector [12] be-tween March and June 2011. The selected events were recorded based on single electron and muon triggers. Stringent detector and data quality requirements are ap-plied, resulting in a data set corresponding to an inte-grated luminosity of 1.04 ± 0.04 fb−1[13, 14].
Samples of simulated events for all three single top-quark processes are produced with the AcerMC pro-gram (version 3.7) [15] using MRST 2007LO∗ parton
distribution functions (PDFs) [16]. The computation of the t-channel single top-quark process in AcerMC in-corporates the q+b → q′+t and q+g → q′+t+ ¯b
subpro-cesses and features an automated procedure to remove the overlap in phase space between them [17]. Sam-ples of the top-quark pair (t¯t) process are generated us-ing MC@NLO (version 3.41) [18], with the CTEQ6.6 set of PDFs [19]. The top-quark mass is assumed to be 172.5 GeV. Generator default values of 0.999105 and 0.999152 are used for |Vtb| to produce the AcerMC
and MC@NLO samples, respectively. At higher orders in perturbation theory, interference effects between the single-top Wt channel and t¯t processes occur, but are found to be small [20] and can therefore be safely ne-glected. The ALPGEN leading-order generator (version 2.13) [21] and the CTEQ6L1 set of PDFs [19] are used to generate W+jets, Wb ¯b, Wc¯c, Wc and Z+jets events with up to five additional partons. To remove overlaps between the n and n + 1 parton samples the “MLM” matching scheme [21] is used. The double count-ing between the inclusive W + n parton samples and samples with associated heavy-quark pair-production is removed utilising an overlap removal based on a
∆R = p(∆η)2+ (∆φ)2 matching1. The diboson
pro-cesses WW, WZ and ZZ are generated using HERWIG (version 6.5.20) [22]. For all single top-quark sam-ples the hadronisation is performed by PYTHIA (ver-sion 6.4.25) [23]; in all other cases HERWIG in con-nection with the JIMMY [24] underlying event model (version 4.31) is used. After the event generation, all samples are passed through the full simulation of the ATLAS detector [25] based on GEANT4 [26] and are then reconstructed using the same procedure as for col-lision data. The simulation includes the effect of mul-tiple pp collisions per bunch crossing and is weighted to the same distribution as observed in the data with 5.6 interactions per bunch crossing on average.
3. Object definition and event selection
Electron candidates are reconstructed offline using a cluster-based algorithm and are required to have ET >
25 GeV and |ηcl| < 2.47, where ηcl denotes the
pseudo-rapidity of the calorimeter cluster. Clusters in the transi-tion regions between the calorimeter barrel and endcaps,
1ATLAS uses a right-handed coordinate system with its origin at
the nominal interaction point in the centre of the detector and the z-axis along the beam direction. The x-z-axis points towards the centre of the LHC ring, the y-axis points upwards. The pseudorapidity is defined in terms of the polar angle θ as η = − ln tan(θ/2).
corresponding to 1.37 < |ηcl| < 1.52, are ignored.
High-quality electron candidates are selected using a set of cuts [27] which include stringent requirements on the matching between the track and the calorimeter clus-ter. Electrons must also be isolated: the sum of the calorimeter transverse energy within a cone of radius
∆R = 0.3 (excluding the cells associated with the
elec-tron) must be less than 15% of the electron ET, and the
pTof all tracks within the same cone radius around the
electron direction, again excluding the track associated to the electron, must be less than 10% of the electron ET.
Muon candidates are reconstructed by combining track segments found in the inner detector and in the muon spectrometer. We only consider muon candidates that have pT > 25 GeV and |η| < 2.5. Selected muons
must additionally satisfy a series of cuts on the num-ber of track hits present in the various tracking sub-detectors [28]. Muon candidates are required to be iso-lated using the equivalent criteria as applied to electron candidates.
Jets are reconstructed using the anti-ktalgorithm [29]
with a radius parameter of 0.4, using clusters of adja-cent calorimeter cells [30] as inputs to the jet cluster-ing. The response of the calorimeter is corrected by pT- and η-dependent factors [31], which are applied
to each jet to provide an average energy scale correc-tion. Jets overlapping with selected electron candidates within ∆R < 0.2 are removed, as in these cases the jet and the electron are very likely to correspond to the same physics object. Only jets having pT > 25 GeV
and |η| < 4.5 are considered. Jets originating from bot-tom quarks are tagged in the region |η| < 2.5 by recon-structing secondary and tertiary vertices from the tracks associated with each jet and combining lifetime-related information with a NN [32]. A threshold is applied to the tagging algorithm output corresponding to a b-tagging efficiency of about 57% and a light-quark jet rejection factor (the reciprocal of the efficiency to b-tag light quarks) of about 520 for jets in t¯t events. The Emiss
T
is calculated using clusters of adjacent calorimeter cells and corrected for the presence of electrons, muons, and jets [33].
Events are selected if they contain at least one good primary vertex candidate [34] with a minimum of five associated tracks each with pT >400 MeV. Events
con-taining jets failing quality criteria [35] are rejected. The event selection requires exactly one charged lep-ton, e or µ, exactly two or three jets, and Emiss
T >
25 GeV. A trigger matching requirement is applied where the lepton must lie within ∆R < 0.15 of its trigger-level object. Since the multijet background is
difficult to model precisely, its contribution is addition-ally reduced through a requirement on the transverse mass of the lepton-Emiss
T system
2: m
T(W) > (60 GeV −
Emiss T ) [36].
The following samples are defined for this analysis: a “b-tagged sample” with two jets or three jets, exactly one of which is b-tagged, and a “pretag sample” with two or three jets, without making any b-tagging require-ment. We also use a sample containing exactly one b-tagged jet to estimate the W+jets flavour composition.
4. Background estimation
A large background to the single top-quark final state comes from QCD-produced multijet events in which ei-ther one of the jets is misidentified as an isolated lep-ton or a non-prompt leplep-ton (for example from a b-quark semileptonic decay) appears isolated. Other significant backgrounds originate from W-boson production in as-sociation with jets and t¯t production. Smaller back-grounds come from Z+jets, Wt-channel and s-channel single top-quark production, and diboson production. These smaller backgrounds and the t¯t background are normalised to their theoretical predictions. For Z+jets background the inclusive cross sections are calculated to next-to-next-to-leading order (NNLO) with FEWZ (ver-sion from March 15, 2009) [37]. The diboson cross sec-tions are normalised to next-to-leading order theoretical calculations [38]. The t¯t cross section is normalised to the approximate NNLO-predicted value obtained using HATHOR (version 1.2) [39].
The multijet background normalisation is obtained using a binned maximum-likelihood fit to the EmissT dis-tribution in the data, before the application of the EmissT cut, using a data-derived template for the multi-jet background and templates from Monte-Carlo simu-lation for all other processes (top quark, W/Z+jets, di-bosons). The multijet template is created using collision events that are triggered by a single low-pT jet.
Sev-eral prescaled trigger streams with different pT
thresh-olds are used for that purpose. In the offline selection of these events the electron requirement is replaced by a jet requirement (jet-electron model). This jet must have pT >25 GeV, the same acceptance in |η| as the signal
electron, and (80–95)% of the jet energy deposited in the electromagnetic section of the calorimeter. The last requirement ensures the orthogonality of the jet-electron
2Defined as
mT(W) =
q
(pT(ℓ) + EmissT )2− (px(ℓ) + Exmiss)2− (py(ℓ) + Emissy )2,
where ℓ denotes the lepton.
data set to the sample of events with electron candidates which feature an electromagnetic energy fraction larger than 95%. The jet must also contain at least four tracks, thus reducing the contribution from converted photons. When selecting the jet-electron sample, events contain-ing electron or muon candidates in addition to the jet-electron are vetoed. The same model is also used in the muon channel. A systematic uncertainty of 50% on the multijet background rates was estimated by study-ing the impact of pile-up events on the fit results and by performing likelihood fits on the mT(W) distribution.
The jet-electron model is also used to model the shape of kinematic distributions of the multijet background.
The kinematic distributions of the W+jets back-ground, which comprises contributions from W+heavy flavour jets (Wb ¯b+jets, Wc¯c+jets and Wc+jets) and W+light jets, are taken from samples of simulated events, while the normalisation of the flavour compo-sition is derived from data. The NN analysis simultane-ously determines the normalisation of the W+light jets and W+ heavy flavour processes when fitting the NN discriminant distribution to measure the t-channel sin-gle top-quark rate. The cut-based analysis derives nor-malisation factors for the W+jets processes using the event yields in the 1-jet b-tagged, 2-jet pretag, and 2-jet b-tagged sample, excluding events selected by the cuts defined in Section 5. Since the 2-jet b-tagged sample includes some t-channel signal events, despite requiring that the events fail the selection of the cut-based anal-ysis, an uncertainty of 100% on the expected t-channel single top-quark rate is assumed in this normalisation procedure. Both estimates of the W+jets backgrounds, the one of the NN analysis and the one of the cut-based analysis, are in very good agreement with each other.
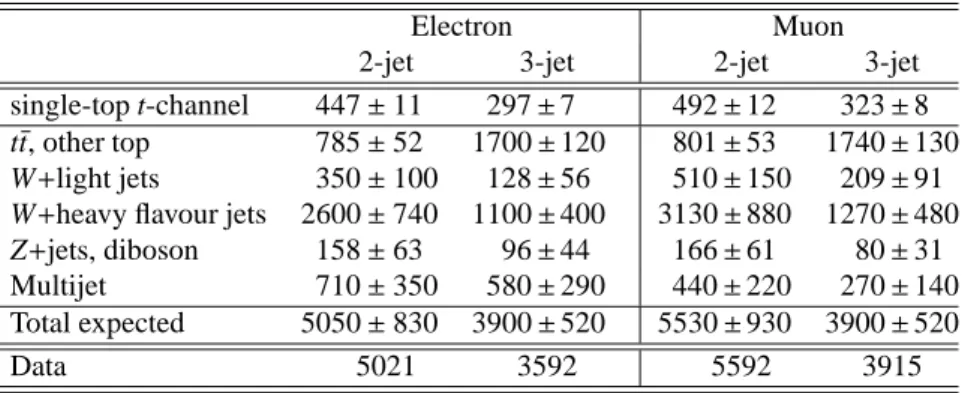
The predicted and observed event yields, after the ap-plication of the selections described in Section 3, are given in Table 1, separately for the electron and muon channels, in the 2-jet and 3-jet b-tagged samples. For the purpose of this table and the histograms of kine-matic distributions the contributions of the t¯t, Wt and s-channel processes have been grouped together into one category called “t¯t, other top”. In the subsequent analy-sis the electron and muon channels are combined.
5. Signal and background discrimination
To separate t-channel single top-quark signal events from background several kinematic variables are com-bined into one discriminant by employing a NN, that also exploits correlations between the variables. The re-sult of the NN analysis is corroborated by a cut-based
Table 1: Predicted and observed event yields, after selection, in the electron and muon 2-jet and 3-jet b-tagged samples. The multijet event yields are determined with data-driven technique. Contributions from W+jets events are normalised to observed data in control regions as used in the cut-based analysis. The uncertainties on the multijet and the W+jets yields are also estimated from data (see Section 6). All other backgrounds and the t-channel signal expectation are normalised to theoretical cross sections. Uncertainties on these predictions are only reflecting the uncertainties on the theoretical cross section prediction and do not include experimental uncertainties (such as the jet energy scale uncertainty, etc.).
Electron Muon
2-jet 3-jet 2-jet 3-jet
single-top t-channel 447 ± 11 297 ± 7 492 ± 12 323 ± 8
t¯t, other top 785 ± 52 1700 ± 120 801 ± 53 1740 ± 130
W+light jets 350 ± 100 128 ± 56 510 ± 150 209 ± 91
W+heavy flavour jets 2600 ± 740 1100 ± 400 3130 ± 880 1270 ± 480
Z+jets, diboson 158 ± 63 96 ± 44 166 ± 61 80 ± 31
Multijet 710 ± 350 580 ± 290 440 ± 220 270 ± 140
Total expected 5050 ± 830 3900 ± 520 5530 ± 930 3900 ± 520
Data 5021 3592 5592 3915
analysis that applies additional criteria to the basic se-lection described in Section 3.
Neural network based discriminant. The Neu-roBayes [40, 41] tool (version 3.3) is used for preprocessing the input variables and for the training of the NN. A large number of input variables is studied, but only the highest-ranking variables are chosen for the training of the NN. The ranking of variables is automatically determined as part of the preprocessing step and is independent of the training procedure. The total correlation κtotal
t of a set of variables to the target
function, that assumes the value 1 for signal and 0 for background events, is computed as a measure of the discrimination power of these variables. In an iterative procedure, the variables are sorted according to the loss in κtotalt that is induced due to their removal from the set. Considering the number of simulated events used to determine the ranking, one can compute the significance of the information loss caused by the removal of a certain variable. For the training of the NN we use only variables that contribute with more than 20 (10) standard deviations to κtotal
t in the 2-jet
(3-jet) data set. This choice is a compromise between the achievable discrimination power, that increases with the number of variables, and the practical aim of keeping the number of variables at a manageable level.
As a result of this optimization procedure 12 kine-matic variables are identified that serve as inputs to the NN in the 2-jet data set. The most discriminating vari-able is the invariant mass of the b-tagged jet, the charged lepton, and the neutrino, m(ℓνb), which is an estimator for the top-quark mass for signal events. In this
calcu-lation the transverse momentum of the neutrino is given by the x- and y-components of the Emiss
T vector, while
the unmeasured z-component of the neutrino momen-tum, pz(ν), is inferred by imposing a W-boson mass
constraint on the lepton-neutrino system. Since the con-straint leads to a quadratic equation for pz(ν), a
two-fold ambiguity arises. In the case of two real solutions, the one with the smaller |pz| is chosen. If the solutions
are complex, those are avoided by a kinematic fit that rescales the neutrino pxand pysuch that the imaginary
radical vanishes, but keeps the transverse components of the neutrino as close as possible to the Emiss
T . The
second and third most discriminating variables are the absolute value of the pseudorapidity of the highest pT
untagged jet |η( ju)| and the transverse energy of the
un-tagged jet ET( ju). Other variables used by the NN in the
2-jet data set are: the absolute value of ∆η between the b-tagged jet and the reconstructed W boson |∆η(b, W)|; the absolute value of ∆η between the b-tagged jet and the highest pT untagged jet |∆η(b, ju)|; the transverse
momentum of the charged lepton pT(ℓ); the scalar sum
of the transverse momenta of the lepton, jets, and Emiss
T ,
HT(ℓ, jets, ETmiss); mT(W); the pseudorapidity of the
lep-ton η(ℓ); the invariant mass of the b-tagged jet m(b); Emiss
T ; and the invariant mass of the untagged jet and the
b-tagged jet m( jub).
For events with three jets 18 variables are used, the most discriminating ones being the invariant mass of the two leading jets, m( j1j2), m(ℓνb), and the absolute value
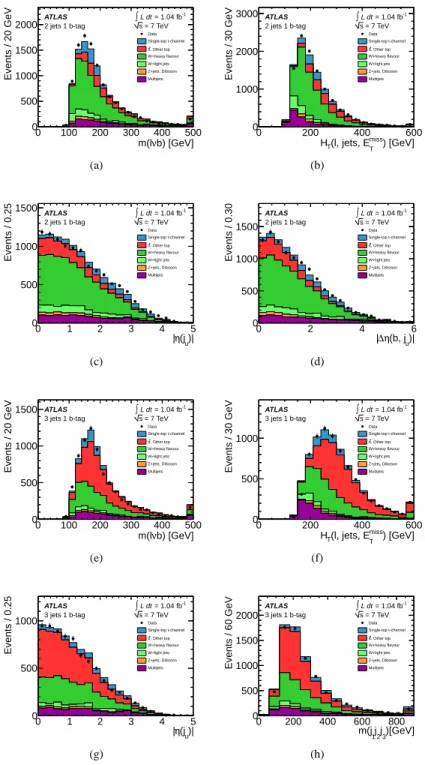
of the difference in the pseudorapidity of the leading and lowest pT jet, |∆η( j1,j3)|. Figure 1 shows distributions
of some of the most discriminating variables in the b-tagged 2-jet or 3-jet samples, used in both the NN
anal-b) [GeV] ν m(l 0 100 200 300 400 500 Events / 20 GeV 0 500 1000 1500 2000 Data Single-top t-channel , Other top t t W+heavy flavour W+light jets Z+jets, Diboson Multijets ATLAS -1 = 1.04 fb L dt ∫ = 7 TeV s 2 jets 1 b-tag (a) ) [GeV] miss T (l, jets, E T H 0 200 400 600 Events / 30 GeV 0 1000 2000 3000 Data Single-top t-channel , Other top t t W+heavy flavour W+light jets Z+jets, Diboson Multijets ATLAS -1 = 1.04 fb L dt ∫ = 7 TeV s 2 jets 1 b-tag (b) )| u (j η | 0 1 2 3 4 5 Events / 0.25 0 500 1000 1500 Data Single-top t-channel , Other top t t W+heavy flavour W+light jets Z+jets, Diboson Multijets ATLAS -1 = 1.04 fb L dt ∫ = 7 TeV s 2 jets 1 b-tag (c) )| u (b, j η ∆ | 0 2 4 6 Events / 0.30 0 500 1000 1500 Data Single-top t-channel , Other top t t W+heavy flavour W+light jets Z+jets, Diboson Multijets ATLAS -1 = 1.04 fb L dt ∫ = 7 TeV s 2 jets 1 b-tag (d) b) [GeV] ν m(l 0 100 200 300 400 500 Events / 20 GeV 0 500 1000 1500 Data Single-top t-channel , Other top t t W+heavy flavour W+light jets Z+jets, Diboson Multijets ATLAS ∫L dt = 1.04 fb-1 = 7 TeV s 3 jets 1 b-tag (e) ) [GeV] miss T (l, jets, E T H 0 200 400 600 Events / 30 GeV 0 500 1000 Data Single-top t-channel , Other top t t W+heavy flavour W+light jets Z+jets, Diboson Multijets ATLAS ∫L dt = 1.04 fb-1 = 7 TeV s 3 jets 1 b-tag (f) )| u (j η | 0 1 2 3 4 5 Events / 0.25 0 500 1000 Data Single-top t-channel , Other top t t W+heavy flavour W+light jets Z+jets, Diboson Multijets ATLAS -1 = 1.04 fb L dt ∫ = 7 TeV s 3 jets 1 b-tag (g) )[GeV] 3 j 2 j 1 m(j 0 200 400 600 800 Events / 60 GeV 0 500 1000 1500 2000 Data Single-top t-channel , Other top t t W+heavy flavour W+light jets Z+jets, Diboson Multijets ATLAS -1 = 1.04 fb L dt ∫ = 7 TeV s 3 jets 1 b-tag (h)
Figure 1: Discriminating variables in the b-tagged sample for 2-jet events and 3-jet events. Multijet event yields are determined with data-driven techniques. Contributions from W+jets events are derived from simulation and normalised to data in control regions with the method employed in the cut-based analysis. All other backgrounds and the t-channel signal expectation are normalised to theoretical cross sections. The last histogram bin includes overflows. The figures shown are for 2-jet or 3-jet events, respectively: (a), (e) the invariant mass of the b-tagged jet, the charged lepton, and the neutrino; (b), (f) the scalar sum of the transverse momenta of the lepton, the jets, and EmissT ; (c), (g) the absolute value of the pseudorapidity of the highest pTuntagged jet. For 2-jet events Figure (d) shows the absolute value of ∆η between the b-tagged jet and the highest
b) [GeV] u m(j 0 100 200 300 400 500 Events / 20 GeV 0 500 1000 1500 2 jets 1 b-tag ATLAS ∫L dt = 1.04 fb-1 = 7 TeV s Data Single-top t-channel , Other top t t W+heavy flavour W+light jets Z+Jets, Diboson Multijets (a) (W) [GeV] T m 0 50 100 150 Events / 7.5 GeV 0 500 1000 1500 2000 2 jets 1 b-tag ATLAS ∫L dt = 1.04 fb-1 = 7 TeV s Data Single-top t-channel , Other top t t W+heavy flavour W+light jets Z+Jets, Diboson Multijets (b) ) [GeV] 2 j 1 m(j 0 100 200 300 400 500 Events / 20 GeV 0 500 1000 3 jets 1 b-tag ATLAS -1 = 1.04 fb L dt ∫ = 7 TeV s Data Single-top t-channel , Other top t t W+heavy flavour W+light jets Z+Jets, Diboson Multijets (c) )| 3 , j 1 (j η ∆ | 0 2 4 6 Events / 0.30 0 500 1000 3 jets 1 b-tag ATLAS -1 = 1.04 fb L dt ∫ = 7 TeV s Data Single-top t-channel , Other top t t W+heavy flavour W+light jets Z+Jets, Diboson Multijets (d)
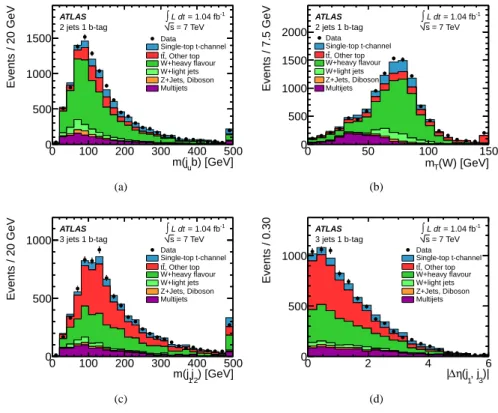
Figure 2: Additional discriminating variables used in the NN analysis for 2-jet and 3-jet events. The rate of multijet events is normalized to the estimate obtained from the fit to the Emiss
T distributions. All other component distributions are normalised to the result of the maximum-likelihood
fit of the NN output. The last histogram bin includes overflows. The figures shown are, for 2-jet events: (a) invariant mass of the highest pT
untagged jet and the b-tagged jet; (b) transverse mass of the lepton-EmissT system; and for 3-jet events: (c) invariant mass of the two leading jets; (d) absolute value of ∆η between the leading jet and the lowest pTjet.
ysis and the cut-based analysis. The variable m( j1j2j3)
denotes the invariant mass of all selected jets in the 3-jet data set. Distributions of additional variables used only in the NN approach are shown in Figure 2.
The agreement between the background model and collision data is tested in the large pretag sample for each input variable used in the analysis, for various ad-ditional control variables, and the NN output distribu-tions, which are shown in Figs. 3(a) and (b). In this control sample, where the b-tagging algorithm has not yet been applied, the b-tagged jet is substituted by the most central jet, with the requirement that it is within
|η| < 2.5. Good agreement is found overall, except for
the |η| distribution of the jet with the highest |η| in the pretag data set for which an additional systematic mod-elling uncertainty is taken into account (see Section 6).
The NeuroBayes tool combines a three-layer feed-forward NN with a complex preprocessing of the input variables. By transforming the variables in the prepro-cessing step the influence of outliers is largely reduced and statistical fluctuations are damped. NeuroBayes
ap-plies Bayesian regularisation techniques for the ing process to damp statistical fluctuations in the train-ing sample and to avoid overtraintrain-ing. A certain fraction of simulated events (20%) is not included in the train-ing sample and is used as an independent test sample to check that there is no overtraining. The ratio of signal to background events in the training is chosen to be 1:1, while the different background processes are weighted according to the number of expected events.
To extract the signal content of the selected sam-ple a maximum-likelihood fit is performed to the com-plete NN output distributions in the 2-jet and 3-jet data sets (see Section 7). Fitting all bins of the distribution has the advantage of making maximal use of the signal events remaining after the event selection, and also al-lows the background rates to be constrained by the data. The sensitivity to the background rates is given by the background dominated region close to zero. The ob-served NN output distributions scaled to the fit result are shown in Figs. 3(c) and 3(d) for b-tagged events with two or three jets, respectively.
NN output Events / 0.07 0 20 40 60 80 3 10 × 2 jets Pretag ATLAS ∫L dt = 1.04 fb-1 = 7 TeV s NN output 0 0.2 0.4 0.6 0.8 1 Data / Pred. 0.5 1 1.5 Data Single-top t-channel , Other top t t W+heavy flavour W+light jets Z+Jets, Diboson Multijets JES Uncertainty Band
(a) NN output Events / 0.07 0 5 10 15 20 3 10 × 3 jets Pretag ATLAS ∫L dt = 1.04 fb-1 = 7 TeV s NN output 0 0.2 0.4 0.6 0.8 1 Data / Pred. 0.5 1 1.5 Data Single-top t-channel , Other top t t W+heavy flavour W+light jets Z+Jets, Diboson Multijets JES Uncertainty Band
(b) NN output 0 0.2 0.4 0.6 0.8 1 Events / 0.07 0 1000 2000 2 jets 1 b-tag ATLAS -1 = 1.04 fb L dt ∫ = 7 TeV s Data Single-top t-channel , Other top t t W+heavy flavour W+light jets Z+Jets, Diboson Multijets (c) NN output 0 0.2 0.4 0.6 0.8 1 Events / 0.07 0 500 1000 1500 2000 3 jets 1 b-tag ATLAS -1 = 1.04 fb L dt ∫ = 7 TeV s Data Single-top t-channel , Other top t t W+heavy flavour W+light jets Z+Jets, Diboson Multijets (d)
Figure 3: (a) and (b): Neural network output distribution for the pretag sample, including the JES uncertainty on the prediction (hatched region). The multijet component is normalized to the estimate obtained from the fit to the Emiss
T distributions. All other components are normalised such that
the total number of expected events in the pretag sample is equal to the observed number of events. The ratio beween the data and the total predicted distributions is also shown. (c) and (d): NN output distribution for the 2-jet and 3-jet b-tagged samples, respectively. All component distributions are normalised to the result of the maximum-likelihood fit, except for the component of multijet events that is normalized to the estimate obtained from the fit to the ETmissdistributions.
Cut-based selection. In the cut-based analysis addi-tional selections are applied to a subset of five variables used by the NN analysis: |η( ju)| > 2, HT(ℓ, jets, EmissT ) >
210 GeV, and 150 GeV < m(ℓνb) < 190 GeV. The 2-jet selection requires |∆η(b, ju)| > 1, while the 3-jet
selec-tion requires that m( j1j2j3) is higher than 450 GeV, to
further reduce the large t¯t contribution in this channel. The selection cuts were chosen in order to increase the expected significance of the t-channel single top-quark signal, taking into account systematic uncertainties on the background estimate [42].
The positive and negative lepton-charge samples are considered separately, as more single-top quark
t-channel events are expected in the e+/µ+samples than
in the e−/µ− samples due to the dominance of valence
u quarks in the proton over d quarks. The 2-jet and 3-jet data sets are also considered separately.
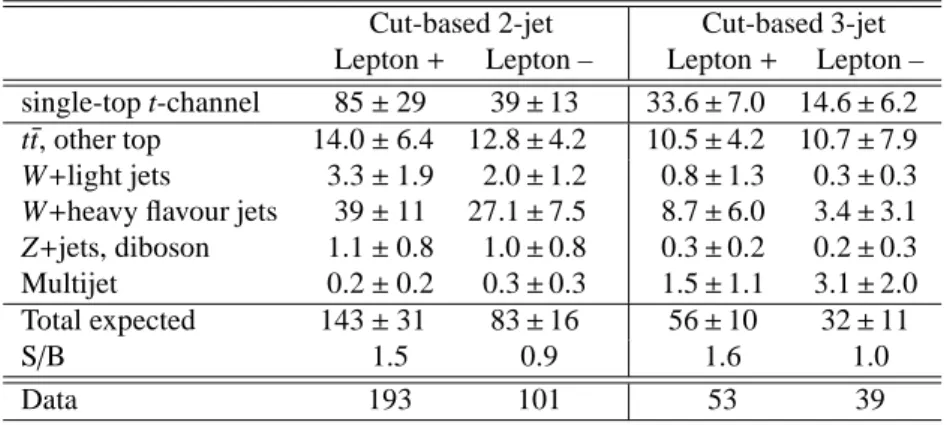
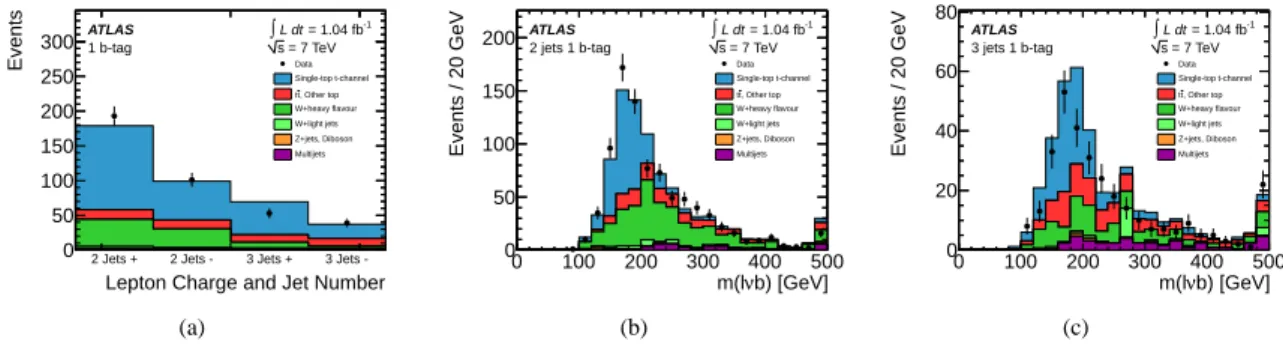
The signal and background event counts for the pos-itive and negative lepton-charge samples are given in Table 2. The observed event yields are consistent with the SM expectation in each channel. Figure 4(a) shows the distribution of the lepton charge for events with two or three jets after the application of all cut-based selec-tions. Figures 4(b) and 4(c) display the variable m(ℓνb) for 2-jet and 3-jet events respectively after applying all selections except for the cut on m(ℓνb). In these
fig-Table 2: Event yield for the 2-jet and 3-jet b-tagged positive and negative lepton-charge channels after the cut-based selection. The multijet and
W+jets backgrounds are normalised to observed data in control regions, all other samples are normalised to theory cross sections. Uncertainties
shown include all sources of systematic errors, summed quadratically and without taking into account possible anticorrelations between systematic sources and between processes.
Cut-based 2-jet Cut-based 3-jet Lepton + Lepton – Lepton + Lepton – single-top t-channel 85 ± 29 39 ± 13 33.6 ± 7.0 14.6 ± 6.2 t¯t, other top 14.0 ± 6.4 12.8 ± 4.2 10.5 ± 4.2 10.7 ± 7.9
W+light jets 3.3 ± 1.9 2.0 ± 1.2 0.8 ± 1.3 0.3 ± 0.3
W+heavy flavour jets 39 ± 11 27.1 ± 7.5 8.7 ± 6.0 3.4 ± 3.1
Z+jets, diboson 1.1 ± 0.8 1.0 ± 0.8 0.3 ± 0.2 0.2 ± 0.3
Multijet 0.2 ± 0.2 0.3 ± 0.3 1.5 ± 1.1 3.1 ± 2.0
Total expected 143 ± 31 83 ± 16 56 ± 10 32 ± 11
S/B 1.5 0.9 1.6 1.0
Data 193 101 53 39
ures, the t-channel single top-quark contribution is nor-malised to the observed cross section as measured from the combination of all four channels.
6. Systematic uncertainties
Systematic uncertainties on the normalisation of the individual backgrounds and on the signal acceptance af-fect the measured single top-quark t-channel cross sec-tion. In the NN analysis the shape of each individual prediction is also affected; both the rate and the shape uncertainties are taken into account by generating cor-related pseudo-experiments. The impact of the system-atic uncertainties on the t-channel cross-section mea-surement is estimated from these pseudo-experiments. The uncertainties can be split into the following cate-gories:
Object modelling. Systematic uncertainties due to the residual differences between data and Monte-Carlo sim-ulation for the reconstruction and energy calibration of jets, electrons and muons are propagated in the analysis. The main source of object modelling uncertainty comes from the jet energy scale (JES), including the modelling of pile-up, as well as b-jet identification. Other com-ponents include lepton energy scale and lepton and jet identification efficiencies. The JES uncertainty has been evaluated using 2010 data [31]. Additional contribu-tions to this uncertainty due to the larger pile-up effects in 2011 data are included and range from less than 1% to 5% as a function of jet pT and η. For b-quark jets
a JES uncertainty of 0.8% to 2.5%, depending on the jet pT, is added in quadrature to the JES uncertainty.
Scale factors, determined from collision data [32], are
applied to correct the b-tagging performance in simu-lated events to match the data. Both b-jets and c-jets in simulation use the same b-tagging scale factors with un-certainties that depend on the pT and η of the jet. The
uncertainties on the scale factors vary from 10% to 15% for b-quark jets and from 20% to 30% for c-quark jets. For light-quark jets the mis-tagging uncertainty ranges from 20% to 50% as a function of jet pT and η. Other
minor uncertainties are assigned to the reconstruction of ETmissand to account for the impact of pile-up collisions on EmissT . Finally, a systematic uncertainty was also as-signed to account for temporary failures of parts of the LAr calorimeter readout during part of the data-taking period, which was not modelled in the MC samples. Monte-Carlo generators and PDFs. Systematic uncer-tainties arising from the modelling of the single top-quark signal and the t¯t background are taken into ac-count. The largest contributions come from the mod-elling of parton showers and hadronisation, estimated by interchanging the modelling between PYTHIA and HERWIG, and from the amount of initial-state and final-state radiation (ISR/FSR), estimated using dedi-cated AcerMC samples interfaced to PYTHIA where parameters controlling the ISR/FSR emission are var-ied in a range3consistent with those used in the Peru-gia Hard/Soft tune variations [43]. The uncertainty due
3The default PYTHIA values of these parameters are : PARP(67)
= 4.0 and PARP(64) = 1.0 for ISR and PARP(72) = 0.192 GeV,
PARJ(82) = 1.0 GeV for FSR. To decrease (increase) ISR, the param-eters PARP(67) and PARP(64) are set to 0.5 and 4.0 (6.0 and 0.25), re-spectively. To decrease (increase) FSR, the parameters PARP(72) and PARJ(82) are set to 0.096 GeV and 2.0 GeV (0.384 GeV and 0.5 GeV), respectively. Samples of simulated events are produced with six
dif-Lepton Charge and Jet Number
2 Jets + 2 Jets - 3 Jets + 3 Jets
-Events 0 50 100 150 200 250 300 ATLAS -1 = 1.04 fb L dt ∫ = 7 TeV s 1 b-tag Data Single-top t-channel , Other top t t W+heavy flavour W+light jets Z+jets, Diboson Multijets (a) b) [GeV] ν m(l 0 100 200 300 400 500 Events / 20 GeV 0 50 100 150 200 Data Single-top t-channel , Other top t t W+heavy flavour W+light jets Z+jets, Diboson Multijets ATLAS ∫L dt = 1.04 fb-1 = 7 TeV s 2 jets 1 b-tag (b) b) [GeV] ν m(l 0 100 200 300 400 500 Events / 20 GeV 0 20 40 60 80 Data Single-top t-channel , Other top t t W+heavy flavour W+light jets Z+jets, Diboson Multijets ATLAS ∫L dt = 1.04 fb-1 = 7 TeV s 3 jets 1 b-tag (c)
Figure 4: (a) Distribution of the lepton charge after the full cut-based selection for 2-jet and 3-jet events. (b,c) invariant mass of the b-tagged jet, the charged lepton, and the neutrino, m(ℓνb), for the b-tagged sample for 2-jet (b) and 3-jet (c) events after applying all cut-based selections except for the cut on m(ℓνb). In all three distributions the t-channel single top-quark contribution is normalised to the observed cross section obtained with the cut-based analysis. The last histogram bin includes overflows.
to the choice of the single top-quark t-channel signal generator is estimated from the difference between
Ac-erMC and MCFM predictions [44]. The modelling
un-certainty for the t¯t background is evaluated by compar-ing the generators MC@NLO and POWHEG [45, 46] (with HERWIG showering). For the W+jets back-ground a shape uncertainty is assigned based on the variation of the choices of the matching scale and of the functional form of the factorisation scale in ALP-GEN. Systematic uncertainties related to the parton dis-tribution functions are taken into account for the signal and for all background processes which are modelled by simulated events. In addition to the nominal PDF set the alternative MSTW2008nlo68cl [47] and CTEQ6.6 PDF sets are investigated. Events are reweighted ac-cording to each of the PDF uncertainty eigenvectors and the total uncertainty is evaluated following the proce-dure described in Ref. [36]. An additional uncertainty is assigned for the mis-modelling of jets in the forward
|η| regions. A weight function is derived from the
pre-tag sample by dividing the observed |η| distribution in data by the distribution obtained from simulated events, for 2-jet and 3-jet events. The event weights defined in this way are then applied to all simulated samples in the b-tagged data set. The systematic uncertainty is derived from the one-sided difference between the weighted and the nominal samples. The impact of using simulation samples of limited size is also taken into account. Theoretical cross section normalisation. The t¯t, single-top quark Wt- and s-channel backgrounds are nor-malised to their theory predictions with theoretical un-certainties of +7−10%, 7% and 4%, respectively [48, 10,
ferent sets of parameters settings: ISR increased (decreased), FSR increased (decreased), and a simultaneous increase (decrease) of ISR and FSR.
11]. The uncertainty on the diboson background is 5% [38].
Background normalisation to data. The multijet back-ground estimate has an uncertainty of 50%. The NN analysis places an uncertainty of 50% on the rate of events with W+heavy flavour jets and 30% on the rate of W+light jets events. These uncertainties are used as constraints on the predictions when simultaneously determining the W+jets rates and the signal cross sec-tion. The cut-based analysis does not apply a global un-certainty on the W+heavy flavour and W+light flavour rates, but considers separately the impact of the domi-nant sources of uncertainty on the data-derived W+jets normalisation factors. This treatment allows the correla-tion between each component of uncertainty on the nor-malisation factors and the uncertainties on the W+jets rates to be taken into account. The Z+jets background normalisation has an uncertainty of 60%.
Luminosity. The uncertainty on the integrated luminos-ity is 3.7% [13, 14].
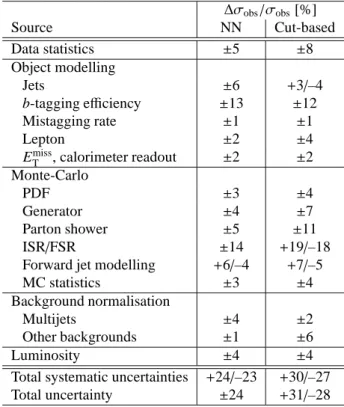
Table 3 shows the contribution of each source of un-certainty to the total unun-certainty on the measured t-channel cross section (∆σobs/σobs) for the neural
net-work analysis and for the cut-based analysis.
7. Cross section measurements
Both the cut-based and neural network analyses em-ploy a maximum-likelihood fit method to measure the single top-quark t-channel cross section. The general likelihood function is given by the product of the Pois-son likelihoods in the individual channels. The back-ground rates are constrained by Gaussian priors. We use the following equations:
Table 3: Breakdown of the contribution of each source of uncertainty to the total uncertainty of the measured t-channel cross section in data for the NN analysis and the cut-based analysis. Theoretical uncertain-ties are included in the “Other backgrounds” uncertainty category.
∆σobs/σobs[%] Source NN Cut-based Data statistics ±5 ±8 Object modelling Jets ±6 +3/–4 b-tagging efficiency ±13 ±12 Mistagging rate ±1 ±1 Lepton ±2 ±4 Emiss T , calorimeter readout ±2 ±2 Monte-Carlo PDF ±3 ±4 Generator ±4 ±7 Parton shower ±5 ±11 ISR/FSR ±14 +19/–18
Forward jet modelling +6/–4 +7/–5
MC statistics ±3 ±4
Background normalisation
Multijets ±4 ±2
Other backgrounds ±1 ±6
Luminosity ±4 ±4
Total systematic uncertainties +24/–23 +30/–27
Total uncertainty ±24 +31/–28 L(βs; βbj) = M Y k=1 e−µk· µnk k nk! · B Y j=1 G(βbj; 1, ∆j) with µk= µsk+ B X j=1 µbjk, µsk= βs·˜νs·αsk, and µ b jk= β b j·˜νj·αjk,
where M is the number of channels and B the number of background processes. The cut-based analysis uses M = 4 channels separated by lepton charge and the number of jets, while in the NN-based analysis M is equal to 28, namely the number of bins of the NN dis-criminant in the 2-jet channel plus the number of bins of the NN discriminant in the 3-jet channel. Here ˜νsand ˜νj
are, respectively, the predicted number of signal events and the number of events of background j in the selected data set. The number of observed (expected) events in channel k is denoted by nk(µk). The expected number of
events in channel k is µs
kfor the signal and µ b
jkfor each
background j. The fraction of events falling in channel
k is given by αs
kand αjkfor signal and background
re-spectively. For the NN-based analysis the sets of αs kand αjk constitute the probability densities (shapes) of the
NN discriminants. The scale factors βsfor signal and βb j
for the backgrounds are the parameters of the likelihood function that are fitted to the data. The Gaussian con-traints on the background scale factors, ∆j, are set to the
theoretical cross section uncertainty for all background processes that do not use data-based estimates (t¯t, Wt, s-channel and diboson), while W+jets backgrounds are constrained within their data-derived uncertainties. The multijet background is fixed to the value estimated from data.
The systematic uncertainties on the cross section measurement are determined using a frequentist method based on a large number of pseudo-experiments. For each pseudo-experiment the expectation values of the backgrounds ˜νj and of the signal ˜νs as well as the
rel-ative distribution of events across the channels (αs k and αjk) are varied including all sources of uncertainties
de-scribed in Section 6 and the t-channel cross section is measured with the maximum-likelihood fit. The distri-bution of measured cross sections is an estimator of the probability density function of all possible outcomes of the measurement and it is used to estimate the uncer-tainty on the actual measurement.
The NN-based analysis yields, from a simultaneous measurement in the 2-jet and 3-jet channels, a cross sec-tion of
σt= 83 ± 4 (stat.)+20−19(syst.) pb = 83 ± 20 pb.
The significance of the observed signal corresponds to 7.2 standard deviations (6.0 expected). This is com-puted using as a test statistic the Q-value, which is de-fined as the ratio of the value of the likelihood function maximized for the Standard Model signal cross section to the value of the likelihood function maximized for zero signal.
The cut-based analysis measures, by combining four different channels (positive and negative lepton charge, with two and three jets) a cross section of σt =
92+29−26 pb, in good agreement with the NN-based mea-surement. The separation of candidate events according to the lepton charge allows individual measurements of the top-quark and top-antiquark cross sections, yield-ing the results σ(t) = 59+18−16 pb and σ(¯t) = 33+13−12 pb, that can be compared to the theoretically predicted cross sections of 41.9+1.8
−0.8pb and 22.7 +0.9
−1.0pb, respectively [9].
To test the compatibility, the two measurements from the NN-based and cut-based analyses are combined using the Best Linear Unbiased Estimator (BLUE)
method [49]. The correlation coefficient of the two anal-yses is 75% and was determined with ensemble tests including all systematic uncertainties. Based on the en-semble tests the two results are found to be compatible within one standard deviation. However, the combined result and its uncertainty for the observed cross section measurement does not significantly differ from the re-sult obtained with the NN analysis alone.
8. Vt bmeasurement
Single top-quark production in the t-channel pro-ceeds via a W-t-b vertex and the measured cross section is proportional to |Vtb|2, where Vtbis the relevant CKM
matrix element. In the Standard Model |Vtb| is close to
one, but new physics contributions could alter its value significantly.
The |Vtb| measurement is independent of assumptions
about the number of quark generations or about the uni-tarity of the CKM matrix. The only assumptions re-quired are that |Vtb| ≫ |Vtd|, |Vts| and that the W-t-b
inter-action is an SM-like left-handed weak coupling. There-fore, the t¯t background rate is unaffected by a varia-tion of |Vtb| since decays to a potential higher
genera-tion are prohibited by kinematics. On the other hand, rates of single-top quark Wt and s-channel backgrounds also scale with |Vtb|2, but their contributions are small in
the signal region that drives the maximum-likelihood fit measurement. The resulting variation on the total top-quark background yield is less than its systematic un-certainty and thus considered negligible.
The value of |Vtb|2 is extracted by dividing the
ob-served single top-quark t-channel cross section, mea-sured using the NN method, by the SM expecta-tion [9]. The experimental and theoretical uncertain-ties are added in quadrature. The result obtained is
|Vtb| = 1.13+0.14−0.13(exp.) ± 0.02 (theo.) = 1.13+0.14−0.13.
Re-stricting the range of |Vtb| to the interval [0, 1], as
re-quired by the SM, a lower limit on |Vtb| is extracted:
|Vtb| > 0.75 at the 95% confidence level.
9. Conclusion
In summary, we present a measurement of the cross section of single top-quark production in the t-channel with the ATLAS detector in pp collisions at √s = 7 TeV. The measurement is based on a neural network discriminant separating signal events from background and yields a cross section of 83±20 pb. The correspond-ing couplcorrespond-ing at the W-t-b vertex is |Vtb| = 1.13+0.14−0.13and
the 95% confidence level lower limit on the CKM ma-trix element |Vtb| is 0.75.
10. Acknowledgements
We thank CERN for the very successful operation of the LHC, as well as the support staff from our institu-tions without whom ATLAS could not be operated effi-ciently.
We acknowledge the support of ANPCyT, Ar-gentina; YerPhI, Armenia; ARC, Australia; BMWF, Austria; ANAS, Azerbaijan; SSTC, Belarus; CNPq and FAPESP, Brazil; NSERC, NRC and CFI, Canada; CERN; CONICYT, Chile; CAS, MOST and NSFC, China; COLCIENCIAS, Colombia; MSMT CR, MPO CR and VSC CR, Czech Republic; DNRF, DNSRC and Lundbeck Foundation, Denmark; EPLANET and ERC, European Union; IN2P3-CNRS, CEA-DSM/IRFU, France; GNAS, Georgia; BMBF, DFG, HGF, MPG and AvH Foundation, Germany; GSRT, Greece; ISF, MINERVA, GIF, DIP and Benoziyo Center, Israel; INFN, Italy; MEXT and JSPS, Japan; CNRST, Mo-rocco; FOM and NWO, Netherlands; RCN, Norway; MNiSW, Poland; GRICES and FCT, Portugal; MERYS (MECTS), Romania; MES of Russia and ROSATOM, Russian Federation; JINR; MSTD, Serbia; MSSR, Slo-vakia; ARRS and MVZT, Slovenia; DST/NRF, South Africa; MICINN, Spain; SRC and Wallenberg Foun-dation, Sweden; SER, SNSF and Cantons of Bern and Geneva, Switzerland; NSC, Taiwan; TAEK, Turkey; STFC, the Royal Society and Leverhulme Trust, United Kingdom; DOE and NSF, United States of America.
The crucial computing support from all WLCG part-ners is acknowledged gratefully, in particular from CERN and the ATLAS Tier-1 facilities at TRIUMF (Canada), NDGF (Denmark, Norway, Sweden), CC-IN2P3 (France), KIT/GridKA (Germany), INFN-CNAF (Italy), NL-T1 (Netherlands), PIC (Spain), ASGC (Tai-wan), RAL (UK) and BNL (USA) and in the Tier-2 fa-cilities worldwide.
References
[1] CDF Collaboration, T. Aaltonen, et al., Phys. Rev. Lett. 103 (2009) 092002 [arXiv:0903.0885].
[2] DØ Collaboration, V. M. Abazov, et al., Phys. Rev. Lett. 103 (2009) 092001 [arXiv:0903.0850].
[3] DØ Collaboration, V. M. Abazov, et al., Phys. Lett. B 705 (2011) 313 [arXiv:1105.2788].
[4] CMS Collaboration, Phys. Rev. Lett. 107 (2011) 091802 [arXiv:1106.3052].
[5] T. M. P. Tait, C. P. Yuan, Phys. Rev. D 63 (2000) 014018 [arXiv:hep–ph/0007298].
[6] N. Cabibbo, Phys. Rev. Lett. 10 (1963).
[7] M. Kobayashi, T. Maskawa, Prog. Theor. Phys. 49 (1973). [8] DØ Collaboration, V. M. Abazov, et al., Phys. Rev. D 84 (2011)
[9] N. Kidonakis, Phys. Rev. D 83 (2011) 091503 [arXiv:1103.2792].
[10] N. Kidonakis, Phys. Rev. D 82 (2010) 054018 [arXiv:1005.4451].
[11] N. Kidonakis, Phys. Rev. D 81 (2010) 054028 [arXiv:1001.5034].
[12] ATLAS Collaboration, J. Inst. 3 (2008) S08003.
[13] ATLAS Collaboration, Eur. Phys. J. C 71 (2011) 1630 [arXiv:1101.2185].
[14] ATLAS Collaboration, ATLAS-CONF-2011-116 (2011). [15] B. P. Kersevan, E. Richter-Was, arXiv:hep-ph/0405247 (2004). [16] A. Sherstnev, R. Thorne, Eur. Phys. J. C 55 (2008) 553
[arXiv:0711.2473].
[17] B. P. Kersevan, I. Hinchliffe, JHEP 0609 (2006) 033 [arXiv:hep– ph/0603068].
[18] S. Frixione, B. R. Webber, P. Nason, arXiv:hep-ph/0204244 and hep-ph/0305252 (2002).
[19] J. Pumplin, et al., JHEP 0207 (2002) 012 [arXiv:hep– ph/0201195].
[20] S. Frixione, E. Laenen, P. Motylinski, B. R. Webber, C. D. White, JHEP 07 (2008) 029.
[21] M. L. Mangano, M. Moretti, F. Piccinini, R. Pittau, A. D. Polosa, JHEP 0307 (2003) 001 [arXiv:hep–ph/0206293].
[22] G. Corcella, et al., JHEP 0101 (2001) 010 [arXiv:hep– ph/0011363].
[23] T. Sj¨ostrand, et al., Computer Phys. Commun. 135 (2001) 238 [arXiv:hep–ph/0010017].
[24] J. M. Butterworth, J. R. Forshaw, M. H. Seymour, Z. Phys. C 72 (1996) 637 [arXiv:hep–ph/9601371].
[25] ATLAS Collaboration, Eur. Phys. J. C 70 (2010) 823 [arXiv:1005.4568].
[26] S. Agostinelli, et al., Nucl. Instrum. Meth. A 506 (2003) 250. [27] ATLAS Collaboration, Eur. Phys. J. C 72 (2012) 1909
[arXiv:1110.3174].
[28] ATLAS Collaboration, Phys. Lett. B 707 (2012) 459 [arXiv:1108.3699].
[29] M. Cacciari, G.P. Salam and G. Soyez, JHEP 04 (2008) 63 [arXiv:0802.1189].
[30] ATLAS Collaboration, Eur. Phys. J. C 71 (2011) 1512 [arXiv:1009.5908].
[31] ATLAS Collaboration, arXiv:1112.6426 (2011). [32] ATLAS Collaboration, ATLAS-CONF-2011-102 (2011). [33] ATLAS Collaboration, Eur. Phys. J. C 72 (2012) 1844
[arXiv:1108.5602].
[34] ATLAS Collaboration, ATLAS-CONF-2012-042 (2012). [35] ATLAS Collaboration, ATLAS-CONF-2010-038 (2010). [36] ATLAS Collaboration, Eur. Phys. J. C 71 (2011) 1577
[arXiv:1012.1792].
[37] C. Anastasiou, L. Dixon, K. Melnikov, F. Petriello, Phys. Rev. D 69 (2004) 094008 [arXiv:hep–ph/0312266].
[38] J. M. Campbell, R. K. Ellis, C. Williams, JHEP 1107 (2011) 018 [arXiv:1105.0020].
[39] M. Aliev, et al., Comput. Phys. Commun. 182 (2011) 1034 [arXiv:1007.1327].
[40] M. Feindt, arXiv:physics/0402093 (2004).
[41] M. Feindt, U. Kerzel, Nucl. Instrum. Meth. A 559 (2006) 190. [42] R. D. Cousins, J. T. Linnemann, J. Tucker, Nucl.
In-strum. Meth. A 595 (2008) 480.
[43] P. Z. Skands, Phys. Rev. D 82 (2010) 074018 [arXiv:1005.3457].
[44] J. M. Campbell, R. Frederix, F. Maltoni, F. Tramontano, Phys. Rev. Lett. 102 (2009) 182003 [arXiv:0903.0005].
[45] S. Alioli, P. Nason, C. Oleari, E. Re, JHEP 1006 (2010) 043 [arXiv:1002.2581].
[46] S. Frixione, P. Nason, G. Ridolfi, JHEP 0709 (2007) 126
[arXiv:0707.3088].
[47] A. Martin, W. Stirling, R. Thorne, G. Watt, Eur. Phys. J. C 64 (2009) 653 [arXiv:0905.3531].
[48] S. Moch, P. Uwer, Phys. Rev. D 78 (2008) 034003 [arXiv: 0807.2794].
[49] L. Lyons, D. Gibaut, P. Clifford, Nucl. Instrum. Meth. A 270 (1988) 110.
The ATLAS Collaboration
G. Aad48, B. Abbott110, J. Abdallah11, S. Abdel Khalek114, A.A. Abdelalim49, A. Abdesselam117, O. Abdinov10,
B. Abi111, M. Abolins87, O.S. AbouZeid157, H. Abramowicz152, H. Abreu114, E. Acerbi88a,88b, B.S. Acharya163a,163b,
L. Adamczyk37, D.L. Adams24, T.N. Addy56, J. Adelman174, M. Aderholz98, S. Adomeit97, P. Adragna74, T. Adye128,
S. Aefsky22, J.A. Aguilar-Saavedra123b,a, M. Aharrouche80, S.P. Ahlen21, F. Ahles48, A. Ahmad147, M. Ahsan40,
G. Aielli132a,132b, T. Akdogan18a, T.P.A. Åkesson78, G. Akimoto154, A.V. Akimov93, A. Akiyama66, M.S. Alam1,
M.A. Alam75, J. Albert168, S. Albrand55, M. Aleksa29, I.N. Aleksandrov64, F. Alessandria88a, C. Alexa25a,
G. Alexander152, G. Alexandre49, T. Alexopoulos9, M. Alhroob20, M. Aliev15, G. Alimonti88a, J. Alison119, M. Aliyev10, B.M.M. Allbrooke17, P.P. Allport72, S.E. Allwood-Spiers53, J. Almond81, A. Aloisio101a,101b, R. Alon170, A. Alonso78, B. Alvarez Gonzalez87, M.G. Alviggi101a,101b, K. Amako65, P. Amaral29, C. Amelung22, V.V. Ammosov127, A. Amorim123a,b, G. Amor´os166, N. Amram152, C. Anastopoulos29, L.S. Ancu16, N. Andari114, T. Andeen34, C.F. Anders20, G. Anders58a, K.J. Anderson30, A. Andreazza88a,88b, V. Andrei58a, M-L. Andrieux55, X.S. Anduaga69, A. Angerami34, F. Anghinolfi29, A. Anisenkov106, N. Anjos123a, A. Annovi47, A. Antonaki8,
M. Antonelli47, A. Antonov95, J. Antos143b, F. Anulli131a, S. Aoun82, L. Aperio Bella4, R. Apolle117,c, G. Arabidze87,
I. Aracena142, Y. Arai65, A.T.H. Arce44, S. Arfaoui147, J-F. Arguin14, E. Arik18a,∗, M. Arik18a, A.J. Armbruster86,
O. Arnaez80, V. Arnal79, C. Arnault114, A. Artamonov94, G. Artoni131a,131b, D. Arutinov20, S. Asai154,
R. Asfandiyarov171, S. Ask27, B. Åsman145a,145b, L. Asquith5, K. Assamagan24, A. Astbury168, A. Astvatsatourov52,
B. Aubert4, E. Auge114, K. Augsten126, M. Aurousseau144a, G. Avolio162, R. Avramidou9, D. Axen167, C. Ay54,
G. Azuelos92,d, Y. Azuma154, M.A. Baak29, G. Baccaglioni88a, C. Bacci133a,133b, A.M. Bach14, H. Bachacou135,
K. Bachas29, M. Backes49, M. Backhaus20, E. Badescu25a, P. Bagnaia131a,131b, S. Bahinipati2, Y. Bai32a,
D.C. Bailey157, T. Bain157, J.T. Baines128, O.K. Baker174, M.D. Baker24, S. Baker76, E. Banas38, P. Banerjee92,
Sw. Banerjee171, D. Banfi29, A. Bangert149, V. Bansal168, H.S. Bansil17, L. Barak170, S.P. Baranov93, A. Barashkou64,
A. Barbaro Galtieri14, T. Barber48, E.L. Barberio85, D. Barberis50a,50b, M. Barbero20, D.Y. Bardin64, T. Barillari98,
M. Barisonzi173, T. Barklow142, N. Barlow27, B.M. Barnett128, R.M. Barnett14, A. Baroncelli133a, G. Barone49, A.J. Barr117, F. Barreiro79, J. Barreiro Guimar˜aes da Costa57, P. Barrillon114, R. Bartoldus142, A.E. Barton70, V. Bartsch148, R.L. Bates53, L. Batkova143a, J.R. Batley27, A. Battaglia16, M. Battistin29, F. Bauer135, H.S. Bawa142,e, S. Beale97, T. Beau77, P.H. Beauchemin160, R. Beccherle50a, P. Bechtle20, H.P. Beck16, S. Becker97,
M. Beckingham137, K.H. Becks173, A.J. Beddall18c, A. Beddall18c, S. Bedikian174, V.A. Bednyakov64, C.P. Bee82, M. Begel24, S. Behar Harpaz151, P.K. Behera62, M. Beimforde98, C. Belanger-Champagne84, P.J. Bell49, W.H. Bell49,
G. Bella152, L. Bellagamba19a, F. Bellina29, M. Bellomo29, A. Belloni57, O. Beloborodova106, f, K. Belotskiy95,
O. Beltramello29, O. Benary152, D. Benchekroun134a, M. Bendel80, N. Benekos164, Y. Benhammou152,
E. Benhar Noccioli49, J.A. Benitez Garcia158b, D.P. Benjamin44, M. Benoit114, J.R. Bensinger22, K. Benslama129,
S. Bentvelsen104, D. Berge29, E. Bergeaas Kuutmann41, N. Berger4, F. Berghaus168, E. Berglund104, J. Beringer14,
P. Bernat76, R. Bernhard48, C. Bernius24, T. Berry75, C. Bertella82, A. Bertin19a,19b, F. Bertinelli29,
F. Bertolucci121a,121b, M.I. Besana88a,88b, N. Besson135, S. Bethke98, W. Bhimji45, R.M. Bianchi29, M. Bianco71a,71b,
O. Biebel97, S.P. Bieniek76, K. Bierwagen54, J. Biesiada14, M. Biglietti133a, H. Bilokon47, M. Bindi19a,19b, S. Binet114,
A. Bingul18c, C. Bini131a,131b, C. Biscarat176, U. Bitenc48, K.M. Black21, R.E. Blair5, J.-B. Blanchard135,
G. Blanchot29, T. Blazek143a, C. Blocker22, J. Blocki38, A. Blondel49, W. Blum80, U. Blumenschein54,
G.J. Bobbink104, V.B. Bobrovnikov106, S.S. Bocchetta78, A. Bocci44, C.R. Boddy117, M. Boehler41, J. Boek173,
N. Boelaert35, J.A. Bogaerts29, A. Bogdanchikov106, A. Bogouch89,∗, C. Bohm145a, J. Bohm124, V. Boisvert75, T. Bold37, V. Boldea25a, N.M. Bolnet135, M. Bomben77, M. Bona74, V.G. Bondarenko95, M. Bondioli162, M. Boonekamp135, C.N. Booth138, S. Bordoni77, C. Borer16, A. Borisov127, G. Borissov70, I. Borjanovic12a, M. Borri81, S. Borroni86, V. Bortolotto133a,133b, K. Bos104, D. Boscherini19a, M. Bosman11, H. Boterenbrood104,
D. Botterill128, J. Bouchami92, J. Boudreau122, E.V. Bouhova-Thacker70, D. Boumediene33, C. Bourdarios114,
N. Bousson82, A. Boveia30, J. Boyd29, I.R. Boyko64, N.I. Bozhko127, I. Bozovic-Jelisavcic12b, J. Bracinik17,
A. Braem29, P. Branchini133a, G.W. Brandenburg57, A. Brandt7, G. Brandt117, O. Brandt54, U. Bratzler155, B. Brau83,
J.E. Brau113, H.M. Braun173, B. Brelier157, J. Bremer29, K. Brendlinger119, R. Brenner165, S. Bressler170,
D. Britton53, F.M. Brochu27, I. Brock20, R. Brock87, T.J. Brodbeck70, E. Brodet152, F. Broggi88a, C. Bromberg87,
J. Bronner98, G. Brooijmans34, W.K. Brooks31b, G. Brown81, H. Brown7, P.A. Bruckman de Renstrom38,
D. Bruncko143b, R. Bruneliere48, S. Brunet60, A. Bruni19a, G. Bruni19a, M. Bruschi19a, T. Buanes13, Q. Buat55,
I.A. Budagov64, B. Budick107, V. B¨uscher80, L. Bugge116, O. Bulekov95, M. Bunse42, T. Buran116, H. Burckhart29,
S. Burdin72, T. Burgess13, S. Burke128, E. Busato33, P. Bussey53, C.P. Buszello165, F. Butin29, B. Butler142,
J.M. Butler21, C.M. Buttar53, J.M. Butterworth76, W. Buttinger27, S. Cabrera Urb´an166, D. Caforio19a,19b, O. Cakir3a,
P. Calafiura14, G. Calderini77, P. Calfayan97, R. Calkins105, L.P. Caloba23a, R. Caloi131a,131b, D. Calvet33, S. Calvet33,
R. Camacho Toro33, P. Camarri132a,132b, M. Cambiaghi118a,118b, D. Cameron116, L.M. Caminada14, S. Campana29,
M. Campanelli76, V. Canale101a,101b, F. Canelli30,g, A. Canepa158a, J. Cantero79, L. Capasso101a,101b,
M.D.M. Capeans Garrido29, I. Caprini25a, M. Caprini25a, D. Capriotti98, M. Capua36a,36b, R. Caputo80,
R. Cardarelli132a, T. Carli29, G. Carlino101a, L. Carminati88a,88b, B. Caron84, S. Caron103, E. Carquin31b,
G.D. Carrillo Montoya171, A.A. Carter74, J.R. Carter27, J. Carvalho123a,h, D. Casadei107, M.P. Casado11, M. Cascella121a,121b, C. Caso50a,50b,∗, A.M. Castaneda Hernandez171, E. Castaneda-Miranda171,
V. Castillo Gimenez166, N.F. Castro123a, G. Cataldi71a, A. Catinaccio29, J.R. Catmore29, A. Cattai29, G. Cattani132a,132b, S. Caughron87, D. Cauz163a,163c, P. Cavalleri77, D. Cavalli88a, M. Cavalli-Sforza11,
V. Cavasinni121a,121b, F. Ceradini133a,133b, A.S. Cerqueira23b, A. Cerri29, L. Cerrito74, F. Cerutti47, S.A. Cetin18b, F. Cevenini101a,101b, A. Chafaq134a, D. Chakraborty105, K. Chan2, B. Chapleau84, J.D. Chapman27, J.W. Chapman86,
E. Chareyre77, D.G. Charlton17, V. Chavda81, C.A. Chavez Barajas29, S. Cheatham84, S. Chekanov5,
S.V. Chekulaev158a, G.A. Chelkov64, M.A. Chelstowska103, C. Chen63, H. Chen24, S. Chen32c, T. Chen32c,
X. Chen171, S. Cheng32a, A. Cheplakov64, V.F. Chepurnov64, R. Cherkaoui El Moursli134e, V. Chernyatin24, E. Cheu6,
S.L. Cheung157, L. Chevalier135, G. Chiefari101a,101b, L. Chikovani51a, J.T. Childers29, A. Chilingarov70,
G. Chiodini71a, A.S. Chisholm17, R.T. Chislett76, M.V. Chizhov64, G. Choudalakis30, S. Chouridou136,
I.A. Christidi76, A. Christov48, D. Chromek-Burckhart29, M.L. Chu150, J. Chudoba124, G. Ciapetti131a,131b,
A.K. Ciftci3a, R. Ciftci3a, D. Cinca33, V. Cindro73, M.D. Ciobotaru162, C. Ciocca19a, A. Ciocio14, M. Cirilli86,
M. Citterio88a, M. Ciubancan25a, A. Clark49, P.J. Clark45, W. Cleland122, J.C. Clemens82, B. Clement55,
C. Clement145a,145b, R.W. Clifft128, Y. Coadou82, M. Cobal163a,163c, A. Coccaro171, J. Cochran63, P. Coe117,
J.G. Cogan142, J. Coggeshall164, E. Cogneras176, J. Colas4, A.P. Colijn104, N.J. Collins17, C. Collins-Tooth53,
J. Collot55, G. Colon83, P. Conde Mui˜no123a, E. Coniavitis117, M.C. Conidi11, M. Consonni103, S.M. Consonni88a,88b, V. Consorti48, S. Constantinescu25a, C. Conta118a,118b, G. Conti57, F. Conventi101a,i, J. Cook29, M. Cooke14,
B.D. Cooper76, A.M. Cooper-Sarkar117, K. Copic14, T. Cornelissen173, M. Corradi19a, F. Corriveau84, j, A. Cortes-Gonzalez164, G. Cortiana98, G. Costa88a, M.J. Costa166, D. Costanzo138, T. Costin30, D. Cˆot´e29, R. Coura Torres23a, L. Courneyea168, G. Cowan75, C. Cowden27, B.E. Cox81, K. Cranmer107, F. Crescioli121a,121b, M. Cristinziani20, G. Crosetti36a,36b, R. Crupi71a,71b, S. Cr´ep´e-Renaudin55, C.-M. Cuciuc25a, C. Cuenca Almenar174,
T. Cuhadar Donszelmann138, M. Curatolo47, C.J. Curtis17, C. Cuthbert149, P. Cwetanski60, H. Czirr140,
P. Czodrowski43, Z. Czyczula174, S. D’Auria53, M. D’Onofrio72, A. D’Orazio131a,131b, P.V.M. Da Silva23a,
C. Da Via81, W. Dabrowski37, A. Dafinca117, T. Dai86, C. Dallapiccola83, M. Dam35, M. Dameri50a,50b,
D.S. Damiani136, H.O. Danielsson29, D. Dannheim98, V. Dao49, G. Darbo50a, G.L. Darlea25b, W. Davey20,
T. Davidek125, N. Davidson85, R. Davidson70, E. Davies117,c, M. Davies92, A.R. Davison76, Y. Davygora58a,
E. Dawe141, I. Dawson138, J.W. Dawson5,∗, R.K. Daya-Ishmukhametova22, K. De7, R. de Asmundis101a,
S. De Castro19a,19b, P.E. De Castro Faria Salgado24, S. De Cecco77, J. de Graat97, N. De Groot103, P. de Jong104,
C. De La Taille114, H. De la Torre79, B. De Lotto163a,163c, L. de Mora70, L. De Nooij104, D. De Pedis131a,
A. De Salvo131a, U. De Sanctis163a,163c, A. De Santo148, J.B. De Vivie De Regie114, G. De Zorzi131a,131b, S. Dean76,
W.J. Dearnaley70, R. Debbe24, C. Debenedetti45, B. Dechenaux55, D.V. Dedovich64, J. Degenhardt119,
M. Dehchar117, C. Del Papa163a,163c, J. Del Peso79, T. Del Prete121a,121b, T. Delemontex55, M. Deliyergiyev73, A. Dell’Acqua29, L. Dell’Asta21, M. Della Pietra101a,i, D. della Volpe101a,101b, M. Delmastro4, N. Delruelle29, P.A. Delsart55, C. Deluca147, S. Demers174, M. Demichev64, B. Demirkoz11,k, J. Deng162, S.P. Denisov127, D. Derendarz38, J.E. Derkaoui134d, F. Derue77, P. Dervan72, K. Desch20, E. Devetak147, P.O. Deviveiros104,
A. Dewhurst128, B. DeWilde147, S. Dhaliwal157, R. Dhullipudi24,l, A. Di Ciaccio132a,132b, L. Di Ciaccio4,
A. Di Girolamo29, B. Di Girolamo29, S. Di Luise133a,133b, A. Di Mattia171, B. Di Micco29, R. Di Nardo47,
A. Di Simone132a,132b, R. Di Sipio19a,19b, M.A. Diaz31a, F. Diblen18c, E.B. Diehl86, J. Dietrich41, T.A. Dietzsch58a,
S. Diglio85, K. Dindar Yagci39, J. Dingfelder20, C. Dionisi131a,131b, P. Dita25a, S. Dita25a, F. Dittus29, F. Djama82,
T. Djobava51b, M.A.B. do Vale23c, A. Do Valle Wemans123a, T.K.O. Doan4, M. Dobbs84, R. Dobinson29,∗,
D. Dobos29, E. Dobson29,m, J. Dodd34, C. Doglioni49, T. Doherty53, Y. Doi65,∗, J. Dolejsi125, I. Dolenc73,
Z. Dolezal125, B.A. Dolgoshein95,∗, T. Dohmae154, M. Donadelli23d, M. Donega119, J. Donini33, J. Dopke29,