HAL Id: inserm-01155023
https://www.hal.inserm.fr/inserm-01155023
Submitted on 26 May 2015HAL is a multi-disciplinary open access
archive for the deposit and dissemination of sci-entific research documents, whether they are pub-lished or not. The documents may come from teaching and research institutions in France or abroad, or from public or private research centers.
L’archive ouverte pluridisciplinaire HAL, est destinée au dépôt et à la diffusion de documents scientifiques de niveau recherche, publiés ou non, émanant des établissements d’enseignement et de recherche français ou étrangers, des laboratoires publics ou privés.
Distributed under a Creative Commons Attribution| 4.0 International License
3D Morphological Analysis of Lacuno-canalicular
Network from SR Micro CT Images
Pei Dong, Galateia Kazakia, Max Langer, Pierre-Jean Gouttenoire, Cécile
Olivier, Françoise Peyrin
To cite this version:
Pei Dong, Galateia Kazakia, Max Langer, Pierre-Jean Gouttenoire, Cécile Olivier, et al.. 3D Mor-phological Analysis of Lacuno-canalicular Network from SR Micro CT Images. Journées RITS 2015, Mar 2015, Dourdan, France. pp 174-175. �inserm-01155023�
Actes des Journées Recherche en Imagerie et Technologies pour la Santé - RITS 2015 174
3D Morphological Analysis of Lacuno-canalicular Network from SR Micro CT
Images
Pei Dong
1, Galateia Kazakia
3, Max Langer
1,2, Pierre-Jean Gouttenoire
1,2, Cécile Olivier
1,2,
Françoise Peyrin
1,2*1
CREATIS, INSA-Lyon; Inserm, U1044; CNRS, UMR5220; Université de Lyon; Université Lyon 1; 69621, Lyon, France. 2
The European Synchrotron, X-Ray Imaging Group, 38043 Grenoble, France. 3
Musculoskeletal and Quantitative Imaging Research Group, University of California, San Francisco, USA *
email: [email protected]
Abstract – The osteocyte system have become a hot research topic due to the importance of the system in controlling the bone remodeling process. Among many micro-imaging techniques, the SR µCT imaging was demonstrated as a promising method to reveal the 3D structure of lacuno-canalicular network from our previous study. In this paper, we propose an image analysis scheme based on SR µCT images to extract 3D morphological parameter of LCN. Our method was successfully applied to human tibial cortical bone samples. The quantitative results show the consistence with the existed literature. We believe this method may open a new way in understanding the bone quality form the cellular level.
Index terms - Image Processing, X-Ray imaging.
I. INTRODUCTION
Despite of decades of research on skeletal disease, such as osteoporosis, the cause of the bone fragility at cellular level remains partially understood. Recent researches pointed out the importance of the osteocyte system in the bone remodeling process [1]. The osteocyte system forms a complex network in the bone matrix, housed within the so-called lacuno-canalicular network (LCN).
Limited quantitative 3D data have been reported on the LCN, due to the difficulties in imaging the LCN and in analyzing this network. Today, with the growing developments in 3D micro/nano imaging techniques, the assessment of the bone cell network is moving towards 3D investigations. Among these techniques, 3D synchrotron radiation micro-tomography (SR µCT) is a good candidate due to its high spatial resolution and high signal to noise ratio. In previous works, we have demonstrated the feasibility of imaging the LCN using SR µCT at the European Synchrotron (ESRF) [2]. This technique provides a relatively large field of view (FOV) with reconstructed image, containing up to a few thousands of bone cells, which is about one to two orders more than other 3D imaging techniques.
The complexity of the network and the large amount of bone cells within the 3D image require the development
of automated image analysis methods to quantify the morphology of the LCN.
In this work, we propose an image analysis scheme for the morphological analysis of the LCN from 3D SR µCT images.
II. MATERIALS AND METHODS II.1. Synchrotron radiation µCT Imaging
SR µ CT imaging was conducted on beamline ID19 at the ESRF with the setups described in [2]. The 3D image was reconstructed using a filtered back-projection algorithm, coupled with a single distance phase retrieval process. The reconstructed 3D image has (2048)3 voxels and a cubic voxel size of 300 nm, yielding a FOV of 6003µ m3. The method was applied to cortical bone samples cut from the tibial mid-diaphysis from different male and female donors (source: G Kazakia, University of California).
II.2. Image segmentation
The image preprocessing includes the segmentation of the bone volume, the osteocyte lacunae and their canaliculi. The segmentation of canaliculi is difficult since they can even be smaller than the voxel size. Here, we used a method based on a minimal path approach and geodesic voting briefly summarized [4]. After a connected component analysis performed to label each lacuna, a 3D Voronoi tessellation is generated from the gravity centers of the lacunae. The lacunar gravity centers are used as the starting points of the minimal paths and the end points are defined from the tessellation patches. The geodesic voting map is calculated by a fast marching propagation from the start point and a back propagation from the end points. The binarized canaliculi image is obtained by thresholding the geodesic voting map.
II.3. Quantification of the LCN
After segmentation, a number of bone tissue parameters are computed, such as the bone volume (BV) and tissue
175 Actes des Journées Recherche en Imagerie et Technologies pour la Santé - RITS 2015
volume ratio (BV/TV) and the number of bone cells (N.Lc), the bone cell number density (N.Lc/BV) [3] Then, we extracted a number of descriptors from each lacuna, including the lacunar volume (Lc.V), lacunar surface area (Lc.S), lacunar length (Lc.L1), lacunar width (Lc.L2), and lacunar depth (Lc.L3), and lacunar structure model index ( ) [3]. To quantify the canaliculi, we calculated the number of the canaliculi (Lc.NCa) at several designated distances (r) from the surface of lacunae showing the branching of the canaliculi [5].
III. RESULTS
The proposed method was successfully applied to cortical bone samples described in II.1. For illustration, we present results on a sample from a man donor, age 29 years old. The processing was applied to a selected volume of interest (VOI) of 800x800x600 voxels.
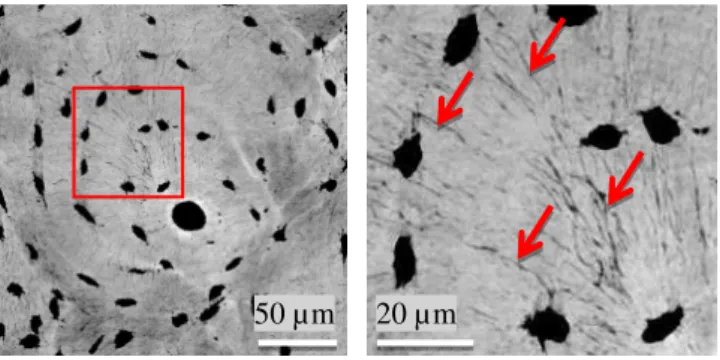
Figure 1 shows a mini MIP image of 100 SR µCT slices and a zoom showing the canaliculi in the gray level images. The segmented LCN is shown in Figure 2. The quantitative statistical results on the selected VOI are reported in Table 1.
Figure 1: Minimal intensity projection of 100 slices from the reconstructed images. a): A cropped osteon region (800x800 voxels). The big black pore in the center of the image indicates the Haversian canal. b): a zoom on several lacunae (ellipsoidal black pore) and the canaliculi (illustrated by the red arrows)
Figure 2: A 3D rendering of the segmented LCN around an osteon. The yellow lacunae and the green canaliculi distribute
concentrically around the white Haversian canal.
Parameters Value Parameters Value
N.Lc (#) 155 Lc.L1(µm) 21.3 ± 5.7 BV/TV 99.6% Lc.L2 (µm) 9.9 ± 2.0 N.Lc/BV (#/mm-3) 15009 Lc.L3 (µm) 4.8 ± 1.3 Lc.V (µm3) 448 ± 134 Lc.SMI 3.2 ± 0.4 Lc.S (µm2) 418 ± 85 Lc.NCa (r=1.5 µm) 32.2 ± 13.1 Table 1
:
Descriptive statistical results of the morphologicalparameters of the LCN. (average ± standard deviation)
IV. DISCUSSION – CONCLUSION
We proposed a scheme to extract 3D morphological parameters on lacunae and canaliculi from SR µCT images at submicrometric spatial resolution. Compared to other techniques, our method allows extracting LCN parameters in 3D from large bone cell populations without any model assumptions. The results are consistent with the literature [6], [7]. Since no ground truth exists due to the uniqueness of these images, the segmentation was mainly evaluated by visual grading. Since the method is automatic, it can be used to extract features of the LCN on large series of samples, and then is expected to provide insight into the properties of bone at the cellular level.
ACKNOWLEDGMENTS
This work was performed within the framework of the LabEx PRIMES (ANR-11-LABX-0063) of Université de Lyon, within the ANR program (ANR-11-IDEX-0007).
REFERENCES
[1] L. F. Bonewald, “The amazing osteocyte,” J. Bone Miner. Res. Off. J. Am. Soc. Bone Miner. Res., vol. 26, no. 2, pp. 229–238, Feb. 2011.
[2] A. Pacureanu, M. Langer, E. Boller, P. Tafforeau, and F. Peyrin, “Nanoscale imaging of the bone cell network with synchrotron X-ray tomography: optimization of acquisition setup,” Med. Phys., vol. 39, no. 4, pp. 2229–2238, 2012. [3] P. Dong, S. Haupert, B. Hesse, M. Langer, P.-J.
Gouttenoire, V. Bousson, and F. Peyrin, “3D osteocyte lacunar morphometric properties and distributions in human femoral cortical bone using synchrotron radiation micro-CT images,” Bone, vol. 60, pp. 172–185, Mar. 2014. [4] M. A. Zuluaga, M. Orkisz, P. Dong, A. Pacureanu, P.-J.
Gouttenoire, and F. Peyrin, “Bone canalicular network segmentation in 3D nano-CT images through geodesic voting and image tessellation,” Phys. Med. Biol., vol. 59, no. 9, pp. 2155–2171, May 2014.
[5] P. Dong, A. Pacureanu, M. A. Zuluaga, C. Olivier, Q. Grimal, and F. Peyrin, “Quantification of the 3D Morphology of the Bone Cell Network from Synchrotron Micro-CT Images,” Image Anal. Stereol., vol. 33, no. 2, pp. 157–166, Jun. 2014.
[6] T. Beno, Y.-J. Yoon, S. C. Cowin, and S. P. Fritton, “Estimation of bone permeability using accurate microstructural measurements,” J. Biomech., vol. 39, no. 13, pp. 2378–2387, 2006.
[7] D. Sharma, C. Ciani, P. A. R. Marin, J. D. Levy, S. B. Doty, and S. P. Fritton, “Alterations in the osteocyte lacunar-canalicular microenvironment due to estrogen deficiency,” Bone, vol. 51, no. 3, pp. 488–497, Sep. 2012.
50 µm 20 µm
~ 50 µm