HAL Id: cea-02339876
https://hal-cea.archives-ouvertes.fr/cea-02339876
Submitted on 5 Nov 2019
HAL is a multi-disciplinary open access
archive for the deposit and dissemination of
sci-entific research documents, whether they are
pub-lished or not. The documents may come from
teaching and research institutions in France or
abroad, or from public or private research centers.
L’archive ouverte pluridisciplinaire HAL, est
destinée au dépôt et à la diffusion de documents
scientifiques de niveau recherche, publiés ou non,
émanant des établissements d’enseignement et de
recherche français ou étrangers, des laboratoires
publics ou privés.
complexes by paramagnetic NMR spectroscopy
M. Autillo, L. Guerin, T. Dumas, M. Grigoriev, A. Fedoseev, S. Cammelli, Pl.
Solari, D. Guillaumont, P. Guilbaud, P. Moisy, et al.
To cite this version:
M. Autillo, L. Guerin, T. Dumas, M. Grigoriev, A. Fedoseev, et al.. Insight of the metal-ligand
interaction in f elements complexes by paramagnetic NMR spectroscopy. Chemistry - A European
Journal, Wiley-VCH Verlag, 2019, 25, pp.4435 -4451. �cea-02339876�
Insight of the metal-ligand interaction in f elements complexes by
paramagnetic NMR spectroscopy
Matthieu Autillo,
[a]Laetitia Guerin,
[a]Thomas Dumas,
[a]Mikhail S. Grigoriev,
[d]Alexandre M.
Fedoseev,
[d]Sebastiano Cammelli,
[c]Pier Lorenzo Solari,
[c]Dominique Guillaumont,
[a]Philippe
Guilbaud,
[a]Philippe Moisy,
[a]Hélène Bolvin,*
[b]and Claude Berthon*
[a]Abstract: The magnetic properties of Ln(III) and An(III) complexes
formed with dipicolinate ligands have been studied by NMR spectroscopy. To know precisely the geometry of these complexes, a crystallographic study by single-crystal X-Ray Diffraction (XRD) and by Extended X-Ray Absorption Fine Structure (EXAFS) in solution was performed. Several separation methods of paramagnetic shifts observed on the NMR spectra were applied to these complexes. Methods using several nuclei of the dipicolinate ligands revealed an abrupt change in the geometry of the complexes and a metal-ligand interaction in the middle of the lanthanide series. The study of paramagnetic shifts with temperature demonstrated that higher order terms in the dipolar and contact contributions are required especially for the lightest Ln(III) cations and almost all studied An(III). The Bleaney’s parameters <Sz>a and related to
the contact and dipolar terms respectively were deduced from experimental data and compared to ab-initio calculations. A quite good agreement is found for <Sz>a and temperature
dependences. However values obtained from cation magnetic anisotropy calculations lead to some differences with Bleaney equations defined for Ln(III). Other parameters such the crystal field parameter and the hyperfine constants Fi obtained from
experimental data with [An(ethyl-DPA)3]3- complexes are at odds
with assumptions underlying Bleaney’s theory.
1. Introduction
The chemistry of actinide elements in solution has been the subject of many studies, particularly in order to understand the
behavior difference between actinides and lanthanide elements in oxidation state +III (noted An(III) and Ln(III) respectively). These researches, carried out as part of nuclear fuel recycling, have led to attribute this difference to a higher covalent character in the actinide complex formation.[1] Despite numerous efforts to prove and quantify this phenomenon, it remains difficult to clearly interpret the chemical properties of these elements in solution. The study of the actinides paramagnetic behavior can be a "simple" method to analyze their electronic properties and to obtain information on the ligand-actinide interaction.
The paramagnetic properties of Ln(III) cations have been extensively studied by NMR spectroscopy.[2] The presence of a paramagnetic ion in a coordination complex induces an additional chemical shifts and line broadening. This feature depends both on the nature of the paramagnetic element and on the observed nucleus by NMR. The induced chemical shift is exploited to perform structural analysis of Ln(III) complexes so that the paramagnetic element is also known as paramagnetic probe.[2b, 3] The experimental chemical shift (Δtot)i,a for the observed nucleus i of a ligand in a complex with a lanthanide a arises from three independent contributions: i) a contribution related to the sample magnetic susceptibility (δbulk)a, ii) a
diamagnetic contribution (δdia)i,a and iii) a paramagnetic
contribution (δpara)i,a and therefore it can be written as:
(Δ ( ( (
The contribution due to the sample magnetic susceptibility
(δbulk)a affects all nuclei in an identical manner and is usually
overcome by introducing an internal reference in the medium for which the characteristic signal undergoes a similar shift to the studied complex.
The diamagnetic contribution (δdia)i,a arises from the
redistribution of the electron density within the ligand after the complexation with Ln(III) ion. It is generally low compared to the paramagnetic shifts and can be considered negligible in many cases with the exception of close or directly linked nuclei to the Ln(III) ion.[4] However, this component can be easily estimated by measuring the experimental chemical shift of a nucleus i for an isostructural diamagnetic complex. In the case of lanthanide complexes, analogs compounds of La(III) or Lu(III) will be used assuming that this term is identical for all the other lanthanides. This assumption seems reasonable because the chemical shifts induced by lanthanum (lightest) and lutetium (heaviest) are generally very similar.[5] For the An(III) cations, isostructural compounds of La(III) and Lu(III) will be also used to overcome the unfeasibility to analyze Ac(III) complexes.
The paramagnetic contribution (δpara)i,a is due to the
interaction between the electronic magnetic moment of the metal center a and the nuclear spins i of the ligand. It is the sum of two components:
[a] Dr M. Autillo, L. Guerin, Dr. T. Dumas, Dr. P. Guilbaud, Dr. C. Berthon, Dr. P. Moisy
CEA, Nuclear Energy Division, Research Department of Mining and Fuel Recycling Processes, BP 17171, F-30207 Bagnols sur Cèze, France
E-mail: claude.berthon@cea.fr
[b] Dr. H. Bolvin
Laboratoire de Physique et de Chimie Quantiques
Université Toulouse 3, 118 Route de Narbonne, 31062 Toulouse, France.
E-mail: bolvin@irsamc.ups-tlse.fr
[c] S. Cammelli, P-L Solari
Synchrotron SOLEIL, L’orme des Merisiers, Saint Aubins, BP 48, F-91192, Gif sur Yvette cedex, France.
[d] M.S. Grigoriev, A.M. Fedoseev, A.N. Frumkin Institute of Physical Chemistry and Electrochemistry, Russian Academy of Sciences, Moscow, 119071, Russia.
Supporting information (SI) for this article is given via a link at the end of the document. It contains X-ray and EXAFS datafor An3+
/Ln3+
complexes, 1
H and 13C paramagnetic shifts, exploitation of 1H and 13C chemical shifts by one nucleus methods, of 13Cchemical shifts by the three nuclei method and paramagnetic shifts variation with temperature.
(1)
- a contact component (δc)I,a related to the delocalization of
the spin density of the paramagnetic cation a towards the nucleus i through the chemical bond;
- a dipolar or pseudocontact component (δpc)i,a associated
with the through-space dipolar interaction between the electronic and the nuclear magnetic moments of the paramagnetic center a and the nucleus i.
After subtracting the diamagnetic contribution and the contribution due to the sample magnetic susceptibility, the paramagnetic chemical shift (δpara)i,a for a nucleus i and a
lanthanide a can be expressed as:
( ( (
(
Then, components (δc)i,a and (δpc)i,a may be expressed as the
product of several terms related to the lanthanide ion a and the nucleus i according to the equation:
where is the axial ligand field parameter of 2nd order,
is a magnetic constant at a given temperature (also called dipolar coupling) which measures the axial magnetic anisotropy of a paramagnetic ion (a) (calculated by Bleaney for Ln3+),[6] is proportional to the electron-nucleus hyperfine coupling constant (expressed in MHz) and is the thermal average of the electron spin magnetization along the external magnetic field (calculated for Ln3+).[7] Finally, is the geometric
factor of the nucleus of interest containing complex structural information. In the case of a cylindrical symmetry, it can be defined by the following equation:
where ri is the Ln-nucleus i distance and θi is the angle between
the Ln-nucleus i vector and the main axis of the magnetic susceptibility tensor.
Eq. (4) is based upon a series of assumptions made by Bleaney that have been scrutinized up until recently.[8] Within this approach, the magnetic moment of the unpaired electrons is approximated by a point dipole at the metal position, the magnetic anisotropy axis aligns along the main molecular Cn
axis, the ligand field splitting is much less than kT (200 cm-1 at
room temperature) and the contribution of ligand field at higher order terms are ignored. From these two latter assumptions, it comes out the total angular momentum of the cation J is implicitly supposed to be a good quantum number so that the Bleaney’s constant only depends on the cation a and not on the ligand. Since its application over more than 40 years, it is still difficult to find out why NMR studies with some lanthanides complexes are consistent with these simplifications[9] while
others not[10] [11]. Albeit Bleaney’s theory effectiveness could
appear lower than recent quantum mechanical treatments[12] we
have undertaken to evaluate to what extent the ligand field could skew the Bleaney’s theory using An(III) instead of Ln(III) with 2,6-dipicolinic acid (DPA). Due to the larger radial extent of 5f orbitals than 4f ones, a larger covalence and ligand field effects are expected so that the applicability or validity of Bleaney’s equation may be questioned. It also could be an opportunity to get a better insight on covalent behavior of An/Ln cations through Bleaney’s parameters.
In order to determine the covalent part in the coordination bonds and to characterize three-dimensional structure of actinide complexes in solution, the major difficulty is to separate the two contributions (δc)i,a and (δpc)i,a of the paramagnetic chemical shift
(δpara)i,a. Various separation techniques have been evaluated by
Reilley[3f] in 1976 for Ln(III) cations. Several methods consider either a pure dipolar or a pure contact[13] chemical shift while other ones exploit their temperature dependence.[3c, 3f] A more stringent method is to evaluate data for different Ln(III) across an isostructural series by using the tabulated lanthanide constants and .[3d, 3g, 3h, 5, 14] Unfortunately these constants do not exist for the An(III) series and it would be of interest to evaluate them. By comparing with those of the Ln series these parameters could be relevant as a covalency scale, assuming the Bleaney’s theory still applicable.
In this work, several methods are applied to the study of Ln(III) and An(III) complexes with ethyl-DPA ligand (Scheme 1). This ligand provides more 13C and 1H NMR signals far from the
paramagnetic center than the commercial DPA. However the ethyl group is flexible, so structural information gained from XRD at solid state would not be representative from NMR conformations in liquid state. For this reason XRD studies were performed on Ln(III) and An(III) DPA ligand.
N
OH
O
O
OH
CH
3Scheme 1. Ethyl-DPA ligand (4-ethyl-2,6-dipicolinic acid).
Like the Ln(III), An(III) ions form stable 1:3 complexes with the DPA ligand leading to rigid structures in solution. Thus, these An(III) compounds can be isolated and their structure determined by XRD in solid state and EXAFS in solution. This ensures the structural information from solid state is proper for NMR analysis in solution. A complete crystallographic study has been first performed and we have secondly checked the structure is kept the same along the series. Then, based on several separation methods of experimental data and the contribution of quantum chemical calculations, terms only depending on the An(III) cations in the Eq. (4) have been determined and discussed.
2. Results and Discussion
2.1. Structural study
In solid state, the compounds Ln/An(DPA)3(C3H5N2)3•3H2O (Ln
= La - Lu and An = Pu, Am) are isostructural along the series and crystallize in a triclinic space group (refer to SI and cif files). The coordination sphere contains three DPA ligands forming a tricapped trigonal distorted prism. Each ligand is tridentate and coordinated to the Ln(III) / An(III) cation by the nitrogen atom of the pyridine cycle (capped position) and the two (2) (3) (4) 1 2 3 4 5 6 (5)
oxygen atoms of the carboxylate groups (prism position). The charge compensation of the anionic complexes is provided by three imidazolium cations and three water molecules are included into the structure (crystallographic data and structure determination details are given in Table S8).
Since the Ln(III) and An(III) complexes are isostructural with a coordination number of 9, one may analyze the influence of the 4f/5f orbitals in the bonding between the metal ion and the ligands. First, Ln/An - O and Ln/An - N bond lengths decrease along the lanthanide and actinide series accordingly to the decrease in ionic radius (Figure 1). It is noteworthy that Am(III) - N and Am(III) - O distances found in literature for DPA compounds are in agreement with our X-ray results.[15] While the curves for An(III) - O and Ln(III) - O place on the top of each other the curve for An(III) - N lies below than for Ln(III) - N. Hence nitrogenous bonds are more sensitive to An/Ln differences than the carboxylate group. For a given ionic radius, the shorter the distance the more covalent character the bond is. This has already been observed in other series of isostructural complexes.[16] This observation is often attributed to a larger degree of covalence for the actinide cations and related to ligand selectivity.
Figure 1: Bond length M – O and M – N of the coordinating atoms in M(DPA)3(C3H5N2)3•3H2O versus the ionic radius for M=Pu(III), Am(III) from this
work and from Cary et al. [15] for Cm(III). The ionic radii have been determined by D’Angelo et al. for Ln(III) cations[17]
and by David et al. for An(III) cations.[18]
EXAFS spectra were recorded at the LIII edge of Pr(III), Dy(III)
and Yb(III) to ensure the crystallographic structure conservation (stoichiometry and bond length in the coordination sphere) along the series of the dipicolinate complexes in solution (DMSO). The spectra and the corresponding Fourier transforms are presented in Supporting Information (SI hereafter). The diffusion paths have been calculated with the FEFF program[19] from the
crystallographic data of Ln(DPA)3(C3H5N2)3•3H2O compounds.
The parameters of the experimental spectra adjustment procedure, described in experimental section are presented in SI. The Fourier transform shows a dominant peak from the contribution of oxygen (OI) and nitrogen (N) of the first
coordination sphere followed by three peaks of lower amplitude corresponding to successively carbon atoms of carboxylate group (CI), pyridine ring (CII) and the second oxygen atom of the
carboxylate group (OII) (Figure 2). By comparing the results
obtained by monocrystal XRD and EXAFS fitting, we confirm that the structure of Ln(III) complexes is stable in DMSO solution. Based on these results, it can be considered that the crystallographic structure of the An(ethyl-DPA)33- complexes is
maintained in solution. To confirm this hypothesis, this study was extended to the actinide elements. However, for plutonium(III), a rapid oxidation occurs under X-ray measurements. The acquisition of statistically satisfactory EXAFS data has therefore been carried out on Am(III) complex. The EXAFS spectrum obtained at LIII edge of americium and the
corresponding Fourier transform are shown in Figure 2. The simple and scattering paths have been calculated on the basis of the crystallographic data of Am(DPA)3(C3H5N2)3•3H2O
compound and parameters of the spectra adjustment procedure are summarized in SI with comparison to XRD metric parameters.
The agreement between the X-ray crystallographic and EXAFS results in DMSO solution validates the use of the crystallographic structure of Ln(III) and An(III) complexes to calculate the structural parameters.
Figure 2. EXAFS experimental (solid line) spectra of [Am(ethyl-DPA)3]3- in solution (a) and the corresponding Fourier transform (b). The best fit is represented with red circles.
No crystal structures are available for [Ln/An(ethyl-DPA)3]
3-complexes and structural information on the ethyl chain nuclei of the ligand are not available. As mentioned above, the ethyl chain is highly moveable in solution and the crystalline organization of a solid compound would not be representative of these movements. To approach an average position of the ligand in solution, a sampling of ethyl chain positions was performed by Molecular Dynamics (MD) calculations based on the crystal structures of Ln/An(DPA)3(C3H5N2)3•3H2O: The Ln(III) and An(III)
cations surrounded by the DPA ligand were kept motionless all along the simulation in agreement with the XRD and EXAFS first shell structure. Only the ethyl chain was considered mobile in order to extract structural information ( and r, see Eq (5)) 2,40 2,45 2,50 2,55 2,60 2,65 1,13 1,15 1,17 1,19 1,21 B ond le ngth (Å ) IR (Å) Ln(III) M-O An(III) M-O Ln(III) M-N An(III) M-N Nd Cm Pu Pr Sm Am -5 -4 -3 -2 -1 0 1 2 3 4 5 0 2 4 6 8 10 12 χ (k ).k 3 k (Å-1) 0 1 2 3 4 5 6 0 1 2 3 4 5 6 7 8 F T m a g n it u d e ( u . a .) R+Φ (Å) OI OII CI CII Am O N C OI + N OII CI CII (a) (b)
averaged over 5000 snapshots from MD trajectories. Regarding Cm(III) and Cf(III) complexes of ethyl-DPA, MD calculations were performed from published An(HDPA)3•H2O XRD data[15].
and enantiomers lead to very similar structural parameters (see Table S5). As Cary et al. mentioned we observed that co-crystallized water molecules induce distortions for one of the three DPA into the enantiomers. Strained DPA were excluded from Gi calculations.
2.2. 1H and 13C paramagnetic shift study
1
H and 13C NMR spectra of [Ln/An(ethyl-DPA)3]3- were obtained
in DMSO-d6 solution. The paramagnetic induced shift of Ln(III) and An(III) cations were deduced using the complex [La(ethyl-DPA)3]3- as diamagnetic reference. A summary of the chemical
shift values are given in SI (Table S2) at room temperature. The
13
C signals of the Cm(III) complex were not observed due to the important line broadening induced by this cation associated with the low radioactive element concentration.
The different methods commonly used with Ln(III) complexes to separate the contact and dipolar contributions have been applied to An(III) compounds. Isostructurality, field ligand and hyperfine coupling constancy along Ln(III) and An(III) cation series are valuable information that can be deduced. Bleaney’s constants and will be deduced hereafter from temperature experiments.
Paramagnetic shift vs. geometric term:
For the 1H NMR spectra of organic molecules, shifts induced by paramagnetic lanthanides are generally assigned to the dipolar interaction with the exception of aromatic systems.[2a] For this reason, contact contributions are expected in the proton chemical shifts of the ethyl-DPA owing to the pyridine cycle. Nevertheless, protons of the ethyl group branched on the pyridine are far away from the paramagnetic center (5 bonds away) and then are assumed to have a negligible contact contribution. In this case, the 2nd term of Eq. (4) disappears and the ratio between the shifts of two 1H nuclei (i and j) in the sample complex simplifies to the ratio of the geometrical factors:
Table 1 compares these ratio deduced from chemical shifts
and from geometrical parameters for Ln(III) and An(III) ethyl-DPA complexes. Geometrical factors are deduced from crystallographic data and molecular dynamic calculations while paramagnetic chemical shifts are obtained at
298K in DMSO-d6.
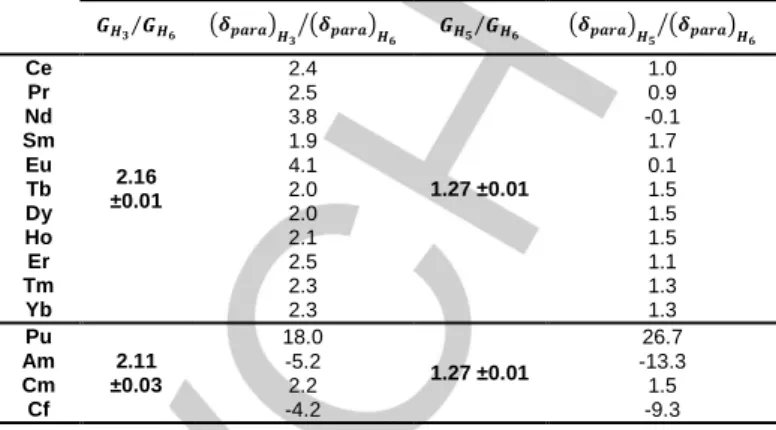
Table 1. Ratios of Eq. (6) between geometric factors deduced from structural
data (H3) and molecular dynamic calculations (H5 and H6) for La, Ce, ,Pr, Nd,
Dy, Er, Yb, Pu and Am complexes), and between proton paramagnetic shifts at 298K of [Ln/An(ethyl-DPA)3]3- complexes. Ratios are given for two pairs of
protons H3-H6 and H5-H6 as labelled Scheme 1.
Ce 2.16 ±0.01 2.4 1.27 ±0.01 1.0 Pr 2.5 0.9 Nd 3.8 -0.1 Sm 1.9 1.7 Eu 4.1 0.1 Tb 2.0 1.5 Dy 2.0 1.5 Ho 2.1 1.5 Er 2.5 1.1 Tm 2.3 1.3 Yb 2.3 1.3 Pu 2.11 ±0.03 18.0 1.27 ±0.01 26.7 Am -5.2 -13.3 Cm 2.2 1.5 Cf -4.2 -9.3
The results obtained for the Ln(III) complexes are different along the series. First, for the first half of the series (from Ce(III) to Eu(III)), a significant difference between the geometric factors ratios and the chemical shifts ratios is observed. This suggests that a contact term appears up to six bonds from the paramagnetic center or that Eq. (4) does not properly describe the dipolar contribution. Conversely, a better agreement is found for the cations of the second part (from Tb(III) to Yb(III)) suggesting a low contact contribution. We can imagine that either a slight conformational change occurs in the middle of the Ln(III) series or that the increasing J (total angular momentum quantum number) value toward the end of the series makes the dipolar contribution greater and then less sensitive to the contact contribution.
Regarding An(III) cations, higher modifications are found between the calculated geometric and the experimental chemical shifts ratios. These deviations seem to show that a significant contact contribution is extended up to 6 bonds from the paramagnetic center for An(III) cations with An = Pu, Am and Cf. This can be related to a larger covalence which was otherwise observed through 15N NMR experiments[20]. On the contrary, the experimental chemical shifts ratios are close to the theoretical ratios for Cm(III) pointing out the observed paramagnetic chemical shifts are mainly dipolar for this cation. Conversely to the Ln(III) series it can be noted that the paramagnetic shifts induced by the actinide cations do not monotonically vary with the cation-proton distance. For example, the largest chemical shift appears on the H3 protons for Cm(III)
while it appears on H5 protons for the Pu(III), Am(III) and Cf(III)
complexes (See Table S2).
To check whether observed deviations are not due to a geometric variation of the complexes in solution. an analysis method using the paramagnetic shifts of two nuclei i and k within the same metallic complex a has been proposed.[14b]
(
This equation assumes the ligand field parameter constant along the cation series. Rik , the ratio between Gi and Gk of nuclei i and
k as defined in Eq. (6), can be obtained from the plot of (δpara)i,a
/<Sz>a versus (δpara)k,a /<Sz>a within the cation series i . So, every deviation from linearity along the series can be attributed to a structural change affecting Gi or variations in the ligand field.
(6)
Because <Sz>a values for actinide cations are not known this
study is performed only with the complexes formed with the Ln(III) cations (Figure 3). The plots for two pairs of protons H3/H5 and H5/H6 show linear variations excluding any drastic
change of the geometric ratios along the Ln series. This
could be explained by the division of the experimental paramagnetic shifts by <Sz>a smoothing the variation of the geometric factor ratio previously obtained in Table 1. One deduces from the intercepts that the hyperfine coupling constants do not change along the Ln series for the protons. However Eq. (7) plotted for carbons and proton H6 pairs exhibit
two kinds of straight lines along the Ln series (Figure S10). The slopes for the lightest Ln (Ce to Eu) and the heaviest ones (Tb to Yb) are parallel, except for carbons C2 and C6 where the plots
show a poor correlation for the lightest Ln(III). It can be concluded that the values depend on light or heavy Ln(III) while the geometric factor Gi does not change along the Ln
series.
Separation of contact and dipolar shifts, one nucleus method:
Separation methods[3f], using the chemical shifts induced by the
lanthanide cations for a group of complexes are based on rearrangements of Eq. (4) in two equations:
Based on the following assumptions: 1- Fi and Gi are
independent of the Ln(III) ion a; 2- the crystal field parameter is invariant along the series; 3- theoretical values of <Sz>a and CaD
are known, the graphic representation of Eqs. (8) and (9) for a given nucleus i and varying the Ln center a are linear and the slopes provide the dipolar and contact terms respectively. It has been shown that the use of Eq. (8) provides better accuracy for the determination of the crystal field parameter while Eq. (9) is more appropriate to determine [21]
. Both equations are applied hereafter to the [Ln(ethyl-DPA)3]
3-series.
Figure 3. Plot of Eq. (7) for [Ln(ethyl-DPA)3]3- in DMSO-d6 (at 298K). (a) H3
vs H6 and (b) H5 vs H6.
Determination of A20<r2> parameter:
The plot of Eq. (8), presented in SI (Figure S2), shows an excellent linearity (R > 0.99) except for Sm(III) and Ce(III) cations particularly for proton H5. As expected the ratio of H3 and
H5 slopes divided by the H6 one leads to = 2.20 and =1.37 which are in good agreement
with the values of Table 1. This validates the hypothesis that
the crystal field parameter is almost invariant along the lanthanide series in the ethyl-DPA. The crystal field parameter deduced from the slope and the geometrical factor defined in Eq. (5) for each proton are given in Table 2 ; This constancy observed along the series (Ce – Yb) contrasts somewhat with some studies including macrocyclic ligands (DOTP).[14c] Indeed, the study of heavy lanthanides (Tb – Yb) revealed a parameter different for each cation. However, the crystal field induced by this highly complexing ligand was found about 50 times higher than in our study. It can therefore be considered that a lower crystalline field can lead to smooth the modifications observed in the study of [Ln(DOTP)] 5-complexes. Moreover, parameters were calculated by these authors, considering that the chemical shifts of 1H nuclei
were only dipolar which is not fully established. This assumption can be at the origin of the observed variations which are not linear along the series.
y = 2.188x - 0.102 R= 0.9990 -2,5 -2,0 -1,5 -1,0 -0,5 0,0 0,5 1,0 1,5 2,0 -1,0 -0,5 0,0 0,5 1,0 ( dpar a )3H /< Sz >a (dpara)H6/<Sz>a Sm Tb Ho Dy Nd Eu Er Pr Ce Tm Yb y = 1.360x + 0.093 R = 0.995 -1,5 -1,0 -0,5 0,0 0,5 1,0 1,5 -1,0 -0,5 0,0 0,5 1,0 ( dpar a )5H /< Sz >a (dpara)H6/<Sz>a Sm Tb Ho Dy Nd Eu Er Tm Yb Pr Ce 2 5 6 4 1 3 (a) (b) N OH O O OH CH3 (8) (9)
The plots of Eq. (8) for 13C C
1-C6 are presented in Figure S3.
Unlike 1H nuclei, there is no clear linear trend for the whole series (Ce – Yb) but one finds a good linear regression for the six heaviest cations (from Tb to Yb) and a different one for three of the lightest ones (Pr, Nd and Sm), Ce and Eu being for most plots out of these lines. This can mean a change in the crystal field parameter A20<r2> or a variation of geometric term Gi
between the beginning and end of series. However, the first elements are described by only three cations and changes seem to occur for Ce(III) and Eu(III) which can lead to uncertainties in determining the crystal field parameter. Therefore, the crystal field parameter was calculated only with results achieved on the heaviest cations (from Tb to Yb). The crystal field values (Table
2) reveal a good agreement with the 1H NMR study that confirms the value of this parameter for the Ln(III) cations. It may be noted that the 13C spectral width is greater than that of the 1H, therefore enhancing differences that could have appeared negligible in the 1H study.
Table 2. A20<r2> crystal field coefficient (in cm-1) of [Ln(ethyl-DPA)3]
3-complexes deduced from the slopes Figure S2 and S3 and for a given nucleus (4th column) and averaged for all 1H and all 13C (last column).
A20<r2> Ln3+ 1H H3 51.6 52 (±1) H5 52.5 H6 49.0 Tb3+ – Yb3+ 13 C C3 44.6 51 (±4) C4 55.4 C5 49.8 C6 54.2 Determination of Fi parameters:
(δpara)i,a/CaD versus <Sz>a/CaD is plotted in Figure S4 for 1H nuclei
and in Figure S5 for 13C nuclei for the whole lanthanide series. According to Eq. (9), these plots should be linear and the slope gives the value of Fi for the nucleus of interest. The points for the
1H in Ce(III) and Eu(III) cations lie out and were not considered
to determine the Fi terms. In all cases, two straight lines are
obtained, one for the 1st part (Pr – Sm) and another one for the
2nd part (Tb – Yb) of the series. Better correlations are found for
13
C than for 1H data due to higher Fi parameters for carbon
nuclei. Fi deduced from these plots are tabulated in Table 3.
The break of slope in the middle of the series is often observed and usually assigned to a change in Fi and A20<r2> parameters
induced by structural changes.[2b] However we deduced from the
previous section that the crystal field parameter A20<r2> may be
considered invariant along the series. Moreover the crystallographic study by single-crystal XRD shows that [Ln(ethyl-DPA)3]3- complexes are isostructural along the series.
The small decrease observed on bonds length Ln - O and Ln - N along the series leads to a geometric parameter variation almost invisible which cannot explain this drastic change. In 2002, Ouali
et al. have tried to explain this slope break for lanthanide
complexes with dipicolinic acid by a rapid oscillation of the pyridine cycle at the NMR time scale.[5a] However, the
agreement between the results obtained by MD simulations and the chemical shifts analysis do not show such flexibility of our complexes and therefore do not confirm the impact of this phenomenon.[5b, 14a, 14b] Furthermore, this break occurs always in the middle of the series (Eu – Tb).[5, 14a, 14b, 22] It can thus be considered that a change in the electronic structure could lead to a variation in the hyperfine coupling constant in the [Ln(ethyl-DPA)3]3- complex.[5b]
Table 3. Fi parameters (dimensionless) obtained from the (δpara)i,a/CaD versus <Sz>a/Ca
D
plots of 1H and 13C paramagnetic shift for [Ln(ethyl-DPA)3] 3-. Tb – Yb Ce – Eu 1 H H3 0.035 -0.016 H5 0.094 0.210 H6 0.038 0.055 13 C C1 -1.303 2.447 C2 -0.192 0.360 C3 -2.728 -4.384 C4 1.303 1.642 C5 -0.187 -0.422 C6 0.192 0.450
Separation of contact and dipolar shifts, three nuclei method:
In 2001, Geraldes et al. proposed an analysis method of paramagnetic shift independent of <Sz>a and CaD theoretical values.[14a, 23] This method is particularly interesting in this case because the constancy of Fi and Gi parameters can be checked
along a series of cations without a prior knowledge of theoretical
<Sz>a and CaD values (unknown for the actinides) and
independently of the crystal field parameter A20<r2>. It is based
on the exploitation of experimental data obtained on three nuclei
i, j and k of the same metallic complex by the following
equations: ( ( ( ( defined in Eq. (6). Study of 1H nuclei:
The plot of Eq. (10) for 1H nuclei shows a slight difference between the light and heavy lanthanides as shown in Figure 4. This variation can be assigned to the Fi change along the
lanthanide series like previously observed.
Regarding An(III) cations, it can be noted that a straight line (Figure 4) fits nicely the 1H paramagnetic shifts. This feature
indicates that a single set of parameters Gi and Fi allows to
describe the properties of these cations. Since the An(ethylDPA) series is isostructural to the Ln(III) one ( and
), the strong difference between these two cation series is due to Fi values: they are different from the Ln(III) one and are
constant along the series (at least from Pu to Cf). Unfortunately this method does not provide quantitative values of Fi.
Figure 4. Plots of (δpara)H5 / (δpara)H6 vs. (δpara)H3 / (δpara)H6 for
[Ln(ethyl-DPA)3]3- (up) and [An(ethyl-DPA)3]3- (down) in DMSO (at 298K). Eu(III) is
excluded from the linear regression calculation of light Ln(III).
Study of 13C nuclei:
The study of 13C chemical shifts by this method reveals a much more marked difference between heavy and light Ln(III) cations (Figure S6). The values of α and β terms determined by this method and summarized in Table 4 are in quite good agreement with the values calculated from Eq. (10) with Fi and Gi
parameters terms determined previously (See Table S5 for Gi
values). Main differences occur for α values with the lightest Ln and β values of C1 nucleus. The first remark could be related by
a defect in Bleaney’s approach of the dipolar contribution in the lightest Ln(III) series as we mentioned previously while the second could be due to a structural change close to the metal center since we already have taken into account the Fi change.
Regarding the 13C paramagnetic shifts of An(III) complexe, only three cations (Pu, Am and Cf) have been studied because the Cm(III) induces animportant line broadening preventing analysis. It can be noted that straight lines describe pretty well the chemical shift evolutions although a slight deviation appears on C3 and C4 nuclei (Figure S6).
To support the structural change assumption, a sampling of the structure of [Dy(ethyl-DPA)3]3- complex was performed by MD
calculations. The distance Dy(III)-nitrogen of the pyridine ring and the angle formed between this direction and the axis of highest symmetry Z were kept constant all along the calculation
(Z axis is taken perpendicularly to the plan formed by the three nitrogens of the complex). The structures having the best agreement with the geometric terms ratios show a slight variation in the position of the pyridine ring compared to the central cation and the main axis of magnetic susceptibility (Z) as shown in Figure 5. This configuration leads to oxygen atoms away from each other in the tricapped trigonal prism which minimizes the interatomic repulsion. This could explain that atoms close to the paramagnetic center, especially the carbon atom of the carbonyl group (C1) for which the geometric term
(Gi) is strongly influenced by the angle θi may be sensitive to
small radii contractions along a series.
Table 4. α and β parameters obtained from the plots (δpara)Ci / (δpara)C6 vs.
(δpara)C5 / (δpara)C6 (Figure S6) of 13
C paramagnetic shift for [Ln(ethyl-DPA)3]
3-.
[a]
α and β calculations from Eq. (10) using Fi from Table 3 and geometrical
factors from structural data with i the corresponding 13C, j=C6 and k=C5.
α α [a] β β [a] Tb – Yb C1 3.29 2.92 -0.33 -3.94 C2 4.20 4.13 4.42 3.025 C3 7.47 7.56 -6.65 -6.85 C4 -1.59 -1.63 5.08 5.20 Ce – Eu C1 0.68 -2.12 7.15 3.45 C2 2.73 3.31 3.60 3.90 C3 4.58 5.74 -5.28 -4.36 C4 0.57 -0.32 4.23 3.35
Figure 5. Movement of the pyridine ring along the main axis of magnetic
susceptibility Z.
From room temperature experiments and within Bleaney’s theory we conclude that the Gi parameters are almost constant along the series while Fi depends on the Ln(III) since two sets of values are determined, the crystal field parameter is constant along the Ln series (about 51 cm-1) and the contact term is the main contribution in the An paramagnetic shifts even far from the metallic center.
2.3. Temperature variation of 1H and 13C chemical shifts
Temperature effects on the induced paramagnetic shifts provide further information on Bleaney’s parameters, and since they are temperature dependent.
Ln(III):
1
H and 13C paramagnetic shifts of [Ln(ethyl-DPA)3]3- complexes
were recorded over temperature range 20 - 70°C every 5°C. [La(ethyl-DPA)3]3- complex was used as diamagnetic reference.
The separation of contact and dipolar contributions may be obtained assuming a 1/T dependence for the former and a 1/T2
dependence for the latter as proposed by Bleaney.[6a] The
experimental results are shown as ( on
Figure 6 for Yb(III) complex (see Figure S7 for other
y = -0.762x + 3.058 R = 0.97 y = -0.881x + 3.207 R = 0.992 -0,5 0,0 0,5 1,0 1,5 2,0 1,5 2,5 3,5 4,5 ( dpar a )5H /( dpar a )6H (dpara)H3/(dpara)H6 Nd Pr Sm Eu Er Yb Tm Ho Tb Dy Ce Ho y = 1.6738x - 3.125 R = 0.998 -20 -15 -10 -5 0 5 10 15 20 25 30 -10 -5 0 5 10 15 20 ( dpar a )5H /( dpar a )6H (dpara)H3/(dpara)H6 Pu Cm Cf Am 3 5 6 x y z N OH O O OH CH3
lanthanides); within the previous assumptions, the slope and the intercept provide the dipolar and contact contributions respectively (reported Tables S6 and S7). In all cases a nice linear correlation is observed. Except for C5 of Ce(III) complex all 1
H contact contributions are much smaller (in absolute values) than those of the 13C; As expected, the farthest protons from the paramagnetic center (H5 and H6) present the smallest contact
contributions except for the Sm(III) case for which H3 contact
term is surprisingly smaller. Actually all contact Sm(III) values significantly deviate from the other Ln(III) cations.
Figure 6. Product of the temperature T with 1
H (top) and 13
C (bottom) paramagnetic shifts versus 1/T for [Yb(ethyl-DPA)3]
complexes.
For [Yb(ethyl-DPA)3]3- complex, extrapolations to T-1=0 of all
analyzed protons lead to the smallest values (close to 0) as observed in previous studies on [Ln(DPA)3]3- complexes in
aqueous solution.[3c] This suggests that the paramagnetic shift of protons is mainly dipolar. Regarding the 13C, contact contributions of C1 to C3 cannot be neglected since at room
temp and get closer. Regardless the Yb(III) case, it comes from Eq. (4) that should be equal to 298<Sz>aFi. A plot of
values vs <Sz>a tabulated by Pinkerton et al.[7] at 298K for all
Ln(III) and nuclei confirms the good correlation except for C6, H5
and H6. These nuclei far from the paramagnetic center
experience a low contact interaction that could account for this low correlation coefficient. Surprisingly the C1 nucleus supposed
to have significant contact contribution exhibits a poor correlation with <Sz>a. Tables S6 and S7 summarize the Fi
values calculated by this way (calculated as /298<Sz>). For
most of them they are of the same order of magnitude as those of Table 3 but vary in the series, both in value and sign for values close to zero. The discrepancy between both ways of calculation is about 150%.
According to Eq. (4) and assuming that the crystal field parameter is constant in the series, the ratio of the slopes ia/ib
for a given nucleus i should be equal to the ratio of Bleaney’s parameters[6a] (normalized to =-100) but this is not
confirmed by results given in Table 5 despite values are of the same magnitude order for the heaviest Ln(III).
These observations arising from both contributions (contact and dipolar) seem to reveal that the paramagnetic shifts, induced by the Ln(III) cations, are not accurately described by considering a variation of the dipolar and contact contributions with T-2 and T-1 respectively. To explain these differences, it can be considered that a part of this contribution can vary with T-n (n > 2). In fact, the pseudocontact term was treated by Bleaney[6] as a series of T-n terms assuming that the first nonzero term in T-2 is predominant. Nevertheless, significant deviations between theory and experimental data have appeared. In 1970, Kurland and McGarvey showed more complex behavior deriving the general formula of the dipolar contribution in terms of magnetic susceptibility.[24] Later, McGarvey performed a theoretical study
to determine the amplitude of T-n terms for several lanthanide
ions[25]. It has been established that although the temperature dependence is not exactly T-2,an accuracy of about 10 - 20% can be obtained at room temperature.
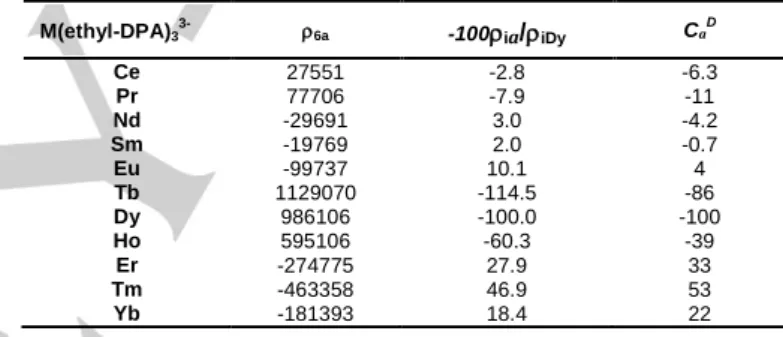
Table 5. Slope ia of the ( plot for H6; ratios normalized at
-100 for Dy(III) and CaD calculated by Bleaney[6a].
M(ethyl-DPA)3 3- 6a -100ia/iDy Ca D Ce 27551 -2.8 -6.3 Pr 77706 -7.9 -11 Nd -29691 3.0 -4.2 Sm -19769 2.0 -0.7 Eu -99737 10.1 4 Tb 1129070 -114.5 -86 Dy 986106 -100.0 -100 Ho 595106 -60.3 -39 Er -274775 27.9 33 Tm -463358 46.9 53 Yb -181393 18.4 22
This discrepancy may be overcome by adding a T-3 term to the dipolar term. LaMar et al.[26] showed a detailed expression of the
contact term by computing the components of the magnetic susceptibility tensor through the Van Vleck equation.[26] Substituting these terms in the contact contribution expression leads to the appearance of two terms varying as T-1 and T-2 ( and respectively in Eq. (11)) although the latter is not predominant. It can be considered that this term may be involved in our lanthanide complexes.
In order to check the applicability of these two assumptions, an adjustment of the 1H and 13C experimental results was performed according to the following equation:
This supposes that with the ratio and with the ratio . , , and are considered independent on nucleus i ; their values were optimized for each Ln(III) with an Excel solver using the experimental data for three 1H (H3, H5 and H6) and six 13C (C1,
C2, C3, C4, C5 and C6) nuclei and the geometric parameters
defined by MD calculations and are summarized in Tables S9 and S6. and <Sz>Gd are respectively set to -100 and 31.5
respectively. The results of the adjustment procedure (Excel solver) are shown in Table 6. All experimental values and
y = -366651x - 161.42 r=0.998 y = -223228x - 37.444 r=0.990 y = -181393x + 6.874 r=0.993 -1600 -1400 -1200 -1000 -800 -600 -400 0,00285 0,00295 0,00305 0,00315 0,00325 0,00335 δpar a .T ( p p m .K) T-1 (K-1) y = -492695x-3128.1 r=0.98 y = -540670x+279.8 r=0.96 y = -278398x-239.3 r=0.996 y = -155228x - 142.4 r=0.9992 -5000 -4000 -3000 -2000 -1000 0 0,00285 0,00295 0,00305 0,00315 0,00325 0,00335 δpar a .T ( p p m .K) T-1 (K-1) H6 H3 H5 C6 C3 C5 C4 (11)
calculated parameters are detailed in Tables S8, S9 and drawn in Figure S11.
Table 6. Parameters of 1
H and 13
C paramagnetic shifts adjustment for [Ln(ethyl-DPA)3]
3-. 1 and 2 are defined in Eq. (11). They represent
temperature deviations of the contact and dipolar contributions respectively in Bleaney’s equation at T = 300K.
Contact Dipolar Deviation calc./exp. 1 H 13 C Ce 0.45 0.68 3.2% 5.0% Pr 0.11 0.26 1.8% 13% Nd 0.87 0.11 17% 3.1% Sm 0.89 0.56 5.1% 22% Eu 0.33 0.14 21% 3.0% Tb -0.03 0.47 0.4% 2.1% Dy 0 0.20 0.5% 5.8% Ho -0.04 0.51 1.1% 3.2% Er -0.01 -0.13 0.6% 1.1% Tm 0.09 0.00 0.6% 1.2% Yb 0 -0.18 0.5% 1.0%
The results of this adjustment procedure clearly show that (T-2 contact term) is negligible for Tb(III) to Yb(III) cations while T-2
contact and T-3 dipolar terms are both required for all the lightest Ln(III). For the heaviest Ln(III), it may be noted that the influence of (T-3 dipolar term) is different for the latter since there is no contribution for Tm(III) and negative ones for Er(III) and Yb(III). The greater T-3 contributions belong to the formers with up to 32% for Tb(III) and Ho(III). This is in agreement with recent results of Hiller et al. mentioning that the magnetic anisotropy
(which is another description of the dipolar contribution, see Quantum chemistry calculations section) of Ho(III) complexes deviates from a T-2 behavior.[27]. The greatest and values are observed for the lightest cations (from Ce to Eu) with a significant contact T-2 term up to 47% for Sm(III) and Nd(III) and a large T-3 dipolar contribution up to 40% for Ce(III). Large deviation between experimental and fitted data (22% for13
C and 21% for 1H) are also observed for the light Ln. This is explained by the smallness of paramagnetic chemical shift variations collected in Sm(III) and Nd(III) cases.
The fit reveals almost constant Fi parameters within 51 and 26%
deviation (average of the relative differences between Fi and
<Fi> along the Ln(III) series) for light and heavy Ln respectively.
A broader Fi distribution (variation over 100%) is however
observed for H3, C1 and C2 nuclei whatever the Ln(III) set.
Except for these cases, Fi values along the Ln(III) series are
found similar with those collected Table 3 and this confirms that light and heavy Ln(III) have different set of Fi values. The use of
Fi values with geometric parameters Gi leads to α and β values
which are in good agreement (average of 20% excluding data from C1) with the slopes (α) and intercepts (β) deduced from dpara
ratios Eq. (10).
Regarding the crystal field parameter A20<r2>, an average of
51.1 and 52.5 cm-1 within a 2% deviation is obtained for light and heavy Ln(III) respectively which is consistent with the results of
Table 2. <Sz>a and CaD parameters issued from this fit are the
same than those of Pinkerton[7] and Bleaney[6a] at 300K except for Sm(III) for which <Sz>a is found to be 0.26, 19% larger than
the Pinkerton’s values (See Table S9).
An(III):
1
H and 13C paramagnetic shifts of [An(ethyl-DPA)3]3- complexes
were studied in the range 20 - 80°C using [La(ethyl-DPA)3]3- as
diamagnetic reference. As for Ln(III) complexes, a linear
variation of paramagnetic shifts versus 1/T was observed for each nucleus of the ligand (Figure 7 for the Cf(III) example and
Figure S8 for all other An(III) cations).
Figure 7. Product of the temperature by the 1
H and 13
C paramagnetic shift versus 1/T for the [Cf(ethyl-DPA)3]
complex.
It is surprising to observe that the intercepts for protons (H3, H5,
H6) of the [Pu(ethyl-DPA)3]3- complex exhibit values close to 0
(-22; -27 and 1 for H3, H5 and H6 respectively). This suggests a
vanishing contact term which is clearly inconsistent with 1H paramagnetic shift ratios of Table 1 suggesting a large contact contribution. Conversely, the nonzero intercept (116 and 335 respectively) for H3 and H5 protons of Am(III) are more
consistent with results of Table 1 showing a contact contribution. Regarding Cm(III), a very high intercept for all protons of ethyl-DPA ligand, including the CH3 group (H6) which displays usually
only a dipolar contribution (4555; 5306 and 3240 for H3; H5 and
H6 respectively) in contradiction with Table 1 suggesting (maybe
fortuitously) a predominant dipolar contribution for all protons. Finally, the analysis of the 1H signals of [Cf(ethyl-DPA)3]
3-complex reveals a behavior similar to that of Am(III) with a nonzero intercept for H2 and H5 protons but close to 0 for the
CH3 group. To overcome these discrepancies, T-2 and T-3
contact and dipolar contributions respectively have to be taken into account, like for Ln(III) complexes.
A fit of the An(III) experimental data was performed using Eq. (11) with the same procedure as for the Ln(III) series. Results are collected in Table 8. A significant T-3 dipolar term is
observed for all studied An(III) except for Cm(III) (about 38 to 86% of the total dipolar contribution). Unlike the Ln(III) series all the contributions are negative. The contact T-2 term is important for Am(III) and more significantly for Pu(III) since they account for about 29% and up to 46% of the total contact contribution respectively. On the contrary Cm(III) and Cf(III) present negligible T-2 contact contributions. The absence of
y = 669791x + 5436 r=0.97 y = 35983x + 17093 r=0.2 y = -459575x - 389.91 r=0.98 -5000 0 5000 10000 15000 20000 25000 0,00285 0,00295 0,00305 0,00315 0,00325 0,00335 Pa ra m a g n et ic sh if t d p a ra .T (p p m .K) T-1 (K-1) y =-2760222x +39805.2 r=0.98 y = 8574977x -54348 r=0.9993 y =-3495785x +21043.4 r=0.998 y = -1444138x -4608.4 r=0.9977 -40000 -30000 -20000 -10000 0 10000 20000 30000 40000 0,00285 0,00295 0,00305 0,00315 0,00325 0,00335 0,00345 Pa ra m a g n et ic sh if t δ p a ra .T (p p m .K) T-1 (K-1) H6 H3 H5 C6 C3 C5 C4
extra T-2 contact and T-3 dipolar terms for Cm(III) coincides with
the purely T-2 dipolar contribution found in Table 1. However we have to keep in mind that only 3 nuclei (only protons, no carbon at all) have been analyzed instead of 9 unlike the other An(III) cations. A low number of experimental data leads to a fit with a lower deviation.
Similarly to the Ln(III) series, deviations from T-1 contact (S’’a) and T-2 dipolar (C’’a) are observed for the lighter An(III) (with Pu(III) and Am(III)) while there is only T-2 dipolar deviation for the
heavier An(III) (Cf(III)).
Table 8. Parameters of 1H and 13C paramagnetic shifts adjustment for [An(ethyl-DPA)3]3-. 1 and 2 are defined Eq. (11). They represent temperature
deviations of the contact and dipolar contributions respectively in Bleaney’s equation at T=300K. #
geometrical parameters used from ref [15]
.
An(III)
(isoelectronic 4f)
Contact Dipolar Deviation calc./exp. 1 H 13 C Pu (Sm) 0.85 -0.86 3.5% 2.7% Am (Eu) -0.31 -0.53 3.5% 2.7% Am# -0.40 -0.58 4.0% 2.1% Cm# (Gd) 0.01 0 0.54% / Cf# (Dy) -0.06 -0.38 2.04% 3.0%
The use of two different crystallographic sources (our XRD results and Cary et al. study) lead to slight differences in calculated geometric parameters of the Am(ethyl-DPA)3
3-complex especially for C1, C3 and H3 nuclei (25, 3 and 7%
respectively; see Table S5). Owing to these geometrical variations and their use in Eq. (11), the optimization procedure led to deviations of 13 and 5% for and respectively (Table
8) but does not affect the <Sz>a and values (Table 9). It is
noteworthy that <Sz>a and deduced at 300K are not sensitively different than those of the isoelectronic Ln(III) configurations (Table 9; for more details see Table S11). Surprisingly the An(III) crystal field parameter obtained from these adjustments is found close to the Ln(III)
cation value: =52±1 cm-1.
Table 9. <Sa> and CaD values determined for An(III) cations at T=300K and compared to literature [6b, 7] for a same 4f electronic configuration. #geometrical parameters used from ref [15] .
An(ethyl-DPA)3 3-<Sz>a <Sz>a[7] CaD CaD [6b] Pu 0.45 0.22 (Sm) -0.6 -0.7 (Sm) Am 10.93 7.57 (Eu) 3.8 4 (Eu) Am# 10.76 3.8 Cm# 31.52 31.5 (Gd) 0 0 (Gd) Cf# 28.56 28.57 (Dy) -99.0 -100 (Dy)
Regarding Fi values, only one data set has been considered to
study the An(III) conversely to the Ln(III) series. Maybe as a result it has been difficult to find constant Fi values since
deviations are all greater than 100% (average of the relative differences between Fi and <Fi> along the An(III) series)). The
maximum deviation is reached for H6 with 420% (Table S11).
Calculations of α and β parameters from these Fi values and
geometric parameters Gi lead to values that are not in good
agreement (160% for 13C and 55% for 1H in average) with the
slopes (α) and intercepts (β) deduced from dpara ratios Eq. (10).
Based on the Eq (10) assumptions, this feature emphasizes the non constancy of the Fi values along the An(III) series and
consequently, the difficulty to separate the paramagnetic contributions in Bleaney’s equation for the An(III). When looking at paramagnetic shifts vs 1/T plots (Figures S12) it comes out that to go further more data are required especially from temperature experiments. An organic diluent in liquid state over a larger temperature range would be required to get an optimization processing more accurate.
2.4. Quantum chemistry calculations
Since <Sz>a and values are not available for the actinide series, they were determined by quantum chemistry calculations first within the Ln(III) series in order to check and validate the methods. First principle calculations with CASSCF and SO-CASPT2 have been performed in the Ln/An(DPA)3 series using
the crystallographic data except for U(III) and Np(III) complexes were the geometries were optimized by DFT calculations. z axis is taken along the pseudo C3 axis perpendicular to the plan
formed by the three nitrogens. The average of the electron spin magnetization <S>a has been evaluated along three directions and averaged to <Sm>a (see Tables 10 and 11 for Ln(III) and
An(III) respectively). describes the anisotropy of the magnetic susceptibility = //- and has been deduced from
SO-CASPT2 magnetic susceptibility calculations along x, y, z axes according to = z-( x+ y)/2 [28] and are collected in Tables
12 and 13 for Ln(III) and An(III) respectively. Electron spin magnetization <S>a calculations Ln(III):
As expected for a spin contribution, the <S>a anisotropy is relatively small, comprised between 19% for Ce(III) and 34% for Sm(III). Consequently we will discuss hereafter the average of calculated <S>a in all directions (<Sm>a) as representative of experimental <Sz>a values.
Table 10. SO-CASSCF <S>a values for [Ln(DPA)3]
complexes in three directions of space, averaged and from literature. The last column gives the relative difference between <Sm>a and <Sz>a from Golding et al.[29] and Pinkerton et al. [7] at 300K. All values are scaled to 31.50 for Gd(III).
<Sx>a <Sy>a <Sz>a <Sm>a <S[29]z>a <Sz>a [7] Diff Ce (f1) -0.78 -0.65 -1.08 -0.84 -0.98 -0.97 15.5% Pr (f2) -2.83 -2.59 -3.00 -2.8 -2.97 -2.96 5.7% Nd (f3) -4.12 -3.97 -4.45 -4.18 -4.49 -4.45 6.5% Sm (f5) 0.39 0.22 0.62 0.41 -0.06 0.22 46.3% Eu (f6) 11.12 11.59 10.11 10.94 10.7 7.57 30.8% Gd (f7) 31.50 31.50 31.50 31.50 31.50 31.50 0.0% Tb (f8) 30.38 27.86 37.69 31.98 31.82 31.85 0.4% Dy (f9) 27.93 26.24 31.65 28.61 28.55 28.57 0.1% Ho (f10 ) 22.36 21.80 23.53 22.56 22.63 22.64 0.4% Er (f11 ) 15.56 15.89 14.68 15.37 15.38 15.38 0.1% Tm (f12 ) 8.49 9.51 6.54 8.21 8.21 8.21 0.0% Yb (f13 ) 2.66 2.89 2.15 2.57 2.59 2.59 0.8%
The calculated <Sm>a values are roughly in good agreement with
the published ones. The agreement is better for the 2nd part of the series; the ground term of the free ion corresponds to a large
J value, the J-1 excited state is relatively high in energy due to
Landé rule. The theoretical value <Sz>a calculated by Pinkerton[7] within the ground J term manifold is suitable. For the 1st part of the series, the discrepancy is larger since the low lying J+1 manifold plays a key role.
The values determined by Pinkerton et al. given in Table 10 were evaluated according to Golding’s approach[29]
(taking into account bonding effects, spin-orbit coupling and mixing of excited states into the ground state) for the whole series but using relativistic Hartree-Fock method and reconsidering the spin-orbit coupling which is a sensitive feature particularly for light ions. However for Sm(III) and Eu(III), they found reasonable estimation of <S>a values in agreement with their 1H and 31P
experiments by making adjustment or using particular value of spin-orbit coupling constant or Landé factor gJ. Conversely to
Pinkerton’s approach, our ab initio <Sm>a approach does neither
consider any experimental data along the Ln(III) series nor make any assumption about <Sm>a dependence with temperature. In such frame of mind, first of all at 300K, it is noteworthy to observe that for Sm(III), our calculated value of <Sm>a is close to the one proposed by Pinkerton[7] while for Eu(III), the value is
close to the one proposed by Golding[29]. The comparison of our
experimental <Sz>a and calculated <Sm>a values exhibit a good
agreement with the heavy Ln(III) but some deviations are observed with Ce(III) (11%) and especially with Sm(III) and Eu(III) (56 and 44% respectively).
The behavior of <Sm>a with temperature in the 250-350 K range depends strongly on the Ln(III) ion (see Figures S13 and values in Table S12). They were fitted using two model functions. First, a function with T-1 and T-2 terms as described in Eq. (11)
(T<Sz>a=f(T-1) plots) and Pinkerton’s et al. approximation
(<Sz>a=a+bT)[7]. Without surprise this last assumption leads to
the poorest correlation coefficients. (T=300K) values deduced from the first function are found negligible (<<1) for Gd(III) to Yb(III) as observed experimentally expressing thereby the lack of T-2 term in the contact contribution as predicted in Bleaney’s theory. However for Ce(III), Pr(III) and Nd(III)
values are also found negligible which contrasts to experimental results. Interestingly, the calculated values of (T=300K) for Sm(III) and Eu(III) are -0.80 and -0.21 respectively which are close in absolute values to the experimental ones (0.89 and 0.33 in Table 6).
An(III):
<S>a values at 300 K for the An(III) series (U(III) to Cf(III)) calculated with SO-CASPT2 are summarized in Table 11. They are normalized to <Sz>a=31.5 for Gd(III). U(III) and Np(III)
complexes have been added for the sake of completeness even if DPA has not been investigated experimentally ; indeed the oxidation state III of these actinides is difficult to stabilize in solution with a DPA ligand. At 300 K <Sm>a values are somewhat different from the Ln(III) counterparts mainly for the lighter An(III) cations (comparison of <Sm>a values Tables 10
and 11). The anisotropy of <S>a calculated as <Sz
>-(<Sx>+<Sy>)/2 is larger than for the isoelectronic Ln(III).
For Pu(III), <Sm>a is quite far from its lanthanide analog Sm(III) (0.41 Table 10) and the model value (<Sz>a = 0.45 in Table 9). We have recently shown[30] that the magnetic susceptibility of Pu(III), both experimental and calculated, is larger than the one expected within the LS scheme, mostly due to a Zeeman interaction with the first excited state 6H
7/2.
Eu(III) and Am(III) have a non-magnetic ground state. As shown by Golding, <Sm>a is determined in Eu(III) by the population of
the first excited 7F1 term which lies 200 cm-1 above the ground
state, according to our calculations. Since the spin-orbit coupling is larger in Am(III), this state lies at 1100 cm-1 and is not populated at room temperature and the magnetization arises only from Zeeman interaction with the ground state. It is why
<Sm>a is considerably smaller in Am(III) than in Eu(III).
The Cm(III complex is expected to have a smaller <Sm>a value
than Gd(III): The zero-field splitting of the 8S0 term due to
spin-orbit coupling with excited states is negligible for Gd(III) (less than 1 cm-1) while 80 cm-1 with Cm(III). Consequently, this decreases slightly the magnetization.
<S>a in Cf(III) is anisotropic and the average values is smaller to its lanthanide analog Dy(III) ; in this case zero-field splitting of the ground term 6H
15/2 is due to the interaction with the ligands
and is expected to be larger in actinides than in lanthanides. In Dy(III), this splitting is of 260 cm-1 and all the states are thermally populated while it is more than 1600 cm-1 in Cf(III) leading to a decrease of the magnetization since not all the states are populated at room temperature.
The temperature dependence of <Sm>a is represented and fitted in the 250 – 350 K range with the same models as for Ln(III) (Table S13 and Figures S14). The best correlations are obtained with a T<Sz>a = f(T-1) behavior except for Pu(III).
Calculated (T=300K) are found negligible for Cm(III) and Cf(III) as observed experimentally. For both cations the temperature dependence of the contact contribution is consequently in agreement with Bleaney’s theory. Conversely
Table 11. SO-CASPT2 <Su>a values for [An(DPA)3]
complexes at 300 K scaled to the Gd(III) value (31.5).
<Sx>a <Sy>a <Sz>a <Sm>a U (5f3) -3.56 -3.02 -2.18 -2.92 Np (5f4 ) -2.01 -2.79 -4.18 -2.99 Pu (5f5 ) -0.54 -0.24 -1.19 -0.66 Am (5f6 ) 3.26 3.96 3.05 3.42 Cm (5f7 ) 29.5 29.5 31.5 30.2 Cf (5f9 ) 26.1 30.1 21.0 25.7
![Figure 2. EXAFS experimental (solid line) spectra of [Am(ethyl-DPA) 3 ] 3- in solution (a) and the corresponding Fourier transform (b)](https://thumb-eu.123doks.com/thumbv2/123doknet/14402920.510318/4.892.75.801.489.830/figure-exafs-experimental-spectra-solution-corresponding-fourier-transform.webp)
![Figure 3. Plot of Eq. (7) for [Ln(ethyl-DPA) 3 ] 3- in DMSO-d6 (at 298K). (a) H 3](https://thumb-eu.123doks.com/thumbv2/123doknet/14402920.510318/6.892.438.801.115.693/figure-plot-eq-ln-ethyl-dpa-dmso-k.webp)
![Figure 4. Plots of (δ para )H 5 / (δ para )H 6 vs. (δ para )H 3 / (δ para )H 6 for [Ln(ethyl- [Ln(ethyl-DPA) 3 ] 3- (up) and [An(ethyl-DPA) 3 ] 3- (down) in DMSO (at 298K)](https://thumb-eu.123doks.com/thumbv2/123doknet/14402920.510318/8.892.83.830.96.700/figure-plots-para-para-ethyl-ethyl-ethyl-dmso.webp)
![Figure 7. Product of the temperature by the 1 H and 13 C paramagnetic shift versus 1/T for the [Cf(ethyl-DPA) 3 ] 3- complex](https://thumb-eu.123doks.com/thumbv2/123doknet/14402920.510318/10.892.60.442.216.389/figure-product-temperature-paramagnetic-shift-versus-ethyl-complex.webp)

![Table 10. SO-CASSCF <S> a values for [Ln(DPA) 3 ] 3- complexes in three directions of space, averaged and from literature](https://thumb-eu.123doks.com/thumbv2/123doknet/14402920.510318/12.892.60.438.177.352/table-casscf-values-complexes-directions-space-averaged-literature.webp)

