HAL Id: hal-03080184
https://hal.archives-ouvertes.fr/hal-03080184
Submitted on 17 Dec 2020
HAL is a multi-disciplinary open access
archive for the deposit and dissemination of sci-entific research documents, whether they are pub-lished or not. The documents may come from teaching and research institutions in France or abroad, or from public or private research centers.
L’archive ouverte pluridisciplinaire HAL, est destinée au dépôt et à la diffusion de documents scientifiques de niveau recherche, publiés ou non, émanant des établissements d’enseignement et de recherche français ou étrangers, des laboratoires publics ou privés.
Label-free Quantitative Urinary Proteomics Identifies
the Arginase Pathway as a New Player in Congenital
Obstructive Nephropathy
Chrystelle Lacroix, Cécile Caubet, Anne Gonzalez-De-Peredo, Benjamin
Breuil, David Bouyssié, Alexandre Stella, Luc Garrigues, Caroline Le Gall,
Anthony Raevel, Angelique Massoubre, et al.
To cite this version:
Chrystelle Lacroix, Cécile Caubet, Anne Gonzalez-De-Peredo, Benjamin Breuil, David Bouyssié, et al.. Label-free Quantitative Urinary Proteomics Identifies the Arginase Pathway as a New Player in Congenital Obstructive Nephropathy. Molecular and Cellular Proteomics, American Society for Biochemistry and Molecular Biology, 2014, 13 (12), pp.3421-3434. �10.1074/mcp.m114.040121�. �hal-03080184�
1
Label-free quantitative urinary proteomics identifies the arginase pathway as
a new player in congenital obstructive nephropathy
Chrystelle Lacroix*1,2, Cécile Caubet*2,3, Anne Gonzalez-de-Peredo1,2, Benjamin Breuil2,3,
David Bouyssié1,2, Alexandre Stella1,2, Luc Garrigues1,2, Caroline Le Gall4,5, Anthony
Raevel2,3, Angelique Massoubre2,3, Julie Klein2,3, Stéphane Decramer2,3,6, Frédérique
Sabourdy7, Flavio Bandin2,3,6, Odile Burlet-Schiltz1,2, Bernard Monsarrat#1,2, Joost-Peter
Schanstra#2,3, Jean-Loup Bascands#2,3.
1
Centre National de la Recherche Scientifique, Institut de Pharmacologie et de Biologie Structurale, F-31077 Toulouse, France.
2
Université Paul Sabatier, Toulouse, France.
3
Institut National de la Santé et de la Recherche Médicale (INSERM), U1048, Institut of Cardiovascular and Metabolic Disease, Toulouse, France.
4
Methodomics, Toulouse, France.
5
Institut de Mathématiques de Toulouse, UMR 5219, INSA de Toulouse, Université de Toulouse, 135 Avenue de Rangueil, F-31077 Toulouse, France
6
Nephrology and Internal Medicine Department, University Children's Hospital, Toulouse, France.
7
Laboratoire de Biochimie Métabolique, IFB, CHU Purpan, and INSERM UMR 1037, CRCT CHU Rangueil, Toulouse, France
* Both authors contributed equally to this work.
# co-corresponding authors:
Joost-Peter Schanstra, Jean-Loup Bascands and Bernard Monsarrat. E-mails : jean-loup.bascands@inserm.fr, joost-peter.schanstra@inserm.fr and bernard.monsarrat@ipbs.fr.
Running title: Urinary proteomics in obstructive nephropathy
MCP Papers in Press. Published on September 9, 2014 as Manuscript M114.040121
by guest on December 17, 2020
https://www.mcponline.org
Abbreviations:
ARG, Arginase; ASL, Arginine succinate lyase; ASS, Arginine succinate synthase; CAT, Cationic amino acid transporter; CID, Collision Induced Dissociation; CV, Coefficient of Variation; EGF, Epidermal growth factor; FASP, Filter-Aided Sample Preparation; FDR, False Discovery Rate; HPRT, hypoxanthine-guanine phosphoribosyltransferase; LC-MS, Liquid Chromatography/Mass Spectrometry; MRM, Multiple Reaction Monitoring, MS/MS, Mass Spectrometry/Mass Spectrometry; NO, nitric oxide; NOHA, N-Hydroxy-L-arginine; NOS, Nitric oxide synthase; OAT, Ornithine aminotransferase; ODC, Ornithine decarboxylase; PAI, Protein Abundance Index; ProDH, Proline dehydrogenase; P5C, Pyrroline-5-carboxylate; P5CD, P5C dehydrogenase; P5CR, P5C reductase; P5CS, P5C synthase; RT, Retention Time; RT-qPCR, Reverse transcription quantitative polymerase chain reaction; TFA, Trifluoroacetic Acid; UPJ, UreteroPelvic Junction; UUO, Unilateral ureteral obstruction; XIC, Extracted Ion Chromatogram.
by guest on December 17, 2020
https://www.mcponline.org
SUMMARY
Obstructive nephropathy is a frequently encountered situation in newborns. In previous studies, the urinary peptidome has been analyzed for the identification of clinically useful biomarkers of obstructive nephropathy. However, the urinary proteome has not been explored yet and should allow additional insight into the pathophysiology of the disease. We have analyzed the urinary proteome of newborns (n=5/group) with obstructive nephropathy using label free quantitative nanoLC-MS/MS allowing the identification and quantification of 970 urinary proteins. We next focused on proteins exclusively regulated in severe obstructive nephropathy and identified Arginase 1 as a potential candidate molecule involved in the development of obstructive nephropathy, located at the crossroad of pro- and anti-fibrotic pathways. The reduced urinary abundance of Arginase 1 in obstructive nephropathy was verified in independent clinical samples using both Western blot and MRM analysis. These data were confirmed in situ in kidneys obtained from a mouse obstructive nephropathy model. In addition, we also observed increased expression of Arginase 2 and increased total arginase activity in obstructed mouse kidneys. mRNA expression analysis of the related arginase pathways indicated that the pro-fibrotic arginase-related pathway is activated during obstructive nephropathy. Taken together we have identified a new actor in the development of obstructive nephropathy in newborns using quantitative urinary proteomics and shown its involvement in an in vivo model of disease. The present study demonstrates the relevance of such a quantitative urinary proteomics approach with clinical samples for a better understanding of the pathophysiology and for the discovery of potential therapeutic targets.
by guest on December 17, 2020
https://www.mcponline.org
INTRODUCTION
Congenital obstructive nephropathy is the main cause of end stage renal disease (ESRD) in children (1). The most frequently found cause of congenital obstructive nephropathy is ureteropelvic junction (UPJ) obstruction with an estimated incidence of 1 in 1000-1500 births. Milder forms of UPJ obstruction often progress to the spontaneous resolution of the pathology over time. This has led to a watchful waiting approach with surgical intervention only if renal deterioration is detected (2). Although this medical surveillance prevents unnecessary surgery, it mostly relies on invasive follow-up. Consequently with the aim to reduce this invasive follow-up, several groups have initiated research to identify non-invasive urinary biomarkers of UPJ obstruction using both targeted and non-targeted (e.g. proteome analysis based) strategies. Targeted strategies including urinary cytokine expression analyses failed to clearly determine the need for surgery in UPJ obstruction (3, 4). On the other hand untargeted strategies have been more successful and by using urinary proteomics, biomarkers for renal and non-renal diseases have been identified (5-9). Using urinary peptidome analysis, we identified and validated a urinary peptide panel that predicted the clinical outcome of newborns with UPJ obstruction with 97% accuracy several months in advance (3, 10). An independent small-scale study confirmed the efficiency of this biomarker panel (7). These studies indicate the potential of urinary proteomics to predict the clinical fate of patients with UPJ obstruction. Although these endogenous urinary peptide biomarkers are of great potential clinical value, sequencing of these biomarkers mainly identified collagen fragments that are less informative on the pathophysiology of the disease. In contrast studies of the high molecular weight urinary proteome (i.e. proteins) might be more informative on the pathophysiology of disease. Different approaches have been used in the past to characterize the urinary proteome, either by 2D-gel electrophoresis coupled to mass spectrometry (11, 12) or reverse phase liquid chromatography coupled to tandem mass spectrometry (LC-MS/MS) analysis (13-16). In-depth proteome analysis using extensive fractionation of the sample and high resolution, fast sequencing mass spectrometers have reported the identification of >2000 proteins in normal human urine (13, 15, 16). Here, we applied quantitative high-resolution label free LC-MS/MS analysis for the identification of urinary proteins associated to UPJ obstruction in newborns. Among a number of proteins uniquely associated with severe UPJ obstruction we identified Arginase 1, not previously recognized in UPJ obstruction. Using an independent larger cohort, we further verified reduced urinary abundance of Arginase 1 using both Western blot and multiple reaction monitoring (MRM). Using the mouse model of obstructive nephropathy, we observed that the expression of arginases is modulated in situ in obstructed kidneys. Further gene expression analysis of the arginase pathway allowed us to hypothesize for a role of arginases in the development of fibrotic lesions in obstructive nephropathy.
by guest on December 17, 2020
https://www.mcponline.org
EXPERIMENTAL PROCEDURES
Participants and urine collection
After local ethics committee approval, informed consent was obtained from all participants (parents of the newborns). All urine samples were from male newborns of less than one year old. A total of 49 UPJ obstruction patients were studied. In addition, healthy individuals were used to establish normal urinary protein patterns. Details on urine collection procedures can be found in the supplementary experimental procedures.
Clinical analysis methods
DMSA scans were performed to determine differential renal function as described (9) and interpreted as described by Patel et al (8). MAG3-scans to determine the degree of obstruction were performed as described by Wong et al (17).
Patients
All patients with unilateral antenatally detected hydronephrosis, defined by a renal pelvic diameter >5 mm, were treated at the Children’s Hospital Purpan, Toulouse, France. All patients underwent an ultrasound examination within the first month of life. The degree of hydronephrosis was classified between grades I and IV according to the system developed by the Society for Fetal Urology and the ultrasound appearance of the renal parenchyma and pelvicalyceal system on longitudinal ultrasonic section (18-20). A voiding cystourethrogram (VCUG) was systematically performed at the first visit. Patients were excluded if they had a vesicoureteric reflux (VUR), solitary kidney, bilateral hydronephrosis, ureteral dilatation or lower urinary tract abnormalities. After the first visit patients were classified into “Mild” or “Severe”. A detailed clinical description of the “Mild” or “Severe” UPJ obstruction patients can be found in the supplementary experimental procedures and in (10). For the patients classified as “Severe”, urine samples were collected as described above with a collection pouch, or directly obtained from the pelvis during pyeloplasty. These samples were studied as two different subgroups according to the origin of urine, designated “Severe-Bladder” or “Severe-Pelvis”. The median age (±SD) of newborns of each group when urinary samples were collected was 22±11.5 weeks in the “Healthy” group (n=22), 15±13.7 weeks in the “Mild” group (n=27), 11±6.73 weeks in the “Severe-Bladder” group (n=22), and 13±8 weeks in the “Severe-Pelvis” group (n=6). Details regarding the age of the newborns included in the study can be found in the supplementary experimental procedures.
Label-free quantification workflow
Urinary sample preparation for NanoLC-MS/MS analysis
by guest on December 17, 2020
https://www.mcponline.org
For the discovery phase, 20 urine samples (n=5/group) were used. Urine samples (5-15 ml) were centrifuged at 3000g for 10 min at 4°C to remove cell debris. The supernatants were concentrated and digested using a protocol adapted from the Filter-Aided based Sample Preparation (FASP) method (21, 22). For details of the FASP method and deviation from the published FASP protocol see the supplementary experimental procedures.
NanoLC-MS/MS analysis
The resulting peptides were analyzed by nanoLC-MS/MS using an Ultimate3000 system (Dionex, Amsterdam, Netherlands) coupled to an LTQ-Orbitrap Velos mass spectrometer (Thermo Fisher Scientific, Bremen, Germany). Each sample was analyzed in triplicate, resulting in 60 analytical runs (3 replicates x 4 groups x 5 samples). The order of the injections was randomized over all the samples. Further details on NanoLC-MS/MS analysis can be found in the supplementary experimental procedures.
Database search and protein validation
Database searches were performed using the Mascot Daemon software (version 2.3.2 Matrix Science, London, UK) using procedures described in the supplementary experimental procedures.
Quantification from raw MS data
Quantification was performed based on all peptide identifications derived from the 60 analytical runs, using the label-free quantitative module implemented in the MFPaQ v4.0.0 software (Mascot File Parsing and Quantification) (http://mfpaq.sourceforge.net/) as described in the supplementary experimental procedures. Quantification of peptide ions was performed based on calculated XIC areas values.
Data processing and statistical analysis
Protein relative quantification was performed by pairwise comparisons of different groups, containing each 5 samples analyzed in triplicate. The method used for missing intensity values imputation for each peptide ion is described in the supplementary experimental procedures. Based on the peptide quantitative data, a Protein Abundance Index (PAI) was calculated, defined as the total sum of all the XIC areas for all the tryptic peptide ions identified for this protein. To perform normalization of a group of analytical runs, we computed abundances ratios for all the PAI values between a reference run and all the other runs, and used the median of the PAI ratios as a normalization factor for each run. Statistical analysis was then performed for each pairwise comparison of sample groups. For each sample, the mean of normalized PAI values retrieved from triplicate nanoLC-MS
by guest on December 17, 2020
https://www.mcponline.org
measurements were calculated, and a Student’s t test on log transformed mean normalized PAI values was used for statistical evaluation of the significance of expression level variations (assuming non-equal variances). P-values were adjusted for multiple testing using the Benjamini-Hochberg procedure (23). All procedures were performed using R packages which can be provided upon request.
Targeted mass spectrometry analysis-Multiple Reaction Monitoring (MRM) for biomarker verification
The design of MRM assays and urinary sample preparation for MRM analysis was performed as described in the supplementary experimental procedures. Each dried digested urinary sample spiked with yeast exogenous proteins was suspended with 14 µl of a mixture of synthetic stable isotope-labeled peptides (partially purified PEPotec synthetic peptides or purified AQUA Ultimate peptides, Thermo Scientific, see the supplementary experimental procedures) in 2% acetonitrile, 0.05% trifluoroacetic acid. Half of the preparation was then loaded on the system and analyzed on the 5500 QTrap as described for the design of MRM assays (supplementary experimental procedures), using the optimized transitions list (Sup. Data 1). Quantitative measurements were performed via time-scheduled MRM acquisition, using a 4 min retention time window and a cycle time of 3s. Details of the MRM acquisition method are given in Sup. Table 1. For assessment of the repeatability of the entire analytical workflow (sample concentration on SDS-PAGE + in-gel digestion + LC-MRM analysis), replicate sample preparations and LC-MRM analysis were performed on aliquots of either a unique healthy urine sample from the cohort of the verification study or of a pooled urine sample from healthy donors (supplementary experimental procedures, Sup. Table 2 and Sup. Data 2-3 for details on these preliminary experiments). For the candidate proteins monitoring with purified AQUA peptides, response curves were generated by spiking in increasing amounts the heavy standards in a pooled urine sample from healthy donors, and the LOD/LLOQ of the assays was calculated using the QuaSAR software (24) (supplementary experimental procedures, Sup. Table 3 and Sup. Data 4-5).
Assessment of the LC-MRM system performances during the clinical study itself was done through systematic injection of a quality control beta-galactosidase tryptic digest, interspersed between acquisition of the clinical samples from the verification cohort (Sup. Data 6), and through monitoring of the spiked-in yeast protein internal standards (Sup. Data 7). Injections corresponding to the 3 groups of samples from the verification cohort were randomized during LC-MRM analysis. The entire dataset of the MRM analysis was loaded into PeptideAtlas/PASSEL (http://www.peptideatlas.org/PASS/PASS00454). All MRM data
were analyzed with the Skyline software
(http://proteome.gs.washington.edu/software/skyline). Data were manually inspected to
by guest on December 17, 2020
https://www.mcponline.org
ensure correct peak detection and integration. In addition, the AuDIT module (25) was used to assess the quality of the monitored transitions, by controlling the relative ratios between transitions in the light and heavy peptides in the preliminary triplicate test dataset (Sup. Table 2), and in the clinical dataset itself (Sup. Table 4). Endogenous protein amounts were estimated by QuaSAR from the calculation of peak area ratio (PAR) values between light and heavy peptides, and from the known spiked amounts of the heavy internal standard peptides (approximate amounts were used in the case of partially purified PEPotec peptides). Relative quantification and statistical analysis between sample groups was performed on one selected transition (the best) for each targeted peptide using unpaired t test assuming unequal variances (supplementary experimental procedures). For each sample group comparison (Mild/Healthy, Severe-Bladder/Healthy and Severe-Bladder/Mild) pvalues were corrected for multiple testing using the Benjamini-Hochberg procedure (22 pvalues corrected corresponding to the 22 peptides quantified per comparison) (Sup. Data 8). Adjusted pvalues less than 0.05 were considered statistically significant. Graphics were generated by Prism 5 GraphPad software.
Adult mouse model of obstructive nephropathy
Animals
C57Bl/6J mice were purchased from Janvier SAS (CS 4105 Le Genest St Isle F-53941 St Berthevin Cedex). The mice were housed in a pathogen-free environment. All experiments
reported were conductedin accordance with the NIH guide for the care and use of laboratory
animals and were approved by a local animal care and use committee.
Unilateral Ureteral Obstruction (UUO)
UUO is a model of obstructive nephropathy mimicking in an accelerated manner the development of renal fibrosis (26, 27).
Male mice 8 weeks of age were used in all experiments. Unilateral ureteral ligation was
performed as previously described (28). Mice were subjected to UUO during 3 or 8 days. Details can be found in the supplementary experimental procedures.
Histological analysis and immunohistochemistry
For histology, kidney sections were fixed in Carnoy’s solution for 24 h, dehydrated and embedded in paraffin. Four-micrometer paraffin-embedded sections were used for immunohistochemistry. Sections were first de-waxed in Ottix Plus (Diapath, Martinengo, Italy) and rehydrated through a series of graded ethanol washes before endogenous peroxidase blockage (S2001, DakoCytomation, Trappes, France). For detection of collagen fibril deposits, tissues sections were incubated 1 hour at room temperature with primary
by guest on December 17, 2020
https://www.mcponline.org
antibody anti-collagen type I (1:250, CL50151AP1 Cedarlane, Ontario, Canada) and further with the secondary anti-rabbit IgG Dako Envision HRP system (K4002, DakoCytomation) during 30 min. Immunological complexes were visualized by the addition of the DAB substrate during 10 min (TA-125-HDX, Thermo Fisher Scientific). Sections were counterstained with hematoxylin and mounted. Kidney sections were scanned using a Nanozoomer 2.0 RS (Hamamatsu Photonics SARL, Massy, France) and treated with the Morpho-expert image-analysis software (version 1.00, Explora Nova, La Rochelle, France) for morphometric analyses.
Western blot analyses
Complete details of the procedure can be found in the supplementary experimental procedures. Briefly urine samples were desalted on PD10 columns (GE Healthcare Europe GmbH, Freiburg, Germany), concentrated by lyophilisation and stored at −80°C. Renal mouse tissues were homogenized in ice-cold RIPA cell lysis buffer and then centrifuged at 13,000 g during 15 min at 4°C. The resulting supernatants were stored at −80°C and used as tissue extracts for experiments. Protein concentrations were determined by Bradford assay (Bio-Rad). For western blot analysis, ARG1 and 2 immunoblotting were performed by using specific rabbit polyclonal anti-Arginase1 (Sigma) and anti–Arginase2 (Santa-Cruz Biotechnology) antibodies. GAPDH was detected with a goat monoclonal antibody (Santa-Cruz Biotechnology). The antigen-antibody complex was detected with peroxydase-conjugated anti-rabbit or anti-goat antibodies.
Measurement of arginase activity
Arginase activity was measured using a colorimetric analysis of urea production from L-arginine, as previously described (29). Details of the arginase activity measurement can be found in the supplementary experimental procedures.
Quantification of gene expression by real-time quantitative PCR (RT-PCR)
Total RNA from mouse kidney samples was isolated and analyzed by RT-PCR as described in the supplementary experimental procedures. Primers used are listed in Sup. Table 5.
Measurement of plasma amino acid concentration
In each group (n=8), plasma samples from two mice were pooled in order to obtain a sufficient volume for analysis. Arginine concentrations were determined in the resulting 4 samples/group by ion exchange chromatography in an Aminotac amino acid analyzer (Aminotac JLC-500/V, JEOL, Tokyo, Japan). After reaction with ninhydrin, arginine was
by guest on December 17, 2020
https://www.mcponline.org
detected at 570 nm. Data acquisition and calculations were made using the Jeol Workstation software version 3.45.
Statistical analysis of data from mouse model
Data were expressed as mean ± SD. Results were analyzed by statistical non-parametric Mann-Whitney test. Graphics were generated by Prism 5 GraphPad software. P values less than 0.05 were considered statistically significant.
by guest on December 17, 2020
https://www.mcponline.org
RESULTS
Label-free LC-MS/MS analysis of the urinary proteome of UPJ obstruction patients
We adapted the previously described filter-aided sample preparation (FASP) method (21) to process urinary samples on an ultrafiltration device with a 10 kDa cut-off membrane (Fig. 1). After proteolytic digestion, tryptic peptides were recovered in the filtrate from the last centrifugation step, free of undigested protein or other high-molecular weight material.. Following this protocol, around 250 urinary proteins could be identified per nanoLC-MS/MS run on an LTQ-Orbitrap-Velos instrument. Using the same urine sample from an healthy individual, we obtained a median coefficient of variation (CV) for the PAI values of 5% for a triplicate consecutive repeat LC-MS measurement, while the variability related to a triplicate sample preparation was 14% (Sup. Data 9A). These CVs were at the lower end compared to other urinary proteome studies (30, 31), and indicated that the variability of the analytical method is much lower than the inter-individual variability expected in a clinical study (see below).
For identification of urinary proteins associated with UPJ obstruction, 4 different groups of 5 newborns were studied (Fig. 1 and Materials and Methods for detailed group descriptions): healthy individuals (Healthy), newborns with mild UPJ obstruction evolving to spontaneous resolution (Mild) and severe UPJ obstruction that needed to be surgically corrected (Severe). In the latter, we analyzed both bladder urine samples and urine samples directly taken from the pelvis during surgery (marked Severe-Bladder and Severe-Pelvis, respectively). All samples were prepared and analyzed randomly. Each of the 20 samples were measured in triplicate which improved MS/MS sampling and increased the number of identified proteins with 30% (Sup. Data 9B). In the time course of the present clinical study (about 10 days), good chromatographic reproducibility was observed across random triplicate injections (Sup. Data 10) as well as a good analytical repeatability (median PAI CV of 13 % for randomly triplicate measurements) while the inter-individual variability in a same study group was 50 to 60% (Sup. Data 11). Using the MFPaQ software (32), we could identify and quantify 970 unique urinary proteins from these 60 raw files (Sup.Table 6).
Candidate marker proteins selection
For the identification of proteins differentially secreted in obstructed kidneys, we focused on
the 3 pairwise combinations Severe-Pelvis/Healthy, Severe-Bladder/Healthy and
Mild/Healthy (Fig. 2A). Depending on the comparisons, 16 to 174 differentially secreted proteins were observed (p<0.05) (Fig. 2A and B and Sup. Table 7). Only the comparison Severe-Pelvis/Healthy yielded proteins that resisted to the multiple-testing correction. A major aim in obstructive nephropathy is to find biomarkers of severe obstruction versus mild self-resolving obstruction. Therefore, we focused mainly on proteins specifically involved in
by guest on December 17, 2020
https://www.mcponline.org
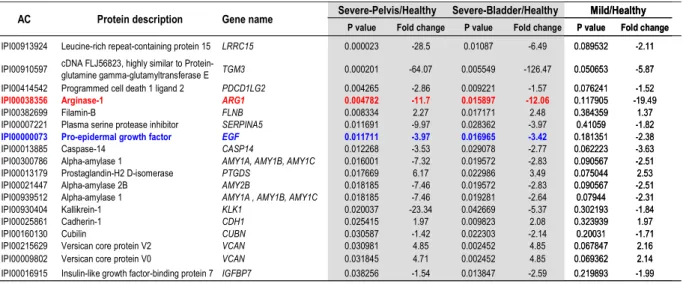
severe obstruction and retained proteins that were found with differential abundance in the Severe/Healthy group comparison (p-value <0.05), but that were not significantly modulated in the Mild/Healthy comparison. Among such markers, some had both a modified abundance in bladder urine (Severe-Bladder/Healthy comparison) and in urine collected directly from the pelvis of the pathological kidney (Severe-Pelvis/Healthy comparison), suggesting that the modification was originating specifically from the obstructed kidney (Table 1, Sup. Data 12). On the contrary, markers which were found with different abundance in Severe-Bladder/Healthy comparison but were not significant in Severe-Pelvis/Healthy comparison were classified as proteins potentially modulated in the contralateral kidney (Sup. Data 12-13).
As a first verification of the urinary proteome-based analysis we searched for the presence of proteins known to be modified in UPJ obstruction. Epidermal growth factor (EGF) has been shown to be reduced in both kidney tissue and urine of patients with UPJ obstruction (33, 34). EGF was among the top differentially excreted proteins in Table 1. This reduced urinary EGF abundance in UPJ obstruction was verified by estimation of the EGF concentration by multiple reaction monitoring (MRM) using independent samples (~10/group, Sup. Data 14-15 and Sup. Data 8). These data on EGF clearly validate the global proteomics-based approach for the detection of differentially secreted urinary proteins in UPJ obstruction.
In the next step we selected proteins differentially expressed in the obstructed kidney for further verification. Selection for verification was based i) on the lowest p-values and highest fold increase or decrease, ii) on whether proteins were not yet shown to be involved in the obstructive nephropathy or renal disease and finally iii) whether these proteins could be potentially involved in the major events of obstructive nephropathy, including inflammation, myofibroblast accumulation and fibrosis (26). The protein that corresponded best to those criteria was Arginase 1 (ARG1). Urinary proteome analysis detected ~12 times less ARG1 in urine from severe UPJ individuals compared to controls in both comparisons Severe-Pelvis/Healthy and Severe-Bladder/Healthy (p-value <0.05) (Table 1). ARG1 may potentially be involved in the development of fibrosis in UPJ obstruction by down regulating the production of nitric oxide (NO) and by directing the use of L-arginine to cellular proliferation and collagen synthesis (Fig. 3A). We therefore subsequently focused on studying the regulation of arginases in obstructive nephropathy.
Verification of modification of arginase expression in human obstructive nephropathy
According to the guidelines of clinical proteomics (35, 36), we verified the reduced abundance of urinary ARG1 in UPJ obstruction using Western blot and MRM on a larger number of independent controls and UPJ obstruction patients (Fig. 1 and 4). Western blot analyses showed a significantly lower urinary ARG1 abundance in newborns with UPJ
by guest on December 17, 2020
https://www.mcponline.org
obstruction compared to controls (Fig. 4A and B). This modified urinary ARG1 abundance was confirmed by MRM (Fig. 4C, Sup. Table 4, Sup. Data 8, MRM chromatograms views of the peptides monitored for ARG1 are provided in Sup. Data 16-17).
Although we observed a significant difference in age between the "Healthy" and "Severe-Bladder" groups in both the discovery and verification cohorts, we did not observe a correlation between the age of the children and the level of ARG1 excretion, irrespective of the approach (i.e. LC-MS/MS, western blot or MRM) we used (Sup. Data 18). However in contrast to the initial LC-MS/MS analysis where ARG1 was decreased only during severe obstruction, here we observed reduced urinary ARG1 abundance compared to controls irrespective of the severity of UPJ obstruction and verification method used.
Analysis of arginase expression and activity in a mouse model of obstructive nephropathy
There are two distinct isoenzymes of mammalian arginases that have 58% sequence identity and that are encoded by separate genes (37). Under physiological conditions, using Western blot analyses, we observed significant expression of ARG1 and ARG2 isoforms in the mouse kidney. Both arginase isoforms gave weak signals in the bladder and ARG2 also showed low expression in the ureter (Fig. 5A).
To further study the link between ARG1 and UPJ obstruction we studied the expression and activity of arginase in the obstructive nephropathy mouse model (n=8/group, Fig. 1). Immunohistochemical studies on kidney sections validated the development of tubulo-interstitial fibrosis as exemplified by increased collagen I staining as early as day 3 after UUO (Fig. 5B). Western blot analysis showed that UUO induced a significant reduction (~60%) in renal ARG1 expression as early as 3 days after UUO. In contrast, ARG2 expression increased 4-5 fold both at 3 and 8 days after UUO (Fig. 5C). In addition, total arginase activity was found significantly increased (6 fold) in both 3 or 8 days obstructed kidneys (Fig. 5D). These data suggest that the reduced urinary ARG1 abundance in newborns with UPJ obstruction can originate from its reduced expression in the obstructed kidney. However the significant increase in arginase activity in the obstructed mouse kidney most likely originates from ARG2 induction during obstructive nephropathy.
Analysis of the expression of genes involved in the pro-fibrotic arginase pathway in the mouse model of obstructive nephropathy
We studied mRNA expression of different enzymes and proteins leading to proline and polyamine synthesis in the pro-fibrotic arginase pathway (Fig. 3A) in the mouse model. The gene expression profiles (Fig. 6A) suggest activation of the proline formation pathway (increased Oat, P5cr and P5cs and reduced proDH and P5cd mRNA expression at both 3 and 8 days post UUO) accompanied by reduced polyamine synthesis (reduced Odc mRNA
by guest on December 17, 2020
https://www.mcponline.org
expression). We next studied the expression of genes involved in L-Arginine availability (Fig. 3A). Two genes (Ass and Asl) involved in the transformation of citruline in L-arginine were down-regulated and genes coding for L-arginine transporters (Cat1 and 2) were up-regulated (Fig. 6B). In parallel to these measurements we also observed that plasma arginine concentrations were significantly increased in obstructed mice (Fig. 6C). Taken together, this animal model data suggests that obstructive nephropathy is associated with increased intra-renal L-Arginine availability and potential activation of the pro-fibrotic arginase pathway (Fig. 3B).
by guest on December 17, 2020
https://www.mcponline.org
DISCUSSION
Using label-free LC-MS/MS-based urinary proteome analysis and additional studies in the mouse obstructive nephropathy model, we identified the arginase pathway as a potential player in obstructive nephropathy.
One of the main issues in urinary proteome analysis is to maximize the number of detected proteins, while using an analytical workflow compatible with relative quantitative comparison of the samples, in order to define potential biomarkers. Many in-depth proteomic studies on urine are based on extensive fractionation of the samples, final quantification of the proteins being usually performed by spectral counting (13, 15, 38-41). However, such approaches are in general time consuming which cannot be overcome with pooling of samples since this results in loss of statistical power. Other strategies to increase the depth of the proteome analysis are based on either immunodepletion of abundant urinary proteins or sample treatment with combinatorial peptide ligand libraries but require in general large quantities of starting material (14). Single-run LC-MS/MS label-free quantification of proteins based on peptide ion intensity (30) allowed the identification of ~400 urinary proteins per run. We used a similar method based on single-run analysis of individual samples, and label-free quantitative analysis using the MFPaQ software.
An additional difficulty in our study was the very low amount of protein obtained from urine samples of newborn (protein concentration typically around 5-30 µg/mL versus 100 µg/mL in adults). In addition, typically, only a very limited volume (5-10 ml) of urine was obtained in newborns. A large number of protocols have been described and compared to prepare urinary proteins for proteomic analysis, consisting generally in a concentration step based on either lyophilisation, precipitation, solid-phase extraction or ultrafiltration of urine, followed by desalting and protein digestion with trypsin (31, 42, 43). In our hands, best results were obtained using an ultrafiltration protocol adapted from the (FASP) method.
Finally, our analytical workflow resulted in a fairly robust and repeatable measurement of protein abundance by nanoLC-MS/MS, with typical CVs around 15% for triplicate preparation and MS analysis. In the discovery step of the study, four different groups (n=5/group) were defined and 970 unique urinary proteins were identified using this label-free LC-MS/MS protocol, that could be quantified using the cross-assignment procedure of MFPaQ.
Using this approach, a number of proteins with significant differences in urinary abundance originating from the obstructed kidney were identified including ARG1, EGF, LRCC15, TGM3 and PTGDS (Table 1) and also proteins modulated in contralateral kidney including CDH13 and HSPA5 (Sup. Data 13). While the urinary abundance of TGM3 was clearly decreased in the obstructed kidney, TGM3 was not selected for our first verification set because we suspected that this change in abundance was due to epidermal contamination of the
by guest on December 17, 2020
https://www.mcponline.org
samples. Indeed, expression of TGM3 is normally restricted to superficial epidermis and to hair follicles.
Given the low number of samples per group in the discovery study, we verified these differences in new samples using targeted proteomics via Western-blot and MRM analysis. Until now only a few small-scale studies have described the successful use of MRM for the multiplexed quantification of potential clinical biomarkers in urine (44-46). In addition, in these studies, at least 10 ml of urine were used for reproducible MRM analysis. Here, we wanted to take advantage of the high sensitivity of the MRM technique to perform the verification on a number of candidate biomarkers of a larger cohort of children from which often only low volumes of urine were available (3-5 mL). We therefore developed an MRM protocol for the detection of proteins in 3 ml of urine. While the ultrafiltration method (e.g. FASP-based) was reproducible in our hands in the discovery phase using larger volumes of urine (≥10 mL), it gave less reproducible results with small sample volumes (3 mL). This is most probably due to loss of material on the membrane that appears to be critical when dealing with small amounts of protein. We thus switched to a processing method using direct desalting, lyophilisation of samples, and concentration of proteins in one gel band by 1D SDS-PAGE followed by in-gel digestion, which allowed to minimize sample loss and to optimize the final yield of tryptic peptides available for MRM analysis. Using this procedure, the targeted proteins could be detected with improved sensitivity and repeatability, and particularly ARG1 was quantified with good precision in 31 individuals starting with 3 ml of urine.
ARG1 was verified as a protein with modified abundance among the proteins specifically originating from the obstructed kidney. Modified EGF excretion was also verified by MRM, confirming the previous observation of modified urinary EGF abundance in obstructive nephropathy (33, 34, 47). According to the study of Li et al., urinary EGF could allow discrimination between mild or severe obstruction in infants (47), however, in our study, this difference, using MRM, between the "Severe-Bladder" and "Mild" groups lost significance after correction for multiple testing (Sup. Data 8). Thus, the relation between the urinary EGF abundance and the severity of the pathology should be investigated on a larger cohort of patients. The decrease in urinary abundance of LRCC15 was also confirmed, but this difference lost significance in the comparison "Severe-Bladder/Mild" after BH correction. Although the abundance of urinary ARG1 is decreased in UPJ obstruction patients compared to healthy newborns, there is no significant difference of its abundance between mild and severe UPJ obstruction both measured by Western blot and MRM (Fig. 4B and 4C and Sup. Data 8). So, while urinary ARG1 is not a good clinical biomarker for differentiating between the severity of UPJ obstruction, the protein is potentially involved in the pathophysiology of the disease. Since biopsies from newborns with UPJ obstruction are not available, we used the mouse obstructive nephropathy model to further study the role of arginase in obstructive
by guest on December 17, 2020
https://www.mcponline.org
nephropathy. We observed that ARG1 expression was also reduced in situ, in the obstructed kidney of mice. Based on this result and because it is known that most of the excreted urinary proteins originate from the kidney and urinary tract (48), it is most likely that the modified urinary ARG1 abundance in UPJ obstruction patients reflects reduced ARG1 expression in the kidney.
Two isoforms of arginases exist: ARG1 and 2. To study the overall effects of obstructive nephropathy on arginases, we also studied the ARG2 expression and total arginase activity. Interestingly, in contrast to ARG1, UUO strongly increased renal ARG2 expression and total renal arginase activity. While ARG2 is the predominant arginase isoform expressed in the kidney, ARG2 was not detected in the initial LC-MS/MS discovery study. This could be explained either by an absence of excretion due to differences in the protein distribution (ARG1 is expressed in cytoplasm whereas ARG2 is mitochondrial), or, degradation of the ARG2 protein in urine or by absence of identification of the protein due to the physicochemical characteristics of ARG2 tryptic-peptides. Consistent with our observation, ARG1, but not ARG2, was already identified in urine from healthy individuals by other laboratories using urinary proteome analysis (16). In contrast with decreased ARG1 expression after obstruction observed in our study, Schwartz et al (49) reported that both isoforms of arginases were up-regulated in a rat model of bilateral obstructive nephropathy. This difference observed for ARG1 expression in their study can have different origins. They: i) used rats and not mice, ii) used a bilateral, instead of a unilateral, model of ureteral obstruction, iii) studied arginase expression in glomeruli while we used the total renal cortex and iv) studied arginase expression 1 day after obstruction while we studied arginase expression 3 and 8 days post-obstruction. We ruled out the latter since we observed initiation of reduction of renal ARG1 expression one day after unilateral obstruction in our mouse model (results not shown).
In adult mammals, the majority of endogenous L-arginine synthesis takes place in the proximal tubules of the kidney where citrulline, originally released from small intestine, is metabolized into arginine by the enzymes ASS and ASL and can be subsequently exported to the systemic circulation (50). Arginase activity represents a possible route of the L-arginine metabolism (51) and has already been associated to pathogenesis of various disorders such as allergic asthma, airway inflammation, diabetes, vascular dysfunction and atherosclerosis (34, 52-57), among others. Data from our studies on the animal model of obstructive nephropathy show the potential ability to up-regulate L-arginine transport (via Cat transporters) and to direct its metabolism to L-proline via "the pro-fibrotic arginase pathway” (Fig. 3B).
The increase in ARG2 expression/activity that we have observed in the obstructive nephropathy model could represent a key event for the development of renal fibrosis. First, it
by guest on December 17, 2020
https://www.mcponline.org
could lead to shunting of the NOS pathway (58, 59) and it has been shown that NOS inhibition leads to increased fibrosis in the UUO model (60-62). Interestingly, recent studies reported that deficiency of ARG2 confers kidney protection in diabetic mouse model and that arginase 2 represents an important mechanism in inducing e-NOS uncoupling leading to oxidative stress and vascular inflammatory responses (52, 53, 63, 64). Second, increased arginase activity could induce the production of proline, essential for synthesis and deposition of collagen a major component of the extracellular matrix (e.g. fibrosis). There is a growing interest in the role of arginase in tissue remodeling and fibrosis, particularly in the lung (56). Up-regulation of both ARG1 and ARG2 isoforms has already been reported in bleomycin-induced lung fibrosis in mice and collagen synthesis from murine pulmonary fibroblasts can be blocked by arginase inhibitors (65, 66). The role of ARG1 versus ARG2 in obstructive nephropathy remains to be clarified. Since ARG2 co-localizes with OAT in mitochondria it has already been proposed that ARG2 would preferentially be the arginase isoform involved in proline production, whereas the co-localization of ARG1 and ODC would favour polyamine synthesis (67).
Collectively our data, starting with urinary proteome analysis in human samples of UPJ obstruction patients and combining those results with data obtained in the animal obstructive nephropathy model suggest that the arginine metabolism is disturbed in obstructive nephropathy. Induction of ARG2 could lead to activation of the proline formation pathway instead of a synthesis of polyamines that would ultimately result in synthesis/deposition of collagen. In the long term targeting the arginase pathway could have a therapeutic potential in kidney fibrosis.
by guest on December 17, 2020
https://www.mcponline.org
REFERENCES
1. Harambat, J., van Stralen, K. J., Kim, J. J., and Tizard, E. J. (2012) Epidemiology of
chronic kidney disease in children. Pediatr Nephrol 27, 363-373
2. Heinlen, J. E., Manatt, C. S., Bright, B. C., Kropp, B. P., Campbell, J. B., and
Frimberger, D. (2009) Operative versus nonoperative management of ureteropelvic junction obstruction in children. Urology 73, 521-525; discussion 525
3. Decramer, S., Bascands, J. L., and Schanstra, J. P. (2007) Non-invasive markers of
ureteropelvic junction obstruction. World J Urol 25, 457-465
4. Klein, J., Gonzalez, J., Miravete, M., Caubet, C., Chaaya, R., Decramer, S., Bandin,
F., Bascands, J. L., Buffin-Meyer, B., and Schanstra, J. P. (2011) Congenital ureteropelvic junction obstruction: human disease and animal models. Int J Exp Pathol 92, 168-192
5. Decramer, S., Gonzalez de Peredo, A., Breuil, B., Mischak, H., Monsarrat, B.,
Bascands, J. L., and Schanstra, J. P. (2008) Urine in clinical proteomics. Mol Cell Proteomics 7, 1850-1862
6. Hanash, S. (2003) Disease proteomics. Nature 422, 226-232
7. Drube, J., Zurbig, P., Schiffer, E., Lau, E., Ure, B., Gluer, S., Kirschstein, M., Pape, L.,
Decramer, S., Bascands, J. L., Schanstra, J. P., Mischak, H., and Ehrich, J. H. (2010) Urinary proteome analysis identifies infants but not older children requiring pyeloplasty.
Pediatr Nephrol 25, 1673-1678
8. Patel, K., Charron, M., Hoberman, A., Brown, M. L., and Rogers, K. D. (1993) Intra-
and interobserver variability in interpretation of DMSA scans using a set of standardized criteria. Pediatr Radiol 23, 506-509
9. MacKenzie, J. R. (1996) A review of renal scarring in children. Nucl Med Commun 17,
176-190
10. Decramer, S., Wittke, S., Mischak, H., Zurbig, P., Walden, M., Bouissou, F.,
Bascands, J. L., and Schanstra, J. P. (2006) Predicting the clinical outcome of congenital unilateral ureteropelvic junction obstruction in newborn by urinary proteome analysis. Nat
Med 12, 398-400
11. Smith, G., Barratt, D., Rowlinson, R., Nickson, J., and Tonge, R. (2005) Development
of a high-throughput method for preparing human urine for two-dimensional electrophoresis.
Proteomics 5, 2315-2318
12. Zerefos, P. G., Vougas, K., Dimitraki, P., Kossida, S., Petrolekas, A., Stravodimos, K.,
Giannopoulos, A., Fountoulakis, M., and Vlahou, A. (2006) Characterization of the human urine proteome by preparative electrophoresis in combination with 2-DE. Proteomics 6, 4346-4355
13. Adachi, J., Kumar, C., Zhang, Y., Olsen, J. V., and Mann, M. (2006) The human
urinary proteome contains more than 1500 proteins, including a large proportion of membrane proteins. Genome Biol 7, R80
14. Castagna, A., Cecconi, D., Sennels, L., Rappsilber, J., Guerrier, L., Fortis, F.,
Boschetti, E., Lomas, L., and Righetti, P. G. (2005) Exploring the hidden human urinary proteome via ligand library beads. J Proteome Res 4, 1917-1930
15. Kentsis, A., Monigatti, F., Dorff, K., Campagne, F., Bachur, R., and Steen, H. (2009)
Urine proteomics for profiling of human disease using high accuracy mass spectrometry.
Proteomics Clin Appl 3, 1052-1061
16. Marimuthu, A., O'Meally, R. N., Chaerkady, R., Subbannayya, Y., Nanjappa, V.,
Kumar, P., Kelkar, D. S., Pinto, S. M., Sharma, R., Renuse, S., Goel, R., Christopher, R., Delanghe, B., Cole, R. N., Harsha, H. C., and Pandey, A. (2011) A comprehensive map of the human urinary proteome. J Proteome Res 10, 2734-2743
17. Wong, J. C., Rossleigh, M. A., and Farnsworth, R. H. (1995) Utility of
technetium-99m-MAG3 diuretic renography in the neonatal period. J Nucl Med 36, 2214-2219
18. Grignon, A., Filion, R., Filiatrault, D., Robitaille, P., Homsy, Y., Boutin, H., and
Leblond, R. (1986) Urinary tract dilatation in utero: classification and clinical applications.
Radiology 160, 645-647
by guest on December 17, 2020
https://www.mcponline.org
19. Fernbach, S. K., Maizels, M., and Conway, J. J. (1993) Ultrasound grading of hydronephrosis: introduction to the system used by the Society for Fetal Urology. Pediatr
Radiol 23, 478-480
20. Maizels, M., Mitchell, B., Kass, E., Fernbach, S. K., and Conway, J. J. (1994)
Outcome of nonspecific hydronephrosis in the infant: a report from the Registry of the Society for Fetal Urology. J Urol 152, 2324-2327
21. Wisniewski, J. R., Zougman, A., Nagaraj, N., and Mann, M. (2009) Universal sample
preparation method for proteome analysis. Nat Methods 6, 359-362
22. Wisniewski, J. R., Ostasiewicz, P., and Mann, M. (2011) High recovery FASP applied
to the proteomic analysis of microdissected formalin fixed paraffin embedded cancer tissues retrieves known colon cancer markers. J Proteome Res 10, 3040-3049
23. Benjamini, Y., Drai, D., Elmer, G., Kafkafi, N., and Golani, I. (2001) Controlling the
false discovery rate in behavior genetics research. Behav Brain Res 125, 279-284
24. Mani, D. R., Abbatiello, S. E., and Carr, S. A. (2012) Statistical characterization of
multiple-reaction monitoring mass spectrometry (MRM-MS) assays for quantitative proteomics. BMC Bioinformatics 13 Suppl 16, S9
25. Abbatiello, S. E., Mani, D. R., Keshishian, H., and Carr, S. A. (2010) Automated
detection of inaccurate and imprecise transitions in peptide quantification by multiple reaction monitoring mass spectrometry. Clin Chem 56, 291-305
26. Bascands, J. L., and Schanstra, J. P. (2005) Obstructive nephropathy: insights from
genetically engineered animals. Kidney Int 68, 925-937
27. Chevalier, R. L., Forbes, M. S., and Thornhill, B. A. (2009) Ureteral obstruction as a
model of renal interstitial fibrosis and obstructive nephropathy. Kidney Int 75, 1145-1152
28. Schanstra, J. P., Neau, E., Drogoz, P., Arevalo Gomez, M. A., Lopez Novoa, J. M.,
Calise, D., Pecher, C., Bader, M., Girolami, J. P., and Bascands, J. L. (2002) In vivo bradykinin B2 receptor activation reduces renal fibrosis. J Clin Invest 110, 371-379
29. del Ara, R. M., Gonzalez-Polo, R. A., Caro, A., del Amo, E., Palomo, L., Hernandez,
E., Soler, G., and Fuentes, J. M. (2002) Diagnostic performance of arginase activity in colorectal cancer. Clin Exp Med 2, 53-57
30. Nagaraj, N., and Mann, M. (2011) Quantitative analysis of the intra- and
inter-individual variability of the normal urinary proteome. J Proteome Res 10, 637-645
31. Court, M., Selevsek, N., Matondo, M., Allory, Y., Garin, J., Masselon, C. D., and
Domon, B. (2011) Toward a standardized urine proteome analysis methodology. Proteomics 11, 1160-1171
32. Mouton-Barbosa, E., Roux-Dalvai, F., Bouyssie, D., Berger, F., Schmidt, E., Righetti,
P. G., Guerrier, L., Boschetti, E., Burlet-Schiltz, O., Monsarrat, B., and Gonzalez de Peredo, A. (2010) In-depth exploration of cerebrospinal fluid by combining peptide ligand library treatment and label-free protein quantification. Mol Cell Proteomics 9, 1006-1021
33. Grandaliano, G., Gesualdo, L., Bartoli, F., Ranieri, E., Monno, R., Leggio, A.,
Paradies, G., Caldarulo, E., Infante, B., and Schena, F. P. (2000) MCP-1 and EGF renal expression and urine excretion in human congenital obstructive nephropathy. Kidney Int 58, 182-192
34. Yang, Y., Hou, Y., Wang, C. L., and Ji, S. J. (2006) Renal expression of epidermal
growth factor and transforming growth factor-beta1 in children with congenital hydronephrosis. Urology 67, 817-821; discussion 821-812
35. Mischak, H., Allmaier, G., Apweiler, R., Attwood, T., Baumann, M., Benigni, A.,
Bennett, S. E., Bischoff, R., Bongcam-Rudloff, E., Capasso, G., Coon, J. J., D'Haese, P., Dominiczak, A. F., Dakna, M., Dihazi, H., Ehrich, J. H., Fernandez-Llama, P., Fliser, D., Frokiaer, J., Garin, J., Girolami, M., Hancock, W. S., Haubitz, M., Hochstrasser, D., Holman, R. R., Ioannidis, J. P., Jankowski, J., Julian, B. A., Klein, J. B., Kolch, W., Luider, T., Massy, Z., Mattes, W. B., Molina, F., Monsarrat, B., Novak, J., Peter, K., Rossing, P., Sanchez-Carbayo, M., Schanstra, J. P., Semmes, O. J., Spasovski, G., Theodorescu, D., Thongboonkerd, V., Vanholder, R., Veenstra, T. D., Weissinger, E., Yamamoto, T., and Vlahou, A. (2010) Recommendations for biomarker identification and qualification in clinical proteomics. Sci Transl Med 2, 46ps42
by guest on December 17, 2020
https://www.mcponline.org
36. Mischak, H., Apweiler, R., Banks, R. E., Conaway, M., Coon, J., Dominiczak, A., Ehrich, J. H., Fliser, D., Girolami, M., Hermjakob, H., Hochstrasser, D., Jankowski, J., Julian, B. A., Kolch, W., Massy, Z. A., Neusuess, C., Novak, J., Peter, K., Rossing, K., Schanstra, J., Semmes, O. J., Theodorescu, D., Thongboonkerd, V., Weissinger, E. M., Van Eyk, J. E., and Yamamoto, T. (2007) Clinical proteomics: A need to define the field and to begin to set adequate standards. Proteomics Clin Appl 1, 148-156
37. Cederbaum, S. D., Yu, H., Grody, W. W., Kern, R. M., Yoo, P., and Iyer, R. K. (2004)
Arginases I and II: do their functions overlap? Mol Genet Metab 81 Suppl 1, S38-44
38. Goo, Y. A., Cain, K., Jarrett, M., Smith, L., Voss, J., Tolentino, E., Tsuji, J., Tsai, Y. S.,
Panchaud, A., Goodlett, D. R., Shulman, R. J., and Heitkemper, M. (2012) Urinary proteome analysis of irritable bowel syndrome (IBS) symptom subgroups. J Proteome Res 11, 5650-5662
39. Kentsis, A., Shulman, A., Ahmed, S., Brennan, E., Monuteaux, M. C., Lee, Y. H.,
Lipsett, S., Paulo, J. A., Dedeoglu, F., Fuhlbrigge, R., Bachur, R., Bradwin, G., Arditi, M., Sundel, R. P., Newburger, J. W., Steen, H., and Kim, S. (2013) Urine proteomics for discovery of improved diagnostic markers of Kawasaki disease. EMBO Mol Med 5, 210-220
40. Wright, C. A., Howles, S., Trudgian, D. C., Kessler, B. M., Reynard, J. M., Noble, J.
G., Hamdy, F. C., and Turney, B. W. (2011) Label-free quantitative proteomics reveals differentially regulated proteins influencing urolithiasis. Mol Cell Proteomics 10, M110 005686
41. Zoidakis, J., Makridakis, M., Zerefos, P. G., Bitsika, V., Esteban, S., Frantzi, M.,
Stravodimos, K., Anagnou, N. P., Roubelakis, M. G., Sanchez-Carbayo, M., and Vlahou, A. (2012) Profilin 1 is a potential biomarker for bladder cancer aggressiveness. Mol Cell
Proteomics 11, M111 009449
42. Lee, R. S., Monigatti, F., Briscoe, A. C., Waldon, Z., Freeman, M. R., and Steen, H.
(2008) Optimizing sample handling for urinary proteomics. J Proteome Res 7, 4022-4030
43. Thongboonkerd, V. (2007) Practical points in urinary proteomics. J Proteome Res 6,
3881-3890
44. Chen, C. L., Lai, Y. F., Tang, P., Chien, K. Y., Yu, J. S., Tsai, C. H., Chen, H. W., Wu,
C. C., Chung, T., Hsu, C. W., Chen, C. D., Chang, Y. S., Chang, P. L., and Chen, Y. T. (2012) Comparative and targeted proteomic analyses of urinary microparticles from bladder cancer and hernia patients. J Proteome Res 11, 5611-5629
45. Chen, Y. T., Chen, H. W., Domanski, D., Smith, D. S., Liang, K. H., Wu, C. C., Chen,
C. L., Chung, T., Chen, M. C., Chang, Y. S., Parker, C. E., Borchers, C. H., and Yu, J. S. (2012) Multiplexed quantification of 63 proteins in human urine by multiple reaction monitoring-based mass spectrometry for discovery of potential bladder cancer biomarkers. J
Proteomics 75, 3529-3545
46. Huttenhain, R., Soste, M., Selevsek, N., Rost, H., Sethi, A., Carapito, C., Farrah, T.,
Deutsch, E. W., Kusebauch, U., Moritz, R. L., Nimeus-Malmstrom, E., Rinner, O., and Aebersold, R. (2012) Reproducible quantification of cancer-associated proteins in body fluids using targeted proteomics. Sci Transl Med 4, 142ra194
47. Li, Z., Zhao, Z., Liu, X., Su, Z., Shang, X., and Wen, J. (2012) Prediction of the
outcome of antenatal hydronephrosis: significance of urinary EGF. Pediatr Nephrol 27, 2251-2259
48. Thongboonkerd, V., and Malasit, P. (2005) Renal and urinary proteomics: current
applications and challenges. Proteomics 5, 1033-1042
49. Schwartz, I. F., Davidovitz, A., Chernichovski, T., Levin-Iaina, N., Guzner-Gur, H.,
Levo, Y., and Schwartz, D. (2008) Arginine transport is augmented, through modulation of cationic amino acid transporter-1, in obstructive uropathy in rats. Kidney Blood Press Res 31, 210-216
50. Wu, G., and Morris, S. M., Jr. (1998) Arginine metabolism: nitric oxide and beyond.
Biochem J 336 ( Pt 1), 1-17
51. Morris, S. M., Jr. (2007) Arginine metabolism: boundaries of our knowledge. J Nutr
137, 1602S-1609S
52. Ming, X. F., Rajapakse, A. G., Yepuri, G., Xiong, Y., Carvas, J. M., Ruffieux, J.,
Scerri, I., Wu, Z., Popp, K., Li, J., Sartori, C., Scherrer, U., Kwak, B. R., Montani, J. P., and
by guest on December 17, 2020
https://www.mcponline.org
Yang, Z. (2012) Arginase II Promotes Macrophage Inflammatory Responses Through Mitochondrial Reactive Oxygen Species, Contributing to Insulin Resistance and Atherogenesis. J Am Heart Assoc 1, e000992
53. Morris, S. M., Jr., Gao, T., Cooper, T. K., Kepka-Lenhart, D., and Awad, A. S. (2011)
Arginase-2 mediates diabetic renal injury. Diabetes 60, 3015-3022
54. Gronros, J., Jung, C., Lundberg, J. O., Cerrato, R., Ostenson, C. G., and Pernow, J.
(2011) Arginase inhibition restores in vivo coronary microvascular function in type 2 diabetic rats. Am J Physiol Heart Circ Physiol 300, H1174-1181
55. Olivon, V. C., Fraga-Silva, R. A., Segers, D., Demougeot, C., de Oliveira, A. M.,
Savergnini, S. S., Berthelot, A., de Crom, R., Krams, R., Stergiopulos, N., and da Silva, R. F. (2013) Arginase inhibition prevents the low shear stress-induced development of vulnerable atherosclerotic plaques in ApoE-/- mice. Atherosclerosis 227, 236-243
56. Maarsingh, H., Pera, T., and Meurs, H. (2008) Arginase and pulmonary diseases.
Naunyn Schmiedebergs Arch Pharmacol 378, 171-184
57. Bratt, J. M., Franzi, L. M., Linderholm, A. L., O'Roark, E. M., Kenyon, N. J., and Last,
J. A. (2010) Arginase inhibition in airways from normal and nitric oxide synthase 2-knockout mice exposed to ovalbumin. Toxicol Appl Pharmacol 242, 1-8
58. Durante, W., Johnson, F. K., and Johnson, R. A. (2007) Arginase: a critical regulator
of nitric oxide synthesis and vascular function. Clin Exp Pharmacol Physiol 34, 906-911
59. Mori, M. (2007) Regulation of nitric oxide synthesis and apoptosis by arginase and
arginine recycling. J Nutr 137, 1616S-1620S
60. Morrissey, J. J., Ishidoya, S., McCracken, R., and Klahr, S. (1996) Nitric oxide
generation ameliorates the tubulointerstitial fibrosis of obstructive nephropathy. J Am Soc
Nephrol 7, 2202-2212
61. Miyajima, A., Chen, J., Poppas, D. P., Vaughan, E. D., Jr., and Felsen, D. (2001) Role
of nitric oxide in renal tubular apoptosis of unilateral ureteral obstruction. Kidney Int 59, 1290-1303
62. Manucha, W., and Valles, P. G. (2008) Cytoprotective role of nitric oxide associated
with Hsp70 expression in neonatal obstructive nephropathy. Nitric Oxide 18, 204-215
63. You, H., Gao, T., Cooper, T. K., Morris, S. M., Jr., and Awad, A. S. (2013) Arginase
inhibition mediates renal tissue protection in diabetic nephropathy by a nitric oxide synthase 3-dependent mechanism. Kidney Int 84, 1189-1197
64. Yang, Z., and Ming, X. F. (2013) Arginase: the emerging therapeutic target for
vascular oxidative stress and inflammation. Front Immunol 4, 149
65. Kitowska, K., Zakrzewicz, D., Konigshoff, M., Chrobak, I., Grimminger, F., Seeger,
W., Bulau, P., and Eickelberg, O. (2008) Functional role and species-specific contribution of arginases in pulmonary fibrosis. Am J Physiol Lung Cell Mol Physiol 294, L34-45
66. Endo, M., Oyadomari, S., Terasaki, Y., Takeya, M., Suga, M., Mori, M., and Gotoh, T.
(2003) Induction of arginase I and II in bleomycin-induced fibrosis of mouse lung. Am J
Physiol Lung Cell Mol Physiol 285, L313-321
67. Ozaki, M., Gotoh, T., Nagasaki, A., Miyanaka, K., Takeya, M., Fujiyama, S., Tomita,
K., and Mori, M. (1999) Expression of arginase II and related enzymes in the rat small intestine and kidney. J Biochem 125, 586-593
68. Spector, E. B., Rice, S. C., and Cederbaum, S. D. (1983) Immunologic studies of
arginase in tissues of normal human adult and arginase-deficient patients. Pediatr Res 17, 941-944
69. Choi, S., Park, C., Ahn, M., Lee, J. H., and Shin, T. (2012) Immunohistochemical
study of arginase 1 and 2 in various tissues of rats. Acta Histochem 114, 487-494
70. Crombez, E. A., and Cederbaum, S. D. (2005) Hyperargininemia due to liver arginase
deficiency. Mol Genet Metab 84, 243-251
by guest on December 17, 2020
https://www.mcponline.org
ACKNOWLEDGEMENTS
The work in this study was funded by the Agence Nationale pour la Recherche (Beyond Markers, ANR-07-PHYSIO-004-01) program. SD, FB and JLB acknowledge support by Inserm and the “Direction Régional Clinique” (CHU de Toulouse, France) under the Interface program. JPS was supported by Inserm and the “Direction de la Recherché Médicale et Innovation” (CHU de Toulouse, France) under the “Contrat Hospitalier de Recherche Translationnelle” program. The work was supported in part by grants from the Région Midi-Pyrénées, European funds (FEDER), and the French Ministery of Research (Investissements d'avenir, Proteomics French Infrastructure) to BM and OBS. We would like to acknowledge the skilled technical help of JJ Maoret from the GET TQ (www.genotoul.fr) facility for the QPCR analysis.
by guest on December 17, 2020
https://www.mcponline.org
FIGURE LEGENDS
Figure 1: Study layout for the identification of new proteins involved in the pathophysiology of congenital unilateral UPJ obstruction.
Urine samples from newborns less than 1 year old were divided into 4 groups: bladder urine from healthy individuals (Healthy), bladder urine from patients with mild obstruction that evolve towards spontaneous resolution of the obstruction (Mild), bladder urine from patients with severe obstruction that need surgery (Severe-Bladder) and pelvis urine from patients with severe obstruction that was collected during surgery (Severe-Pelvis). A, Urine protein biomarker candidates discovery by label-free quantitative LC-MS/MS analysis of urinary proteome of the 4 groups (n=5/group). Urinary samples were centrifuged to remove cell debris then subjected to an adaptation of the filter-aided sample preparation (FASP) method (21) to concentrate, desalt, reduce, alkylate, and digest urine proteins in an ultrafiltration device. Tryptic urine peptides were analyzed in triplicate by nanoLC-MS/MS analysis and label-free quantification of urinary protein candidates was performed as described. B, Selected candidates from the discovery phase were verified by Western blot analysis and targeted proteomics using a new cohort of patients. C, Unilateral ureteral obstruction (UUO), an experimental mouse model of obstructive nephropathy was used to assess renal expression of a candidate protein biomarker and its modulation during pathology.
Figure 2: Quantitative analysis of urinary proteome following UPJ obstruction.
A, Statistical analysis of pairwise analysis of Severe-Pelvis or Severe-Bladder or Mild versus
Healthy. The number of peptides before and after missing value imputation and the total number of proteins statistically analyzed are indicated for each pairwise comparison. The total number of proteins detected as differentially secreted (Student’s t test with p < 0.05) is indicated as well as the number of proteins under- and over-secreted. Proteins that survived multiple testing correction (Benjamini-Hochberg adjustment) are also indicated. B, Volcano plots showing t test p-values (-log10) versus protein ratios between control and patients (log2). All proteins with a Student’s t test p-value below 0.05 were considered significant. Red and green dots indicate proteins with increased or decreased urinary abundance, respectively. Grey dots indicate proteins that not significantly changed in the different comparisons.
by guest on December 17, 2020
https://www.mcponline.org
Figure 3: A, Cellular arginine metabolism and putative role of arginase in the development of renal fibrosis.
ARG1 is a cytosolic enzyme known to be expressed in the kidney (68, 69). It was originally identified in liver hepatocytes, where it catalyses the hydrolysis of L-arginine to L-ornithine and urea in the final step of the urea cycle that allows ammonia detoxification (70). Free arginine is derived from diet, protein turnover or endogenous synthesis. Neo-synthesis from citrulline occurs via successive actions of Arginine succinate synthase (ASS) and Arginine succinate lyase (ASL). Cellular uptake of L-arginine is mediated by the Cationic amino acid Transporters CATs. Intracellular L-arginine can further be metabolized via two main distinct pathways: L-arginine is catabolyzed to L- citrulline and NO by NO synthases (NOS) (grey boxes) or alternatively to L-ornithine and urea by arginases (ARG) (light boxes). Evidence from literature shows that, in this context, arginase can be considered as a key regulator of pro- or anti-fibrotic pathways. First by substrate competition with nitric oxide (NO) synthases, arginases can regulate the production of NO known to have anti-fibrotic properties. Second, via ornithine production, arginase acts upstream from the mitochondrial ornithine aminotransferase (OAT) and can control proline formation essential for collagen synthesis in fibrosis. B, Proposed changes in the arginase pathway in obstructive nephropathy. The data suggest that obstructive nephropathy induces arginine transport and activation of the profibrotic arginase pathway via activation (red) of ARG2, increased expression of OAT, P5CR and P5CS and decreased expression (green) of proDH, P5CD and ODC leading to increased proline availability and collagen synthesis.
Key to abbreviations: CAT, Cationic amino acid transporter; ASS, Arginine succinate synthase; ASL, Arginine succinate lyase; ARG, Arginases; NOS, Nitric oxide synthase;
NOHA, N-Hydroxy-L-arginine; ODC, Ornithine decarboxylase; OAT, Ornithine
aminotransferase; P5C, Pyrroline-5-carboxylate; P5CS, P5C synthase, P5CR, P5C reductase; P5CD, P5C dehydrogenase; ProDH, Proline dehydrogenase; NO, nitric oxide.
Figure 4: Verification of modified urinary abundance of ARG1 by immunohistochemistry and MRM in a new patient cohort.
A, Representative Western blot analysis shows a large variability in urinary ARG1
abundance in healthy subjects and a reduced urinary abundance in UPJ obstruction patients (10 µg total urinary proteins/lanes). B, Densitometric analysis of Western blot analyses. Values of anti-ARG1 immunoreactivities were normalized by the quantity of albumin present in each sample as determined by Ponceau coloration. The lines represent the mean ARG1 expression in each group. C, LC-MRM analysis shows that urinary ARG1 concentration is lower in UPJ obstruction patients. Logarithmic plots of the ARG1 protein concentration
by guest on December 17, 2020
https://www.mcponline.org