HAL Id: hal-02271740
https://hal.sorbonne-universite.fr/hal-02271740
Submitted on 27 Aug 2019
HAL is a multi-disciplinary open access
archive for the deposit and dissemination of
sci-entific research documents, whether they are
pub-lished or not. The documents may come from
teaching and research institutions in France or
abroad, or from public or private research centers.
L’archive ouverte pluridisciplinaire HAL, est
destinée au dépôt et à la diffusion de documents
scientifiques de niveau recherche, publiés ou non,
émanant des établissements d’enseignement et de
recherche français ou étrangers, des laboratoires
publics ou privés.
Insulin receptor isoform A favors tumor progression in
human hepatocellular carcinoma by increasing
stem/progenitor cell features
Eva Benabou, Zeina Salamé, Dominique Wendum, Marie Lequoy, Sylvana
Tahraoui, Fatiha Merabtene, Yves Chrétien, Olivier Scatton, Olivier
Rosmorduc, Laura Fouassier, et al.
To cite this version:
Eva Benabou, Zeina Salamé, Dominique Wendum, Marie Lequoy, Sylvana Tahraoui, et al..
Insulin receptor isoform A favors tumor progression in human hepatocellular carcinoma by
increasing stem/progenitor cell features.
Cancer Letters, Elsevier, 2019, 450, pp.155-168.
�10.1016/j.canlet.2019.02.037�. �hal-02271740�
Insulin receptor isoform A favors tumor progression in human hepatocellular
carcinoma by increasing stem/progenitor cell features
Eva Benaboua, Zeina Salaméa, Dominique Wenduma,b,c, Marie Lequoya,d, Sylvana Tahraouia, Fatiha Merabtenec, Yves Chrétiena, Olivier Scattona,e, Olivier Rosmorduca,f, Laura Fouassiera, Laetitia Fartouxa,f, Françoise Praza, Christèle Desbois-Mouthona,*
a Sorbonne Université, INSERM, Saint-Antoine Research Center, F-75012, Paris, France b AP-HP, Saint-Antoine Hospital, Department of Pathology, F-75012, Paris, France c Histomorphology Platform, UMS 30 Lumic, F-75012, Paris, France
d AP-HP, Saint-Antoine Hospital, Department of Hepatology, F-75012, Paris, France
e AP-HP, Pitié-Salpétrière Hospital, Department of Hepatobiliary Surgery and Liver Transplantation, F-75013, Paris,
France
f AP-HP, Pitié-Salpétrière Hospital, Department of Hepatology, F-75013, Paris, France
* Corresponding author: Dr Christèle Desbois-Mouthon, INSERM UMR_S938, Centre de Recherche
Saint-Antoine, 34 rue Crozatier, 75012 PARIS, France; christele.desbois-mouthon@inserm.fr; 33 1 49 28 46 98
Abstract (186 words)
Hepatocellular carcinoma (HCC) is one of the most common and deadly neoplasms. Insulin receptor (IR) exists in two isoforms, IR-A and IR-B, the latter being predominantly expressed in normal adult hepatocytes while IR-A is overexpressed in HCC to the detriment of IR-B. This study evaluated the biological functions associated with IR-A overexpression in HCC in relation to expression of its ligand IGF-II. The value of INSRA:INSRB ratio which was increased in ˜70% of 85 HCC was associated with stem/progenitor cell features such as cytokeratin-19 and a-fetoprotein and correlated with shorter patient survival. IGF2 mRNA upregulation was observed in 9.4% of HCC and was not associated with higher INSRA:INSRB ratios. Ectopic overexpression of IR-A in two HCC cell lines presenting a strong autocrine IGF-II secretion loop or not stimulated cell migration and invasion. In cells cultured as spheroids, IR-A overexpression promoted gene programs related to stemness, inflammation and cell movement. IR-A also increased cell line tumorigenicity in vivo after injection to immunosuppressed mice and the sphere-forming cells made a significant contribution to this effect. Altogether, these results demonstrate that IR-A is a novel player in HCC progression.
1. Introduction1
Hepatocellular carcinoma (HCC) is the second cause of cancer-related death worldwide and the fifth most common malignancy [1]. HCC is induced by multiple etiologies and exhibits substantial heterogeneity, which complicates the development of effective therapies. HCC harboring stem/progenitor cell features are of poorer outcome [2]. Despite advances in the molecular and genetic profiling, the molecular pathogenesis of HCC is still not fully understood. Due to the expected increase in HCC incidence within the next years which will be mostly driven by obesity and diabetes [3], studies on the molecular checkpoints involved in HCC progression and aggressiveness represent an important issue.
The insulin receptor (IR) tyrosine kinase (TK) exists in two isoforms, IR-A and IR-B, due to alternative splicing of exon 11 encoding 12 amino acids located at the carboxy-terminal domain of extracellular subunits. IR-B (long form) is mainly expressed in insulin target cells, i.e adult hepatocytes, skeletal muscle cells and adipocytes. IR-B binds only insulin at physiological concentrations and especially conveys hormone effects on glucose and lipid metabolism. IR-A (short form) is the predominant isoform expressed during fetal development and binds not only insulin but also insulin-like growth factor-II (IGF-II) with high affinity [4]. Up-regulation of INSRA has been observed in a variety of human cancer cell lines and tumors [5]. In HCC, we previously reported that INSRA is frequently upregulated to the detriment of INSRB thus raising the INSRA:INSRB expression ratio [6, 7]. The expression shift from INSRB towards INSRA was related to epidermal growth factor (EGF) receptor-mediated dysregulation of specific RNA splicing factors favoring exon 11 exclusion from INSR pre-mRNA [6]. In addition, we recently showed that the expression levels of INSRA pre-mRNA in an experimental model of HCC reflect plasma levels of IR-A suggesting that the measurement of circulating IR-A may assist HCC management [8]. The role of IR-A in HCC remains to be elucidated.
At the molecular level, IR-A is thought to signal in response to IGF-II as some malignant cells exhibit both autocrine production of II and IR-A overexpression [9-11]. The consequences of IGF-II/IR-A expression on cancer cell biology have been investigated mainly in vitro and were essentially focused on proliferation and invasion such as in leiomyosarcoma [12] and prostate cancer cells [13].
Abbreviations: AFP, a-fetoprotein; CK19, cytokeratin 19; EGF, epidermal growth factor; EMT, epithelial-mesenchymal transition; GFP, green fluorescent protein; GSEA, gene set enrichment analysis; HCC, hepatocellular carcinoma; IF, immunofluorescence; IHC, immunohistochemistry; IPA, ingenuity pathway analysis; IR, insulin receptor; IGF1R, insulin-like growth factor-I receptor; IGF-II, insulin-like growth factor-II; qPCR, quantitative real-time PCR; RT, reverse transcription; SEM, standard error of the mean; TGF, transforming growth factor; TK, tyrosine kinase
There is a need to extend these findings to human tumors by examining whether IR-A expression is associated to aggressiveness markers in tumors and bad prognosis in patients with cancer.
Interestingly, the last years have seen renewed interest for the study of IR-A signaling in cancer. Indeed, elevated expression as well as compensatory activation of IR-A have been identified as intrinsic and adaptive resistance mechanisms to IGF1 receptor (IGF1R) therapies [14-18]. To overcome this problem, therapeutic strategies targeting IGF-II, a ligand common to IR-A and IGF1R, are currently under clinical investigation. The recent pre-clinical evaluation of a neutralizing antibody against IGF-II provided encouraging results in HCC [19].
In this context, the aim of the present study was to define the contribution of IR-A-dependent signaling to HCC progression. We examined the relationship between IR-A and IR-B expression and the clinicopathological features of HCC and studied the impact of ectopic overexpression of A or IR-B on HCC cell biology using human cell lines possessing a strong autocrine IGF-II loop or not.
2. Materials and methods
2.1 Patients and human liver tissue specimens. HCC and paired non-tumor liver tissues were
collected from 85 patients who underwent curative liver resection. The clinicopathological characteristics have been published elsewhere [7]. All patients gave informed consent to the study, which was conducted in accordance with the French laws and regulations (CNIL n° 1913901 v 0).
2.2 Cell culture and treatments. Huh7 cells were obtained from the American Type Culture Collection.
PLC/PRF5 cells were provided by Dr Christine Perret (Institut Cochin, France). Cell lines were authenticated using short tandem repeats as described [20], cultured as previously reported [21] and routinely controlled for mycoplasma contamination. In some experiments, serum-deprived cells were treated with insulin, IGF-II (Sigma-Aldrich) or TGF-b1 (Preprotech). HCC cell lines were transfected with plasmids expressing human IR-A (pRcCMVi.hIR-A(GFP)) or IR-B (pRcCMVi.hIR-B(GFP)) fused to green fluorescent protein (GFP) [22-26] using LipofectamineTM 3000 and selected with G418 (ThermoFisher Scientific). After two rounds of selection based on GFP expression by flow cytometry cell sorting (MoFlo® AstriosTM, Beckman Coulter), pools of stably transfected cell lines were established.
2.3 Xenografts. Mice were maintained in accordance with the French guidelines for the humane
treatment and care of laboratory animals (agreement N° 01350.02). Subcutaneous xenografts were performed in 5-weeks old female nude (Hsd:athymic Nude-Foxn1nu, Envigo) and NOD/SCID (NOD.Cg-Prkdcscid Il2rgtm1Wjl/SzJ, Charles River) mice as reported elsewhere [21].
2.4 Immunoblotting. Protein electrophoresis and transfer to nitrocellulose were performed according
to standard procedures. The primary antibodies are summarized in Supplementary Table S1. Blot quantifications were performed using ChemiDocTM Touch Imaging System (BioRad). The phosphorylation status of 42 human RTKs was determined by Proteome ProfilerTM array (R&D Systems).
2.5 RNA interference. The expression of IGF2 mRNA was downregulated using a mixture of four
siRNAs (ON-TARGETplusTM SMARTpool) and DharmaFECT® 4 transfection reagent. Control experiments were performed using a non-targeting siRNA pool (Dharmacon).
2.6 RNA isolation, reverse transcription (RT) and quantitative real-time PCR (qPCR). RNA
isolation, RT and qPCR using specific primers (Supplementary Table S2) were performed as reported elsewhere [6].
2.7 Immunohistochemistry (IHC). Paraffin-embedded 4-μm sections were dewaxed in xylene and
rehydrated in graded alcohol series and antigen retrieval was performed in EDTA pH 9.0 during 15 min at 95°C. Primary antibody (1:30, 30 min, Supplementary Table S1) was detected using Novolink Polymer Detection System (Leica Biosystems). Aminoethyl carbazole was used to reveal the peroxidase activity (Vector laboratories). The sections were counterstained with haematoxylin.
2.8 Proliferation assay. Twenty thousand cells were seeded in triplicate in 24-well plates and cell
numbers were evaluated 48, 72 and 96 h later.
2.9 Migration and invasion assays. Migration and invasion assays were performed in Transwells®
(Corning) with 8-μm pore polycarbonate membrane insert coated (invasion) or not (migration) with Matrigel® as reported previously [27].
2.10 Sphere formation assay. One thousand cells were plated onto ultra-low attachment 6-well plates
(Corning) and cultured in DMEM/F12 medium with B27 supplement, 20 ng/mL EGF, 20 ng/mL basic fibroblast growth factor and 100 µg/mL gentamycin (Life Technologies) during 14 days.
2.11 Immunofluorescence (IF). Hepatospheres were fixed with 4% paraformaldehyde, permeabilized
with 0.2% Triton X-100, blocked with 3% BSA and 10% goat serum in PBS, followed by an overnight incubation with the primary antibody (1:50 dilution) in PBS at 4°C (Supplementary Table S1). Spheres were then incubated with a 1:200 dilution of conjugated secondary antibody (Alexa Fluor® 546 dye) in PBS for 1 h at room temperature, washed and incubated with 4′,6-diamidino-2-phenylindole (DAPI) for nucleus staining.
2.12 Transcriptome analysis. Gene expression profiles from three tumors/spheres derived from Huh7
cells stably expressing the empty construct or pRcCMVi.hIR-A(GFP) were analyzed using GeneChipTM human gene 2.0 ST array (Affymetrix). Datasets are available at GSE111707. Gene set enrichment analysis (GSEA) [28] was performed using the MSigDB hallmark gene set collection and C2 collection of curated gene sets. Ingenuity pathway analysis (IPA) software (Ingenuity Systems) was used to identify top biological functions and networks.
2.13 Statistical Analyses. Statistical analyses were performed using SPSS software (IBM Corp.) or
GraphPad Prism (GraphPad Software, Inc.). When data sets met normal distribution criteria, two-sided Student t test analysis (for two-group comparisons) and one-way analysis of variance (if more than two groups were compared) were used. A Bonferroni test was used as a post-hoc test. If data did not meet normal distribution criteria, Mann–Whitney U-test (for two-group comparisons) and Kruskal–Wallis test
(if more than two groups were compared) were used. A Dunn’s test was used as a post-hoc test. Survival analysis was done by the Kaplan–Meier method and the two groups were compared with the log-rank test. Correlations between mRNA expression levels were conducted using Spearman rank correlation coefficient. Data from in vitro experiments are reported as mean ± standard error of the mean (SEM) of at least three independent experiments. Differences were considered statistically significant at p<0.05.
3. Results
3.1 A high INSRA:INSRB ratio is associated with clinicopathological markers of HCC aggressiveness
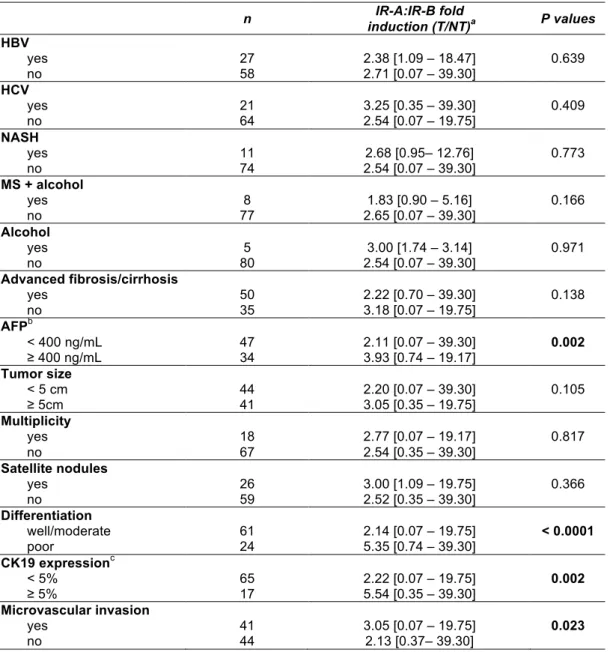
We previously reported that the INSRA:INSRB ratio was increased in ˜70% of HCC [6, 7]. Here we examined whether aberrant expression of IR isoforms was linked to specific clinicopathological characteristics. No significant association was found between the INSRA:INSRB ratio in HCC and the different etiologies (Table 1). In contrast, a high INSRA:INSRB ratio was associated with histological and biological markers reminiscent of tumors with poor outcome such as poor differentiation, microvascular invasion, high serum levels of a-fetoprotein (AFP), and expression of cytokeratin 19 (CK19), the two latter being validated biomarkers for HCC with hepatic progenitor cell features (Table
1, Figure 1a). Moreover, patients with a high INSRA:INSRB ratio had a significant shorter overall
survival after curative resection (Figure 1b). Of note, no association with clinicopathological characteristics was observed when total INSR gene expression was considered (data not shown). The examination of the status of the high affinity ligand IGF-II showed a bimodal distribution of IGF2 mRNA fold change in tumors with only eight specimens out of 85 (9.4%) having a fold-change ≥ 7 (Figure 1c). Most of these tumors were CK19 and AFP positive tumors (Supplementary Table S3). There was no association between INSRA:INSRB ratio and IGF2 expression level (Figure 1d). Thus, the deregulation of INSRA:INSRB ratio is more common than the overexpression of IGF2 in HCC. Finally, we observed an inverse relationship between INSRA:INSRB ratio and mRNA encoding GRB14, a physiological negative regulator of IR TK activity that we recently reported to be frequently down-regulated in HCC [7] (Figure 1e).
3.2 Ectopic overexpression of IR-A increases migration and invasion in Huh7 cells with IGF-II autocrine loop
To examine how IR-A impacts the biology of HCC cells, we generated pools of Huh7 cells stably overexpressing human IR-A (Huh7-IR-A), IR-B (Huh7-IR-B) or the empty vector (Huh7-pRC). Huh7 cells possess a strong autocrine production of IGF-II (Supplementary Figure S1). Each IR isoform was tagged with monomeric GFP fused to the C-terminal domain of the β-subunit. The addition of monomeric GFP was reported to have no impact on IR synthesis and ligand-mediated activation and signaling [22-26]. RT-qPCR (Figure 2a) and Western blotting (Figures 2b,c) confirmed that chimeric IR were expressed
to similar and physiological levels in Huh7-IR-A and Huh7-IR-B cells. Basal phosphorylation of IR-GFP and AKT was increased in Huh7-IR-A cells compared to Huh7-IR-B cells (Figures 2b,d) and resulted from IGF-II autocrine loop as phosphorylation was abolished by an IGF2 siRNA (Figure 2f). Endogenous IR which was mainly IR-B isoform in this cell line [6] was activated by insulin. IGF-II had no effect on IR-GFP phosphorylation in Huh7-IR-B cells while insulin increased IR-GFP and AKT phosphorylation in these cells (Figures 2b,e). Therefore, tagged IRs were efficiently expressed in Huh7 cells and retained their ability to undergo autophosphorylation and activate downstream signaling in response to their specific ligands. In addition, phospho-RTK array showed that IR was the sole RTK which was overactivated in Huh7-IR-A cells cultured in serum-free conditions (Figure 2g).
We then studied the impact of ectopic overexpression of IR-A on proliferation, migration and invasion in Huh7 cells. We did not find evidence for increased cell proliferation in IR-A-overexpressing Huh7 cells as assessed by direct cell counting (Figure 3a). In contrast, Huh7-IR-A cells displayed increased migratory and invasive properties while Huh7-IR-B cells behaved as control cells (Figures
3b,c). IGF2 siRNA reduced the invasive potential of Huh7-IR-A cells (Supplementary Figure S2). These
data led us to examine whether IR-A could regulate epithelial-mesenchymal transition (EMT). Microscopic examination showed that individually scattered cells were more frequent among Huh7-IR-A cells compared to Huh7-pRC cells and Huh7-IR-B cells (3.25 ± 0.55%, 0.56 ± 0.19% and 0.48 ± 0.17%, respectively; p=0.03) (Figure 3d). While Huh7-IR-A cells were able to undergo EMT under TGF-b1 treatment (Supplementary Figure S3), the expression of EMT-related markers was unaltered in Huh7-IR-A cells compared to Huh7-pRC and Huh7-IR-B (Figures 3e,f). Altogether these data indicate that ectopic overexpression of IR-A has marked effects on Huh7 cell biology in vitro by promoting cell migratory and invasive properties in response to autocrine IGF-II but independently of an EMT induction.
3.3 Ectopic overexpression of IR-A promotes the expression of cancer stem/progenitor cell (CSC) markers in Huh7 cells with IGF-II autocrine loop
As the INSRA:INSRB ratio was enriched in human tumors with CSC features (Table 1, Figure 1a), we examined whether the ectopic overexpression of IR-A may affect cancer cell plasticity. CSCs can be enriched in vitro by culturing cancer cells as spheroids in non-adherent conditions [29, 30]. We took advantage of this method to examine whether IR-A overexpression may affect the CSC contingent in Huh7 cells. As shown in Figure 4a, the ability of Huh7-IR-A cells to form spheroids was similar to that
of Huh7-pRC and Huh7-IR-B cells. However, Huh7-IR-A spheres were structures with irregular edges, comprising cohesive but loosely packed cells while control and Huh7-IR-B spheres were tightly packed and cohesive within a well-defined border (Figure 4b). Huh7-pRC spheres expressed significantly higher levels of INSRA mRNA compared to adherent Huh7-pRC cells suggesting a potential role for IR-A in CSCs (Figure 4c). The expression of ectopically expressed INSR isoforms was similar between Huh7-IR-A and Huh7-IR-B spheres (Figure 4d). A comparative transcriptomic analysis followed by GSEA showed that Huh7-IR-A spheres were enriched in signatures related to stem cell/progenitor cells compared to Huh7-pRC spheres (Figure 4e and Supplementary Figure S4a). Using RT-qPCR, we observed that Huh7-IR-A spheres expressed higher levels of CSC markers including KRT19 mRNA while Huh7-IR-B spheres showed a marked downregulation of KRT19 and PROM1/CD133 expression in comparison with control spheres (Figure 4f). The upregulation of CK19 was confirmed in Huh7-IR-A spheres by immunofluorescence (Figure 4g). GSEA also identified significant enrichment of inflammatory signatures in Huh7-IR-A spheres (Supplementary Figure S4b). Moreover, pathways related to migration and invasion of cancer cells were up-regulated in Huh7-IR-A spheres (Supplementary Figure S4c) which supported our previous in vitro data showing higher migratory and invasive potentials for Huh7-IR-A cells (Figures 3b,c).
3.3 Ectopic overexpression of IR-A increases tumorigenicity of Huh7 cells with IGF-II autocrine loop
Next, we compared the propensity of the three cell lines to favor tumor development after subcutaneous injection of 2 x 10⁶ cells to nude mice. Tumor appearance and growth were increased markedly with Huh7-IR-A compared with Huh7-pRC cells while tumors obtained from Huh7-IR-B cells behave as controls (Figure 5a and Supplementary Table S4).. To evaluate whether cells contained in Huh7-IR-A spheroids contributed to increased tumorigenesis, we injected as few as 1x 10³ spheroids-derived cells to NOD/SCID mice. As shown in Figure 5b, 75% of mice injected with Huh7-IR-A spheroids developed tumors within 6 months (of note, one mouse from this group was not analyzed due to premature death from lymphoma) while no tumors developed from Huh7-pRC and Huh7-IR-B spheroids.
Analysis of xenografted tumors showed that the number of CK19-positive cells detected by IHC was significantly increased in Huh7-IR-A tumors (Figure 5c). The expression of PROM1 and CD44 was also increased in Huh7-IR-A tumors as assessed by RT-qPCR (Figure 5d). Consistent with GSEA data
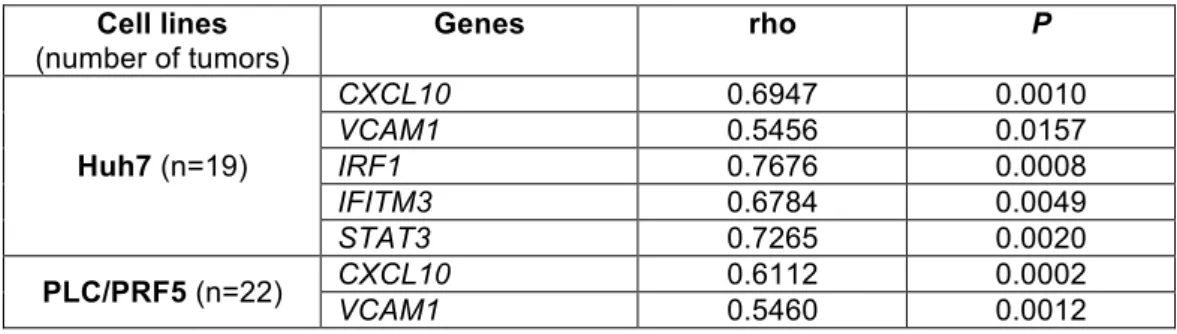
obtained from gene expression profiles of Huh7-IR-A and Huh7-pRC spheres, several inflammation-related signatures were found to be robustly enriched in Huh7-IR-A tumors compared to Huh7-pRC tumors (Supplementary Figure S5). These data were validated by performing RT-qPCR on a panel of genes from inflammatory signatures (CXCL10, VCAM1, IRF1, IFITM3, STAT3) in tumors with similar volumes (859 ± 128 mm3, 955 ± 98 mm3 and 622 ± 129 mm3 for Huh7-pRC, Huh7-IR-A and Huh7-IR-B tumors, respectively) (Figure 5e). There was also a strong correlation between the expression levels of these genes and IR-A among tumors from all three groups (Supplementary Table S5). These data led us to look for an association between CXCL10 expression and INSRA:INSRB ratio in our collection of 85 human HCC. The mean value for CXCL10 fold-change (T/NT) was higher in HCC with a high
INSRA:INSRB ratio (10.7±5.3 vs 6.3±2.0-fold) but this did not reach significance.
3.5 IR-A overexpression increases aggressive features in HCC cells devoid of strong IGF-II autocrine loop
Human data showed that the upregulation of INSRA:INSRB ratio may exist in the absence of IGF2 upregulation in HCC (Figure 1d). Therefore, we examined whether IR-A overexpression could promote aggressive features in a HCC cell line devoid of strong IGF-II autocrine loop such as PLC/PRF5 cells (Supplementary S1). As shown in Figure 6a, PLC/PRF5 cells overexpressing IR-A (PLC-IR-A) did not exhibit basal phosphorylation of IR-GFP and AKT but were responsive to exogenous insulin and IGF-II. PLC-IR-A cells had a higher invasion capacity than PLC-pRC and PLC-IR-B cells in vitro (Figure 6b). In our hands, PLC/PRF5 cell lines showed grape-like morphology in non-adherent conditions which prevented an accurate quantification of spheroid numbers (Figure 6c). None of the PLC cell lines expressed significant levels of CK19 and CD44 (data not shown). Nevertheless, PLC-IR-A spheres expressed increased PROM1 and AFP mRNA levels compared to PLC-pRC and PLC-IR-B cells (Figure
6d). After injection of 2 x 10⁶ cells to nude mice, the delay for tumor appearance was similar between PLC/PFR5 cells overexpressing IR-A or IR-B (Figure 6e and Supplementary Table S4). However, the growth of PLC-IR-B tumors was significantly slower than that of PLC-IR-A tumors (Figures 6e,f and
Supplementary Table S4). The induction of pro-inflammatory genes was observed in PLC-IR-A tumors
while these genes were downregulated in PLC-IR-B tumors compared to controls (Figure 6g). There was a strong correlation between IR-A and inflammatory gene mRNA levels in PLC/PRF5-derived tumors (Supplementary Table S5). Altogether, the data obtained with PLC/PRF5-derived cell lines
corroborated those obtained with Huh7-derived cell lines and suggest that a strong IGF-II autocrine loop is not mandatory for the mediation of IR-A pro-tumorigenic effects.
4. Discussion
We report that INSRA:INSRB ratio was significantly more elevated in human HCC expressing stem/progenitor cell features such as CK19 and AFP and was associated with shorter patient survival after curative resection. The dysregulation of INSRA:INSRB ratio was more frequent than the upregulation of IGF2 expression and was inversely correlated with the loss of GRB14 indicating that the IR signaling pathway is deregulated at different levels in HCC.
To decipher the role of IR-A in HCC progression, we engineered new HCC cell lines with ectopic overexpression of IR-A or IR-B and performed a comprehensive in vitro and in vivo analysis. We choose this strategy because previous studies showed that the selective downregulation of INSRA mRNA with siRNA was impossible to achieve in cancer cells [13, 31, 32]. Recently, we have developed a Crispr/Cas9 strategy to eliminate exon 11 in INSR gene to selectively express INSRA mRNA. Our preliminary results obtained in PLC/PRF5 cells support the present findings by showing that the reinforcement of IR-A expression to the detriment of IR-B confers higher aggressiveness to HCC cells (data not shown).
The presence of CSC markers in HCC has been postulated to be important in tumor initiation and progression, to be associated with high metastatic potential and chemotherapy resistance and to be predictive of poor outcome in patients [33]. We observed that the overexpression of IR-A up-regulated the expression of stemness-related genes in spheroids and xenografts. These findings suggest that IR-A acts on cell plasticity, promoting the retrodifferentiation of HCC cells into more immature hepatoblasts. The ability of cells derived from Huh7-IR-A but not from Huh7-pRC and Huh7-IR-B spheres to form tumors over 6 months in SCID mice also strengthens the hypothesis that this peculiar cellular contingent plays a prominent role in the tumorigenic process induced by IR-A. While EMT has been related to the promotion of cell motility and the acquisition of stem cell features, we did not find in vitro evidence for EMT induction upon enforced IR-A expression. However, GSEA showed a significant enrichment in an EMT signature in Huh7-IR-A-derived tumors (Supplementary Figure S5).
Inflammation has been reported to promote the expansion of CSC contingent in HCC. For example, NF-kB is activated in aggressive HCCs and is associated with stemness features [29] [34]. In the same way, tumor-associated macrophages produce interleukin-6 and signal via STAT3 to promote expansion of human HCC stem cells [35]. Therefore, the inflammatory gene program induced by sustained overexpression of IR-A in sphere-forming cells could favor the engagement of CSC in vivo.
Among the most stimulated inflammation-related genes, CXCL10 codes for a chemokine involved in the recruitment of immune cells and associated with HCC recurrence and poor survival [36]. CXCL10 and its receptor CXCR3were reported to promote migration and invasion in HCC cell lines [37, 38]. In our collection of HCC, CXCL10 expression was higher in tumors with high INSRA:INSRB ratio but this was not significant. Further studies are required to better understand the role of inflammation pathways in IR-A mediated tumor progression.
Another important finding is that IR-A overexpression is able to drive oncogenic mechanisms in the presence or absence of a strong IGF-II autocrine loop. Endogenous IGF-II (Huh7 model) plays a contributory role in the promotion of IR-A-mediated cell aggressiveness since si-IGF2 inhibited IR-A induction of AKT signaling and invasion. In addition, IR-A overexpression had more pronounced effects on tumor onset and growth when overexpressed in Huh7 cells rather than in PLC/PRF5 cells in the xenograft model, suggesting that autocrine secretion of IGF-II boosted tumor growth. In the absence of IGF-II autocrine loop (PLC/PRF5 model), overexpressed IR-A might be activated by exogenous ligands provided by culture medium. In vivo, circulating IGF-II and/or insulin produced by the recipient animals may be efficient to stimulate IR-A-dependent signaling pathways in injected PLC-IR-A cells, thus circumventing the need for the cells to produce IGF-II.
IR-A has often been described as a mitogenic isoform in response to IGF-II binding, particularly in IGF1R-deficient cells [39]. While rather metabolic functions have been ascribed to IR-B in response to insulin, there is growing evidence that IR-B may also signal proliferation in response to insulin [7] [31] [40]. Here, we did not observe any influence of IR isoform overexpression on the in vitro proliferative ability of Huh7 and PLC/PRF5 cell lines. This may result from the fact that these cell lines expressed significant levels of IGF1R and were cultured in 10% fetal calf serum thus promoting the activation of concomitant and redundant proliferative pathways. In marked contrast, the proliferation of Huh7-IR-A and PLC-IR-A cells was enhanced after injection to nude mice suggesting that these cells have a better propensity to promote a permissive microenvironment for their proliferation in vivo. In this setting, inflammation could favor close communication between tumor cells and microenvironment contributing to tumor growth and aggressiveness.
In conclusion, our experimental data identify IR-A as a novel player of HCC progression, acting notably through the promotion of stem/progenitor cell features. These findings provide a molecular link to account for the association between high INSRA:INSRB ratio and CSC markers (such as CK19 and
AFP) in human HCC. Moreover, the presence of an IGF-II autocrine loop is not a prerequisite for mediating the pro-tumorigenic function of IR-A. IR has been largely ignored as a possible target for years due to subsequent expectation of high toxicity. Accumulative evidence for the involvement of IR-A in the progression of different cancers including HCC should warrant further research to develop specific IR-A targeting strategies. In addition, the present results as well as our recent data showing a close correlation between the expression levels of INSRA mRNA in HCC tumors and the circulating levels of IR-A [8] suggest that soluble IR-A could be considered as a progression biomarker in HCC.
5. Acknowledgements
We are deeply indebted to Corina Buta for expert technical assistance. We thank Dr Franck Peiretti (INSERM UMR_1062, Marseille) who provided us with IR expression plasmids, Annie Munnier (CISA, UMS_30 LUMIC, Paris) and Dr Romain Morrichon (imaging platform, CISA, INSERM UMR_S938) for their help in cytometry and microscopy analyses, respectively. We thank Sébastien Jacques, Angéline Duché and Franck Letourneur from the platform GENOM’IC (Cochin Institute, INSERM U1016, Paris) for microarray experiments, Tatiana Ledent and the staff of the animal facility of the Saint-Antoine Research Center (INSERM UMR_S938), and the histomorphology platform (UMS_30 LUMIC, Paris). We thank Dr Angélique Gougelet for critical reading of the manuscript. We acknowledge the biobank CRB HUEP from AP-HP for access to human HCC samples.
6. Fundings: E. Benabou has been a fellow from Ligue Contre le Cancer (GB/MA/CD-11287). This
work has been supported by grants from INSERM, GEFLUC, Ligue Contre le Cancer (Comité de Paris, RS17/75-93), Cancéropôle Ile de France and INCa (INCa-DGOS_5790).
7. References
[1] G.B.D. Mortality, C. Causes of Death, Global, regional, and national age-sex specific all-cause and cause-specific mortality for 240 causes of death, 1990-2013: a systematic analysis for the Global Burden of Disease Study 2013, Lancet, 385 (2015) 117-171.
[2] J.M. Llovet, J. Zucman-Rossi, E. Pikarsky, B. Sangro, M. Schwartz, M. Sherman, G. Gores, Hepatocellular carcinoma, Nat Rev Dis Primers, 2 (2016) 16018.
[3] Z.M. Younossi, A.B. Koenig, D. Abdelatif, Y. Fazel, L. Henry, M. Wymer, Global epidemiology of nonalcoholic fatty liver disease-Meta-analytic assessment of prevalence, incidence, and outcomes, Hepatology, 64 (2016) 73-84.
[4] F. Frasca, G. Pandini, P. Scalia, L. Sciacca, R. Mineo, A. Costantino, I.D. Goldfine, A. Belfiore, R. Vigneri, Insulin receptor isoform A, a newly recognized, high-affinity insulin-like growth factor II receptor in fetal and cancer cells, Mol Cell Biol, 19 (1999) 3278-3288.
[5] A. Belfiore, R. Malaguarnera, V. Vella, M.C. Lawrence, L. Sciacca, F. Frasca, A. Morrione, R. Vigneri, Insulin Receptor Isoforms in Physiology and Disease: An Updated View, Endocr Rev, 38 (2017) 379-431.
[6] H. Chettouh, L. Fartoux, L. Aoudjehane, D. Wendum, A. Claperon, Y. Chretien, C. Rey, O. Scatton, O. Soubrane, F. Conti, F. Praz, C. Housset, O. Rosmorduc, C. Desbois-Mouthon, Mitogenic insulin receptor-A is overexpressed in human hepatocellular carcinoma due to EGFR-mediated dysregulation of RNA splicing factors, Cancer Res, 73 (2013) 3974-3986.
[7] L. Morzyglod, M. Cauzac, L. Popineau, P.D. Denechaud, L. Fajas, B. Ragazzon, V. Fauveau, J. Planchais, M. Vasseur-Cognet, L. Fartoux, O. Scatton, O. Rosmorduc, S. Guilmeau, C. Postic, C. Desdouets, C. Desbois-Mouthon, A.F. Burnol, Growth factor receptor binding protein 14 inhibition triggers insulin-induced mouse hepatocyte proliferation and is associated with hepatocellular carcinoma, Hepatology, 65 (2017) 1352-1368.
[8] P.J. Meakin, S.M. Jalicy, G. Montagut, D.J.P. Allsop, D.L. Cavellini, S.W. Irvine, C. McGinley, M.K. Liddell, A.D. McNeilly, K. Parmionova, Y.R. Liu, C.L.S. Bailey, J.K. Dale, L.K. Heisler, R.J. McCrimmon, M.L.J. Ashford, Bace1-dependent amyloid processing regulates hypothalamic leptin sensitivity in obese mice, Sci Rep, 8 (2018) 55.
[9] L. Sciacca, A. Costantino, G. Pandini, R. Mineo, F. Frasca, P. Scalia, P. Sbraccia, I.D. Goldfine, R. Vigneri, A. Belfiore, Insulin receptor activation by IGF-II in breast cancers: evidence for a new autocrine/paracrine mechanism, Oncogene, 18 (1999) 2471-2479.
[10] V. Vella, G. Pandini, L. Sciacca, R. Mineo, R. Vigneri, V. Pezzino, A. Belfiore, A novel autocrine loop involving IGF-II and the insulin receptor isoform-A stimulates growth of thyroid cancer, J Clin Endocrinol Metab, 87 (2002) 245-254.
[11] S. Avnet, L. Sciacca, M. Salerno, G. Gancitano, M.F. Cassarino, A. Longhi, M. Zakikhani, J.M. Carboni, M. Gottardis, A. Giunti, M. Pollak, R. Vigneri, N. Baldini, Insulin receptor isoform A and insulin-like growth factor II as additional treatment targets in human osteosarcoma, Cancer research, 69 (2009) 2443-2452.
[12] L. Sciacca, R. Mineo, G. Pandini, A. Murabito, R. Vigneri, A. Belfiore, In IGF-I receptor-deficient leiomyosarcoma cells autocrine IGF-II induces cell invasion and protection from apoptosis via the insulin receptor isoform A, Oncogene, 21 (2002) 8240-8250.
[13] I. Heidegger, J. Kern, P. Ofer, H. Klocker, P. Massoner, Oncogenic functions of IGF1R and INSR in prostate cancer include enhanced tumor growth, cell migration and angiogenesis, Oncotarget, 5 (2014) 2723-2735.
[14] H. Zhang, A.M. Pelzer, D.T. Kiang, D. Yee, Down-regulation of type I insulin-like growth factor receptor increases sensitivity of breast cancer cells to insulin, Cancer research, 67 (2007) 391-397. [15] D.B. Ulanet, D.L. Ludwig, C.R. Kahn, D. Hanahan, Insulin receptor functionally enhances multistage tumor progression and conveys intrinsic resistance to IGF-1R targeted therapy, Proceedings of the National Academy of Sciences of the United States of America, 107 (2010) 10791-10798.
[16] E. Buck, P.C. Gokhale, S. Koujak, E. Brown, A. Eyzaguirre, N. Tao, M. Rosenfeld-Franklin, L. Lerner, M.I. Chiu, R. Wild, D. Epstein, J.A. Pachter, M.R. Miglarese, Compensatory insulin receptor (IR) activation on inhibition of insulin-like growth factor-1 receptor (IGF-1R): rationale for cotargeting IGF-1R and IR in cancer, Mol Cancer Ther, 9 (2010) 2652-2664.
[17] C. Garofalo, M.C. Manara, G. Nicoletti, M.T. Marino, P.L. Lollini, A. Astolfi, G. Pandini, J.A. Lopez-Guerrero, K.L. Schaefer, A. Belfiore, P. Picci, K. Scotlandi, Efficacy of and resistance to anti-IGF-1R therapies in Ewing's sarcoma is dependent on insulin receptor signaling, Oncogene, 30 (2011) 2730-2740.
[18] D. Weinstein, R. Sarfstein, Z. Laron, H. Werner, Insulin receptor compensates for IGF1R inhibition and directly induces mitogenic activity in prostate cancer cells, Endocr Connect, 3 (2014) 24-35. [19] I. Martinez-Quetglas, R. Pinyol, D. Dauch, S. Torrecilla, V. Tovar, A. Moeini, C. Alsinet, A. Portela, L. Rodriguez-Carunchio, M. Sole, A. Lujambio, A. Villanueva, S. Thung, M. Esteller, L. Zender, J.M. Llovet, IGF2 Is Up-regulated by Epigenetic Mechanisms in Hepatocellular Carcinomas and Is an Actionable Oncogene Product in Experimental Models, Gastroenterology, 151 (2016) 1192-1205. [20] C. Goumard, C. Desbois-Mouthon, D. Wendum, C. Calmel, F. Merabtene, O. Scatton, F. Praz, Low Levels of Microsatellite Instability at Simple Repeated Sequences Commonly Occur in Human Hepatocellular Carcinoma, Cancer Genomics Proteomics, 14 (2017) 329-339.
[21] M.J. Blivet-Van Eggelpoel, H. Chettouh, L. Fartoux, L. Aoudjehane, V. Barbu, C. Rey, S. Priam, C. Housset, O. Rosmorduc, C. Desbois-Mouthon, Epidermal growth factor receptor and HER-3 restrict cell response to sorafenib in hepatocellular carcinoma cells, J Hepatol, 57 (2012) 108-115.
[22] B. Leibiger, I.B. Leibiger, T. Moede, S. Kemper, R.N. Kulkarni, C.R. Kahn, L.M. de Vargas, P.O. Berggren, Selective insulin signaling through A and B insulin receptors regulates transcription of insulin and glucokinase genes in pancreatic beta cells, Mol Cell, 7 (2001) 559-570.
[23] S. Uhles, T. Moede, B. Leibiger, P.O. Berggren, I.B. Leibiger, Isoform-specific insulin receptor signaling involves different plasma membrane domains, J Cell Biol, 163 (2003) 1327-1337.
[24] R.R. Ramos, A.J. Swanson, J. Bass, Calreticulin and Hsp90 stabilize the human insulin receptor and promote its mobility in the endoplasmic reticulum, Proc Natl Acad Sci U S A, 104 (2007) 10470-10475.
[25] I. Kara, M. Poggi, B. Bonardo, R. Govers, J.F. Landrier, S. Tian, I. Leibiger, R. Day, J.W. Creemers, F. Peiretti, The paired basic amino acid-cleaving enzyme 4 (PACE4) is involved in the maturation of insulin receptor isoform B: an opportunity to reduce the specific insulin receptor-dependent effects of insulin-like growth factor 2 (IGF2), J Biol Chem, 290 (2015) 2812-2821.
[26] A. Nagarajan, M.C. Petersen, A.R. Nasiri, G. Butrico, A. Fung, H.B. Ruan, R. Kursawe, S. Caprio, J. Thibodeau, M.C. Bourgeois-Daigneault, L. Sun, G. Gao, S. Bhanot, M.J. Jurczak, M.R. Green, G.I. Shulman, N. Wajapeyee, MARCH1 regulates insulin sensitivity by controlling cell surface insulin receptor levels, Nat Commun, 7 (2016) 12639.
[27] C. Buta, E. Benabou, M. Lequoy, H. Regnault, D. Wendum, F. Meratbene, H. Chettouh, L. Aoudjehane, F. Conti, Y. Chretien, O. Scatton, O. Rosmorduc, F. Praz, L. Fartoux, C. Desbois-Mouthon,
Heregulin-1b and HER3 in hepatocellular carcinoma: status and regulation by insulin, J Exp Clin Cancer Res, 35 (2016) 126.
[28] A. Subramanian, P. Tamayo, V.K. Mootha, S. Mukherjee, B.L. Ebert, M.A. Gillette, A. Paulovich, S.L. Pomeroy, T.R. Golub, E.S. Lander, J.P. Mesirov, Gene set enrichment analysis: a knowledge-based approach for interpreting genome-wide expression profiles, Proc Natl Acad Sci U S A, 102 (2005) 15545-15550.
[29] J.U. Marquardt, L. Gomez-Quiroz, L.O. Arreguin Camacho, F. Pinna, Y.H. Lee, M. Kitade, M.P. Dominguez, D. Castven, K. Breuhahn, E.A. Conner, P.R. Galle, J.B. Andersen, V.M. Factor, S.S. Thorgeirsson, Curcumin effectively inhibits oncogenic NF-kappaB signaling and restrains stemness features in liver cancer, J Hepatol, 63 (2015) 661-669.
[30] R. Portillo-Lara, M.M. Alvarez, Enrichment of the Cancer Stem Phenotype in Sphere Cultures of Prostate Cancer Cell Lines Occurs through Activation of Developmental Pathways Mediated by the Transcriptional Regulator DeltaNp63alpha, PLoS One, 10 (2015) e0130118.
[31] C.M. Perks, H.A. Zielinska, J. Wang, C. Jarrett, A. Frankow, M.R. Ladomery, A. Bahl, A. Rhodes, J. Oxley, J.M. Holly, Insulin Receptor Isoform Variations in Prostate Cancer Cells, Front Endocrinol (Lausanne), 7 (2016) 132.
[32] C. Berlato, W. Doppler, Selective response to insulin versus insulin-like growth factor-I and -II and up-regulation of insulin receptor splice variant B in the differentiated mouse mammary epithelium, Endocrinology, 150 (2009) 2924-2933.
[33] D. Sia, A. Villanueva, S.L. Friedman, J.M. Llovet, Liver Cancer Cell of Origin, Molecular Class, and Effects on Patient Prognosis, Gastroenterology, 152 (2017) 745-761.
[34] H. Dubois-Pot-Schneider, K. Fekir, C. Coulouarn, D. Glaise, C. Aninat, K. Jarnouen, R. Le Guevel, T. Kubo, S. Ishida, F. Morel, A. Corlu, Inflammatory cytokines promote the retrodifferentiation of tumor-derived hepatocyte-like cells to progenitor cells, Hepatology, 60 (2014) 2077-2090.
[35] S. Wan, E. Zhao, I. Kryczek, L. Vatan, A. Sadovskaya, G. Ludema, D.M. Simeone, W. Zou, T.H. Welling, Tumor-associated macrophages produce interleukin 6 and signal via STAT3 to promote expansion of human hepatocellular carcinoma stem cells, Gastroenterology, 147 (2014) 1393-1404. [36] C.X. Li, C.C. Ling, Y. Shao, A. Xu, X.C. Li, K.T. Ng, X.B. Liu, Y.Y. Ma, X. Qi, H. Liu, J. Liu, O.W. Yeung, X.X. Yang, Q.S. Liu, Y.F. Lam, Y. Zhai, C.M. Lo, K. Man, CXCL10/CXCR3 signaling mobilized-regulatory T cells promote liver tumor recurrence after transplantation, J Hepatol, 65 (2016) 944-952.
[37] Y. Qin, S.Q. Xu, D.B. Pan, G.X. Ye, C.J. Wu, S. Wang, C.J. Wang, J.Y. Jiang, J. Fu, Silencing of WWP2 inhibits adhesion, invasion, and migration in liver cancer cells, Tumour Biol, 37 (2016) 6787-6799.
[38] T. Ren, L. Zhu, M. Cheng, CXCL10 accelerates EMT and metastasis by MMP-2 in hepatocellular carcinoma, Am J Transl Res, 9 (2017) 2824-2837.
[39] A. Belfiore, F. Frasca, G. Pandini, L. Sciacca, R. Vigneri, Insulin receptor isoforms and insulin receptor/insulin-like growth factor receptor hybrids in physiology and disease, Endocr Rev, 30 (2009) 586-623.
[40] G. Pandini, F. Frasca, R. Mineo, L. Sciacca, R. Vigneri, A. Belfiore, Insulin/insulin-like growth factor I hybrid receptors have different biological characteristics depending on the insulin receptor isoform involved, The Journal of biological chemistry, 277 (2002) 39684-39695.
8. Tables
Table 1: Relations between IR-A:IR-B fold inductions (T/NT) and the pathological characteristics of 85 HCC
AFP: a-fetoprotein; CK19: cytokeratin 19; HCV: hepatitis C virus; HBV, hepatitis B virus; MS, metabolic syndrome; NASH, nonalcoholic steatohepatitis
a Values are expressed as median [range] b four missing data
c three missing data
All statistical analyses were performed using a Mann-Whitney test.
n induction (T/NT)IR-A:IR-B fold a P values
HBV yes no 27 58 2.38 [1.09 – 18.47] 2.71 [0.07 – 39.30] 0.639 HCV yes no 21 64 3.25 [0.35 – 39.30] 2.54 [0.07 – 19.75] 0.409 NASH yes no 11 74 2.54 [0.07 – 39.30] 2.68 [0.95– 12.76] 0.773 MS + alcohol yes no 77 8 2.65 [0.07 – 39.30] 1.83 [0.90 – 5.16] 0.166 Alcohol yes no 5 80 3.00 [1.74 – 3.14] 2.54 [0.07 – 39.30] 0.971 Advanced fibrosis/cirrhosis yes no 50 35 2.22 [0.70 – 39.30] 3.18 [0.07 – 19.75] 0.138 AFPb < 400 ng/mL ≥ 400 ng/mL 47 34 2.11 [0.07 – 39.30] 3.93 [0.74 – 19.17] 0.002 Tumor size < 5 cm ≥ 5cm 44 41 2.20 [0.07 – 39.30] 3.05 [0.35 – 19.75] 0.105 Multiplicity yes no 18 67 2.77 [0.07 – 19.17] 2.54 [0.35 – 39.30] 0.817 Satellite nodules yes no 26 59 3.00 [1.09 – 19.75] 2.52 [0.35 – 39.30] 0.366 Differentiation well/moderate poor 61 24 2.14 [0.07 – 19.75] 5.35 [0.74 – 39.30] < 0.0001 CK19 expressionc < 5% ≥ 5% 65 17 2.22 [0.07 – 19.75] 5.54 [0.35 – 39.30] 0.002 Microvascular invasion yes no 41 44 3.05 [0.07 – 19.75] 2.13 [0.37– 39.30] 0.023
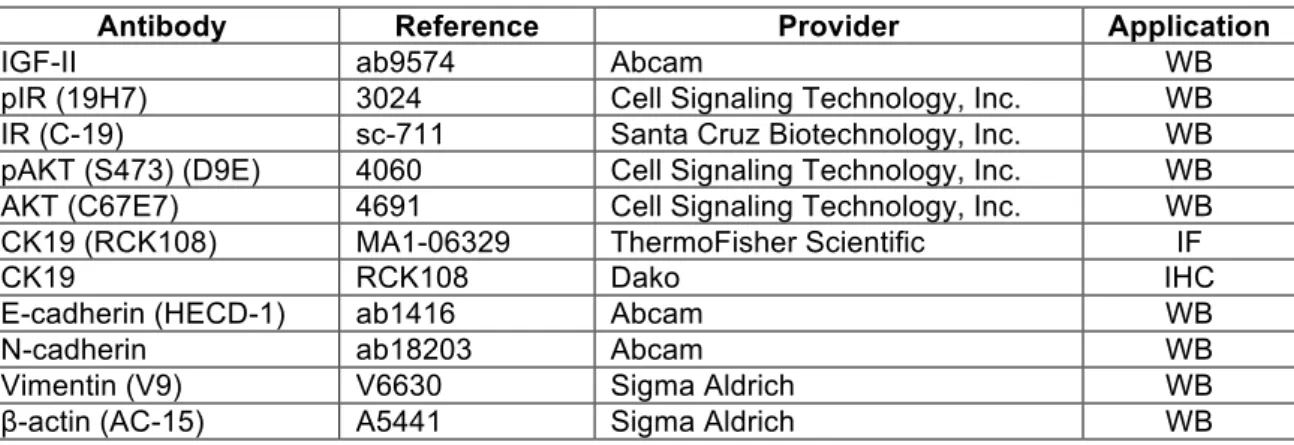
Table S1: Antibodies for Western blot, immunohistochemistry and immunofluorescence
Antibody Reference Provider Application
IGF-II ab9574 Abcam WB
pIR (19H7) 3024 Cell Signaling Technology, Inc. WB
IR (C-19) sc-711 Santa Cruz Biotechnology, Inc. WB
pAKT (S473) (D9E) 4060 Cell Signaling Technology, Inc. WB AKT (C67E7) 4691 Cell Signaling Technology, Inc. WB
CK19 (RCK108) MA1-06329 ThermoFisher Scientific IF
CK19 RCK108 Dako IHC
E-cadherin (HECD-1) ab1416 Abcam WB
N-cadherin ab18203 Abcam WB
Vimentin (V9) V6630 Sigma Aldrich WB
β-actin (AC-15) A5441 Sigma Aldrich WB
Table S2: Primers used for qPCR
Target Forward primer Reverse primer
IR-A GTTTTCGTCCCCAGGCCAT CCACCGTCACATTCCCAAC
IR-B TTTCGTCCCCAGAAAAACCTCT CCACCGTCACATTCCCAAC
IRtot GCTGGATTATTGCCTCAAAGG TGAGAATCTTCAGACTCGAATGG
IGF2 CGTCGCAGCCGTGGCATCGTTGA GCCCACGGGGTATCTGGGGAAG
GRB14 CGGTCCCAGCCATGGTTTCAC GTTACTCTGACTATCCCGTACC
CXCL10 GAAAGCAGTTAGCAAGGAAAGG GACATATACTCCATGTAGGGAAGTGA
VCAM1 ACATGGAATTCGAACCCAAA TGTATCTCTGGGGGCAACAT
IRF1 GGCACATCCCAGTGGAAG CCCTTCCTCATCCTCATCTGT
IFITM3 TCAAGGAGGAGCACGAGGT GATGTGGATCACGGTGGAC
ITGA5 CCCATTGAATTTGACAGCAA TGCAAGGACTTGTACTCCACA
ITGB3 CATCCACGACCGAAAAGAA TGAAGGTAGACGTGGCCTCT
STAT3 TGAGACTTGGGCTTACCATTGGGT TCTTTAATGGGCCACAACAGGGCT
KRT19 ACCAAGTTTGAGACGGAACAG CCCTCAGCGTACTGATTTCCT
PROM1 TTTCAAGGACTTGCGAACTCTCTT GAACAGGGATGATGTTGGGTCTCA
CD44 TGCAGTCAACAGTCGAAGAAG CTGTCCTCCACAGCTCCATT
EPCAM CCATGTGCTGGTGTGTGAA TGTGTTTTAGTTCAATGATGATCCA
CDH1 AAGAAGCTGGCTGACATGTACGGA CCACCAGCAACGTGATTTCTGCAT
CDH2 CTCCATGTGCCGGATAGC CGATTTCACCAGAAGCCTCTAC
VIM TACAAATCCAAGTTTGCTGACCTCTC
TGA GCGTTCCAGGGACTCATTGGTT
ZEB1 ACCTGCCAACAGACCAGACAGTGT GCCCTTCCTTTCTGTCATCCTCCCA
SNAI1 CCTAACTACAGCGAGCTGCAG ATCTCCGGAGGTGGGATG
SNAI2 ACACATTAGAACTCACACGG GAGAGACATTCTGGAGAAGG
ACTA2 GACAATGGCTCTGGGCTCTGTAA CTGTGCTTCGTCACCCACGTA
Table S3: Relations between fold inductions (T/NT) for IGF2 mRNA and the pathological characteristics of 85 HCC IGF2 upregulation No (n = 77) Yes (n = 8) P values AFPa < 400 ng/mL ≥ 400 ng/mL 46 27 1 7 0.008 Tumor size < 5 cm ≥ 5cm 41 36 3 5 0.474 Multiplicity yes no 16 61 2 6 1.000 Tumor differentiation well / moderate poor 57 20 4 4 0.214 CK19 expression b < 5% ≥ 5% 64 10 1 7 < 0.0001 Microvascular invasion yes no 37 40 4 4 1.0000
AFP: a-fetoprotein; CK19: cytokeratin 19 a four missing data
b three missing data
Table S4. Effects of IR-A and IR-B overexpression on HCC cell tumorigenicity in vivo
Cell lines Incidence (%)
Appearance (mean ± SEM,
days)
p (mean ± SEM, mmGrowth rate 3/day) p
Huh7-pRC 97 32.2 ± 1.29 30.29 ± 2.13 Huh7-IR-A 100 19.1 ± 1.04 < 0.0001 47.25 ± 2.81 0.0086 Huh7-IR-B 86 34.3 ± 2.44 ns 32.98 ± 1.78 ns PLC-pRC 100 18.00 ± 0.90 11.48 ± 0.42 PLC-IR-A 100 12.88 ± 0.83 < 0.01 15.55 ± 0.20 < 0.05 PLC-IR-B 100 14.38 ± 1.83 < 0.01 8.45 ± 0.23 < 0.05
Data are from 7-9 (Huh7) or 6-8 (PLC/PRF5) mice per group. ns, non-significant. Tumor growth rate was determined by calculating the slope of tumor growth curve using a linear regression
Table S5: Correlations between IR-A and inflammatory factor mRNA levels in Huh7- and PLC/PRF5-derived tumors
Cell lines (number of tumors) Genes rho P Huh7 (n=19) CXCL10 0.6947 0.0010 VCAM1 0.5456 0.0157 IRF1 0.7676 0.0008 IFITM3 0.6784 0.0049 STAT3 0.7265 0.0020 PLC/PRF5 (n=22) CXCL10 0.6112 0.0002 VCAM1 0.5460 0.0012 Spearman rho correlation coefficient and p values (two-tailed) are presented.
9. Legends to figures
Figure 1. Status of IR-A signaling in human HCC
a. The fold changes of INSRA:INSRB ratio were assigned into two subgroups according to IHC
detection of CK19 (<5% (CK19-) or >5% (CK19+) of cells). b. Kaplan-Meier analysis comparing overall survival of 85 patients with HCC according to the median value of the INSRA:INSRB ratio. c. Expression of IGF2 mRNA was measured by RT-qPCR. Each dot represents the fold change in HCC
versus paired nontumor tissue (n=85). d. The fold changes of INSRA:INSRB ratio were assigned into
two subgroups according to the level of expression of IGF2 mRNA. e. Correlation between GRB14 mRNA and INSRA:INSRB ratio levels in 85 HCC. Black lines are the medians. ns, not significant.
Figure 2. Characterization of Huh7 cell lines overexpressing IR-A or IR-B
a. INSRA and INSRB mRNA expression was measured by RT-qPCR in Huh7 cells stably expressing
the empty plasmid (Huh7-pRC, n=4), IR-A-GFP cDNA A, n=4), or IR-B-GFP cDNA (Huh7-IR-B, n=4). Fold change is normalized to control Huh7-pRC cells. b. Western blot analysis of stably
transfected Huh7 pools stimulated with or without insulin or IGF-II. b-actin was used as a loading control. Ectopic receptors fused to GFP (IR-GFP) have an apparent molecular weight of 125 kDa. c. Blot quantifications showing the ratio of total ectopic IR to b-actin level (n=3). d. Blot quantifications showing the ratio of phosphorylated to total ectopic IR (left panel) and AKT (right panel) level (n=3). e. Blot quantifications showing the effect of insulin (10-8 M, 10 min) on ectopic IR activation (ratio of phosphorylated to total) (n=3). f. Huh7-IR-A cells were treated with siRNA against IGF2 (si-IGF2) or with control siRNA (si-CONT) and expression of IGF2 was measured by RT-qPCR (n=2) (left panel) and Western blot (middle panel). The impact of IGF2 downregulation was examined by Western blot analysis on IR and AKT phosphorylation (n=2) (right panel). g. RTK profiler array showing IR tyrosine phosphorylation in Huh7-pRC and Huh7-IR-A cells cultured in serum-deprived medium for 24 h. Corner boxes delineate control spots. Representative blots of two or three independent experiments are shown. Values are mean ± SEM. *p<0.05, **p<0.01, ***p<0.001.
Figure 3. Effects of IR-A overexpression on migration and invasion of Huh7 cells in vitro
a. Cell number was evaluated 48 h, 72 h and 96 h after plating (n=4). b. Cell migration was measured
DAPI are shown on the right. c. Cell invasion was measured 30 h after plating using Transwell® inserts coated with Matrigel® (n=7). Representative pictures of invaded cells stained with DAPI are shown on the right. d. Microscopic examination of cell morphology. Arrows indicate individually scattered cells. e. Expression of ACTA2, CDH1, CDH2, VIM, ZEB1, and SNAI1 mRNA was measured by RT-qPCR in Huh7-pRC (n=5), Huh7-IR-A (n=5) and Huh7-IR-B (n=4) cells. f. Western blot analysis of stably transfected Huh7 pools for EMT markers. b-actin was used as a loading control (representative pictures; n=3). Values are mean ± SEM. *p<0.05.
Figure 4. Effects of IR-A overexpression on CSC contingent in Huh7cells in vitro
Huh7-pRC, Huh7-IR-A and Huh7-IR-B cells were cultured in non-adherent conditions during 14 days and the number of hepatospheres (>100 µm) was evaluated (n=4). b. Representative pictures showing morphology of spheroids. c. Expression of INSRA and INSRB mRNA in Huh7-pRC cells cultured in adherent or non-adherent (spheres) conditions (n=4). d. Comparative expression of INSRA and INSRB mRNA in spheres (n=4). e. GSEA revealed an enrichment of progenitor signatures in Huh7-IR-A spheres such as CONRAD_STEM_CELL. f. Expression of KRT19, PROM1, CD44 and EPCAM mRNA was measured by RT-qPCR in spheres (n=4). g. CK19 protein was detected by IF in hepatospheres. *p<0.05, **p<0.01, ***p<0.001, ****p<0.0001.
Figure 5. Effects of IR-A overexpression on tumorigenicity of Huh7 cells in vivo
a. Tumor growth in nude mice subcutaneously injected with Huh7 cells stably expressing the empty
plasmid (Huh7-pRC, n=10), IR-A-GFP cDNA (Huh7-IR-A, n=9), or IR-B-GFP cDNA (Huh7-IR-B, n=5).
Inset: Representative pictures of tumors 32 days after injection. b. 1 x 10³ cells dissociated from Huh7-pRC, Huh7-IR-A and Huh7-IR-B hepatospheres were injected subcutaneously to NOD/SCID mice (n=4 per group) and tumor development was followed over 6 months. A representative mouse having developed a tumor after injection of Huh7-IR-A hepatospheres is shown on the right. c. CK19 protein was detected by IHC in Huh7-pRC (n=4) and Huh7-IR-A (n=4) tumors. d. Expression of PROM1 and
CD44 mRNA was measured by RT-qPCR in Huh7-pRC (n=5), Huh7-IR-A (n=5) and Huh7-IR-B (n=4)
tumors. e. Expression of CXCL10, VCAM1, IRF1, IFITM3, and STAT3 mRNA was measured by RT-qPCR in Huh7-pRC (n=5), Huh7-IR-A (n=5) and Huh7-IR-B (n=4) tumors. *p<0.05, **p<0.01, ***p<0.001, ****p<0.0001. ns, not significant.
Figure 6. Effects of IR-A overexpression on PLC/PRF5 cells properties
a. Western blot analysis of stably transfected PLC/PRF5 pools stimulated with or without insulin or
IGF-II. Ectopic receptors fused to GFP (IR-GFP) have an apparent molecular weight of 125 kDa. b. Cell invasion was measured 30 h after plating using Transwell® inserts coated with Matrigel® (n=7). c. Representative pictures showing morphology of spheroids. d. Expression of PROM1 and AFP mRNA was measured by RT-qPCR (n=4). e. Tumor growth in nude mice sc injected with PLC/PRF5 cells stably expressing the empty plasmid (PLC-pRC, n=10), IR-A-GFP cDNA (PLC-IR-A, n=9), or IR-B-GFP cDNA (PLC-IR-B, n=5). Inset: Representative pictures of tumors 32 days after injection. f. Tumor weight at sacrifice (n=10, n=9, and n=5 for PLC-pRC, PLC-IR-A, and PLC-IR-B derived tumors, respectively). g. Expression of CXCL10 and VCAM1 mRNA was measured by RT-qPCR in PLC-pRC (n=5), PLC-IR-A (n=5) and PLC-IR-B (n=4) tumors. *p<0.05, **p<0.01, ***p<0.001, ****p<0.0001.