HAL Id: hal-00304989
https://hal.archives-ouvertes.fr/hal-00304989
Submitted on 1 Jan 2004HAL is a multi-disciplinary open access archive for the deposit and dissemination of sci-entific research documents, whether they are pub-lished or not. The documents may come from teaching and research institutions in France or abroad, or from public or private research centers.
L’archive ouverte pluridisciplinaire HAL, est destinée au dépôt et à la diffusion de documents scientifiques de niveau recherche, publiés ou non, émanant des établissements d’enseignement et de recherche français ou étrangers, des laboratoires publics ou privés.
dynamics in Lake Vänern, Sweden
M. Dahl, B. C. Pers
To cite this version:
M. Dahl, B. C. Pers. Comparison of four models simulating phosphorus dynamics in Lake Vänern, Sweden. Hydrology and Earth System Sciences Discussions, European Geosciences Union, 2004, 8 (6), pp.1153-1163. �hal-00304989�
Comparison of four models simulating phosphorus dynamics in
Lake Vänern, Sweden
Magnus Dahl
1and B. Charlotta Pers
21Department of Chemical Engineering, Karlstad University, SE651 88 Karlstad, Sweden 2Swedish Meteorological and Hydrological Institute, SE601 76 Norrköping, Sweden
Email for corresponding author: [email protected]
Abstract
This paper compares four water quality models applied to Lake Vänern, Sweden. The comparison is focused on phosphorus, the primary limiting nutrient in Lake Vänern. Two of the models, FYRISÅ and HBVNP, are simple and were developed as parts of catchment models. Two other models, called LEEDS and BIOLA, are more comprehensive lake models. The models were calibrated using data from the period 19851992 and validated using data from the period 19932000. The fit to calibration data is similar for the FYRISÅ, HBVNP, and LEEDS models, and slightly worse for the BIOLA model. All models fit the validation data almost as well as the calibration data. The models behaviour was tested in two representative scenarios. An increase of emissions by 40% from a pulp and paper mill has a negligible effect on the water quality, while a decrease in phosphorus load by 14% (accomplished by better waste-water treatment in rural households) gives a considerable decrease in phosphorus concentration in the lake. Still, the results of the scenarios vary between the models.
Keywords: lake, phosphorus, model, scenarios, simulation
Introduction
Eutrophication is a problem of immediate interest in many water bodies, not the least in lakes (e.g. Reynolds, 1999). Excess of nutrient load causes larger production of planktonic algae (sometimes poisonous) and excessive growth of macroalgae. The high production may lead to oxygen deficiency and fish kills in the hypolimnion of stratified lakes due to an increased amount of dead algae that is degraded. According to the EC Water Framework Directive (WFD; Dir. 2000/60/EC) management plans will be established for all European catchments, to improve or maintain a good water quality in water bodies. Scenario simulation with lake models can be useful in lake management, providing the basis for informed decisions. Lake water quality models appeared in the late 1960s, and their development since have been reviewed in a number of publications, such as Orlob (1983) and Jørgensen (1994).
Among the first to be developed were practical management models of the empirical Vollenveider type. The OECD model (described in e.g. Håkanson, 1995) is one that
became widely used. It predicts the total phosphorus of a lake based on lake water retention time and nutrient load. Another type of model with a long history is the dynamic ecological model based on general patterns of production of biomass and interaction between organisms. Renewed interest (Jorgensen, 1995) has been shown in the development of process-based models, especially those that are capable of responding to a changed environment. Existing biogeochemical process models vary in complexity. They can be based on a stirred tank reactor model (e.g. Janse and Aldenberg, 1990), or a onedimensional (e.g. Scavia, 1980) or severaldimensional hydrodynamic model (CEQUALW2, http://www.cee.pdx.edu/w2/). Between these extremes, a range of models with different complexity can be found.
In this paper four models of Lake Vänern, Sweden, are compared with respect to management of eutrophication problems. Phosphorus is the substance in focus, since it is the primary limiting nutrient in Lake Vänern. The studied models are FYRISÅ, HBVNP, LEEDS and BIOLA. They
are compared regarding structure, calibration, validation and application to scenarios simulating changes in nutrient load.
Materials and Methods
STUDY SITE LAKE VÄNERN
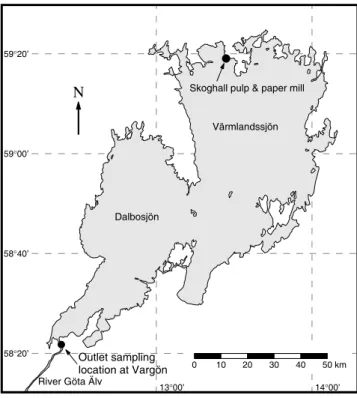
Lake Vänern is the largest lake in Sweden, and the third largest in Europe, with a surface area of 5600 km2 and a
volume of 153 km3 (Fig. 1). The dimictic and oligotrophic
lake has a maximum depth of 106 m and a hydraulic residence time of nine years. The lake has two distinct subbasins, Värmlandssjön and Dalbosjön (Fig. 1), where 75% of the inflow arrives in Värmlandssjön. The subbasins are separated by an archipelago, across which there is an irregular and winddependent water exchange. Although Lake Vänern as a whole can be considered an oligotrophic lake, some of the archipelagic nearshore areas have had mesotrophic or even eutrophic status (Welch and Lindell, 1978). Emissions of nutrients and oxygen-consuming substances from cities and from the pulp and paper industry caused environmental concern during the 1960s and 1970s. The emissions of phosphorus and oxygen-consuming substances have decreased markedly since waste-water treatment was installed during the 1970s (Wilander and Persson, 2001) but the nitrogen concentration is still high
in the lake. A large part of the nutrient load originates from diffuse sources (Brandt and Ejhed, 2002), which are not affected by the nutrient reduction measures taken.
The water quality is similar in the two basins. A statistical investigation by Dahl and Wilson (2004) found a small but statistically significant difference in total phosphorus between the basins (0.5 ± 0.2 µg l1, 95 % confidence
interval), but no statistically significant difference in dissolved phosphorus. The investigation also showed that the two basins Värmlandssjön and Dalbosjön are internally well mixed, except for some small enclosed nearshore bays where the water quality differs from that in the main lake.
MODEL DESCRIPTIONS
Four models are compared in this study. The FYRISÅ model and the HBVNP lake module are components of catchment models and are fairly simple, with few state variables. The
Fig. 1. Map of Lake Vänern showing the main subbasins,
Värmlandssjön and Dalbosjön, and the location of the Skoghall pulp and paper mill.
Table 1. The variables of the models, divided into state variables
(l) and derived variables (m). Variable Model
FYRISÅ HBVNP LEEDS BIOLA Water temperature l Lake volume l l Dissolved phosphorus/ l l l Phosphate Particulate phosphorus l l Total phosphorus l m m m Phosphate in sediments l Total phosphorus in l sediment Organic nitrogen l Dissolved inorganic ll l nitrogen (DIN) Total nitrogen l m m Nitrate in sediment l Ammonium in sediment l Oxygen l Suspended particles l Detritus l Organic matter in l l sediment Chemical oxygen m demand (COD) Secchi depth m Chlorophyll m Phytoplankton l la Zooplankton l
aTwo phytoplankton groups are modelled algae and cyanobacteria.
59°20’ 59°00’ 58°40’ 58°20’ 14°00’ 13°00’ 0 10 20 30 40 50 km River Göta Älv Dalbosjön Värmlandssjön Skoghall pulp & paper mill
Outlet sampling location at Vargön
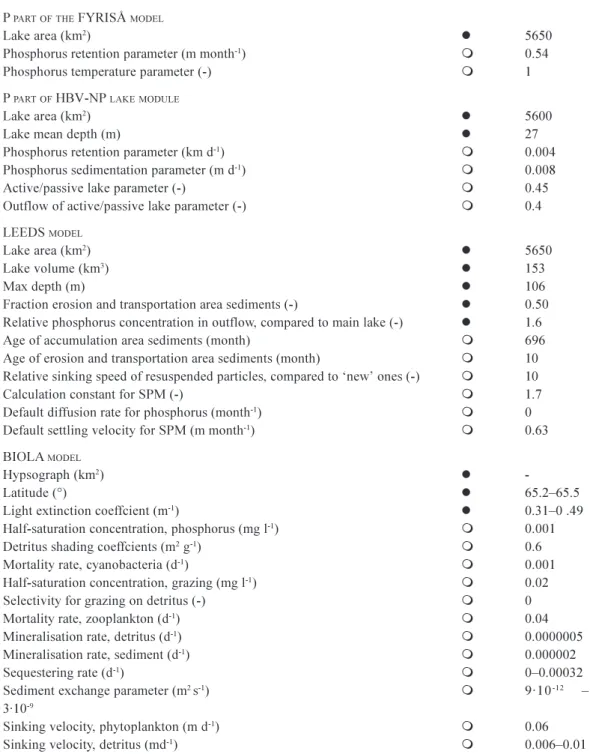
Table 2. Lakespecific constants that need to be assigned new values for the implementation to Lake Vänern.
(l determined from maps or experiments; m determined through calibration.) P PARTOFTHE FYRISÅ MODEL
Lake area (km2) l 5650
Phosphorus retention parameter (m month-1) m 0.54
Phosphorus temperature parameter () m 1 P PARTOF HBVNP LAKEMODULE
Lake area (km2) l 5600
Lake mean depth (m) l 27
Phosphorus retention parameter (km d-1) m 0.004
Phosphorus sedimentation parameter (m d-1) m 0.008
Active/passive lake parameter () m 0.45 Outflow of active/passive lake parameter () m 0.4 LEEDS MODEL
Lake area (km2) l 5650
Lake volume (km3) l 153
Max depth (m) l 106
Fraction erosion and transportation area sediments () l 0.50 Relative phosphorus concentration in outflow, compared to main lake () l 1.6 Age of accumulation area sediments (month) m 696 Age of erosion and transportation area sediments (month) m 10 Relative sinking speed of resuspended particles, compared to new ones () m 10 Calculation constant for SPM () m 1.7 Default diffusion rate for phosphorus (month-1) m 0
Default settling velocity for SPM (m month-1) m 0.63
BIOLA MODEL
Hypsograph (km2) l
Latitude (°) l 65.265.5
Light extinction coeffcient (m-1) l 0.310 .49
Halfsaturation concentration, phosphorus (mg l-1) m 0.001
Detritus shading coeffcients (m2 g-1) m 0.6
Mortality rate, cyanobacteria (d-1) m 0.001
Halfsaturation concentration, grazing (mg l-1) m 0.02
Selectivity for grazing on detritus () m 0 Mortality rate, zooplankton (d-1) m 0.04
Mineralisation rate, detritus (d-1) m 0.0000005
Mineralisation rate, sediment (d-1) m 0.000002
Sequestering rate (d-1) m 00.00032
Sediment exchange parameter (m2s-1) m 9·10-12
3·10-9
Sinking velocity, phytoplankton (m d-1) m 0.06
Sinking velocity, detritus (md-1) m 0.0060.01 other two models, LEEDS and BIOLA, are complex
independent lake models, but with different resolution. The state variables, lake specific constants and inputs for all models are summarised in Tables 1, 2 and 3 respectively.
The FYRISÅ model is part of a catchment model intended to evaluate different actions in reducing the nutrient load to the sea from River Göta Älv (Fig. 1). On a monthly basis, it models total nitrogen and total phosphorus, and the lake is
modelled as two sequential basins (without intermixing). The model has only three state variables (Table 1) and five parameters (Table 2). It was developed by the Swedish University of Agricultural Sciences in Uppsala, and has been applied to the Swedish catchments of River Fyrisån (Kvarnäs, 1996), Lake Vättern (Kvarnäs, 1997), and Lake Storsjön (Johansson and Kvarnäs, 1998). The explained variance (R2, Nash and Sutcliffe, 1970) between model
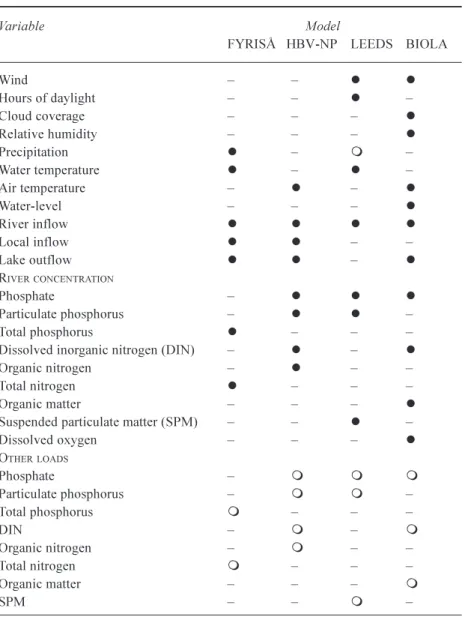
Table 3. Input data to run the models, divided into varying time series (l) and time
series approximated with constants in the application to Lake Vänern (m).
Variable Model
FYRISÅ HBVNP LEEDS BIOLA
Wind l l Hours of daylight l Cloud coverage l Relative humidity l Precipitation l m Water temperature l l Air temperature l l Waterlevel l River inflow l l l l Local inflow l l Lake outflow l l l RIVERCONCENTRATION Phosphate l l l Particulate phosphorus l l Total phosphorus l Dissolved inorganic nitrogen (DIN) l l Organic nitrogen l Total nitrogen l Organic matter l Suspended particulate matter (SPM) l Dissolved oxygen l OTHERLOADS Phosphate m m m Particulate phosphorus m m Total phosphorus m DIN m m Organic nitrogen m Total nitrogen m Organic matter m SPM m
Table 4. Model characteristics
FYRISÅ HBVNP LEEDS BIOLA Number of states and outputs (Table 1) 3 6 10 14 Number of input time series (Table 3) 9 12 11 12 Number of parameters 4 7 25 66 Number of fitted parameters (Table 2) 4 7 7 12 Number of subbasins (horisontal resolution) 2 1 2 5 Number of depth layers (vertical resolution) 1 1 3 34 Number of functional compartments 1 2 1 1 Execution time (15 year simulation on a PC) 4 s <1 s 2 min 2 hr Software requirements LABVIEWa EXCELb MATLABc FORTRANd
compiler
awww.ni.com/labview/
bwww.microsoft.com, for the HBV catchment model see (SMHI, 1999) cwww.mathworks.com
results and experimental data for phosphorus transport is 0.65 for the Lake Vättern catchment and 0.81 for the River Fyrisån. Both the FYRISÅ model and HBVNP lake module, described in the next paragraph, have been calibrated to simulate only the conditions at the lake outflow, not the inlake conditions.
The HBVNP lake module is part of a catchment scale runoff (Bergström, 1995; Lindström et al., 1997), nitrogen (Arheimer and Brandt, 1998) and phosphorus model (Andersson et al., 2002), HBVNP, developed at The Swedish Meteorological and Hydrological Institute (SMHI). This model, like the FYRISÅ model, was developed to assess nutrient transport to the sea under different management scenarios. An earlier version of the model has simulated nitrogen for catchments in Sweden (Arheimer and Brandt, 1998; Brandt and Ejhed, 2002), for several countries in Europe, and for the Baltic Sea drainage basin (Petterson
et al., 2000). The HBVNP lake module for phosphorus has
so far been applied to two eutrophic lakes (Lake Ringsjön and Lake Glan in Sweden) with satisfactory results (for total phosphorus R2 =0.43 and 0.60 respectively) and to the
present Lake Vänern (R2 =0.03). The low explained variance
in Lake Vänern reflects the lack of seasonal variation in observations, rather than a bad fit of the model. The model simulates, on a daily basis, organic and inorganic nitrogen, particulate phosphorus and soluble reactive phosphorus. The lake module is composed of two boxes, one active with constant volume and one passive, with volume varying with inflowoutflow. The outflow of the active box is replaced by water (and nutrients) from the passive box. Only in the active box is there nutrient transformation.The outflow is taken from both boxes and the outflow concentration is a weighted mean of the concentration in the boxes where the weight is determined by a lake parameter.
LEEDS is a box model of eutrophic effects in lakes. Initially, it included only the phosphorus cycle; dissolved phosphorus, particulate phosphorus and phytoplankton (Håkanson, 1999). Later, suspended particles (SPM), closely connected with particulate phosphorus, were included and Dahl (2004) modified the model for Lake Vänern, which is modelled as two subbasins, Värmlandssjön and Dalbosjön, with vertical resolution surface water/deep water/sediments. The temporal resolution is monthly. In total, the LEEDS model has seven phosphorus states and four particle states per subbasin (Table 1, there are phosphorus and SPM states in surface water, deep water and sediments). The version of LEEDS applied to Lake Vänern, modelling both phosphorus and SPM, has been applied to Lake Erken (Sweden), Lake Balaton (Hungary), Lake Kinneret (Israel), and Lake Batorino (Belarus), with a mean error in total phosphorus of 9% (Malmaeus and Håkanson, 2004). The version with
phosphorus only has been applied to the Lake Southern Bullaren and several bays of Lake Mälaren, all in Sweden. In addition, the SPM part of the model has been used on its own for the Belorussian Lakes Miastro and Naroch (Malmaeus and Håkanson, 2003).
BIOLA, (Pers, 2002), developed at SMHI to simulate scenarios of eutrophication remedial measures on the nutrients and algae in eutrophic lakes, has been applied to the two Swedish eutrophic Lakes Glan and Ringsjön (Pers and Persson, 2003) with acceptable fits for crucial variables (namely inorganic nutrients and phytoplankton). It is built on a 1D lake model which simulates vertical temperature distribution, momentum and mixing with the ke turbulence model (Rodi, 1987). The physical model has been applied successfully to simulate lakes and seas (Sahlberg, 1988; Omstedt, 1990). By modelling Lake Vänern as five subbasins, some horizontal resolution has been simulated. The daily water exchange between Lake Värmlandssjön and Lake Dalbosjön is calculated, based on observed water levels and the density profiles in the respective basins (Pers and Persson, 2003). The vertical resolution varies from cells of 1 m thickness (the upper 20 m) to up to 8 m cells in the deepest parts of the lake, while the temporal resolution is 24 hours. The primary state variables for Lake Vänern are dissolved nutrient concentrations (dissolved inorganic nitrogen, DIN, and phosphate, PO4) and organic carbon in
phytoplankton and detritus. In total 12 state variables (Table 1) are simulated. Total phosphorus (TP) is summed from phosphate, algae, detritus and zooplankton. The stoichiometric relationship between carbon and phosphorus in detritus was modified for calculating total phosphorus. In the earlier simulations, the Redfield ratio for phytoplankton was used (Pers and Persson, 2003). However, Lake Vänern has a high input of terrestrial organic matter of quite different composition from algal-derived organic matter; therefore, an estimated carbon to phosphorus ratio from Lake Vänern measurements of TOC (total organic carbon) and TP (1.7 mg P(g C) 1 was used on the modelled
detritus.
The data requirements of the FYRISÅ and LEEDS models are monthly mean values for both inputs and reference data. The HBVNP and BIOLA models use daily data for inputs and reference data.
THE DATA
The data used in this study have four main sources. Daily or 3hourly measurements of precipitation, wind, cloud coverage, relative humidity, river flow, lake water level, and air temperature are supplied by SMHI (www.smhi.se). Monthly samples of water temperature, chemistry and
biology in Lake Vänern, the outflow river Göta Älv, and the major inflowing rivers come from a data base maintained by SLU, the Swedish University of Agricultural Sciences (info1.ma.slu.se/db.html). Data on nutrient emissions from point sources comes from the data base of the TRK project, which estimated the transport, retention and source apportionment of nitrogen and phosphorus from Sweden to the sea (Bergstrand et al., 2002; Brandt and Ejhed, 2002) (wwwnrciws.slu.se/TRK/). Data on nutrient emissions from the near shore area comes from Wallin (1994). To achieve daily input values for the BIOLA and HBVNP models, river concentration data have been interpolated linearly between the sampling dates. The monthly mean values used by FYRISÅ and LEEDS are approximated by a single monthly sample. The data from the Värmlandssjön basin is an average of one monthly sample each from several depths at a number of sampling locations.
MODEL CALIBRATION AND VALIDATION
The models are calibrated for the period 19851992 (except for BIOLA, for which the calibration period was 1990 1993); the parameters adjusted in the calibration are marked with m in Table 2. The FYRISÅ model is calibrated using
total phosphorus data from the lake outflow (the nitrogen part of the model is not used). The retention parameter is calibrated and the temperature parameter is left at its original value given by Sonesten et al. (2004). The objective function is the sum of squared errors. The HBVNP model is calibrated for soluble reactive phosphorus, total phosphorus and dissolved inorganic nitrogen, also with data from the lake outflow, but with explained variance as the objective function. The LEEDS model is calibrated for all the outputs and states (Table 1) except for some sediment variables for which no reference data are available. The objective function is a weighted sum of squared errors, where the variables COD, Secchi depth, total and dissolved phosphorus have the highest weights. Only the calculation constant for SPM is adjusted. The other parameters are kept at their values from Dahl (2004). The BIOLA model is calibrated for PO4,
dissolved inorganic nitrogen (DIN), total organic carbon (TOC) and phytoplankton in three of the five subbasins (southeastern coast of Värmlandssjön, main Värmlandssjön and northern Dalbosjön). The fit is judged by visual inspection of time series of simulated and observed daily concentrations. The many interdependent calibration parameters, long simulation time and lack of an automatic calibration routine, made calibration of BIOLA complicated and the use of one objective function would give too little information for choosing the next parameter combination to test.
The models were validated against data of dissolved
phosphorus and total phosphorus, from the outflow river Göta Älv (FYRISÅ, HBVNP and LEEDS) and monthly mean values from the Värmlandssjön subbasin (LEEDS and BIOLA). The validation period is 19932000, except for the BIOLA model, where it is 19851990 and 1994 2000. The calibration period for BIOLA is different because it had been calibrated before this study was initiated, and because the long calibration time made a new calibration impractical.
SCENARIOS
The models are used to simulate two scenarios, representative of questions that may be asked by management authorities. The study also indicates whether the models give similar results. The first scenario simulates an expansion of the Skoghall pulp and paper mill, on the northern shore of Lake Vänern (Fig. 1), in accordance with an application to the environmental court in February 2001 to increase production of paperboard by 40%. It was estimated that emissions of SPM would increase from 3500 to 5000 kg day1, phosphorus from 50 to 60 kg day1 and
nitrogen from 300 to 450 kg day1.
The second scenario is one of reduced nutrient load of nitrogen and phosphorus in the catchment of Lake Vänern and the River Göta Älv; septic tanks were installed for all households not already connected to municipal sewage treatment works. This measure is estimated to reduce the nitrogen load to Lake Vänern by 1300 kg day1 (3%) and
the phosphorus load by 145 kg day1 (14%) (Sonesten et
al., 2004). In all models, these load reductions were made
to inorganic nutrients.
Results
MODEL CALIBRATION AND VALIDATION
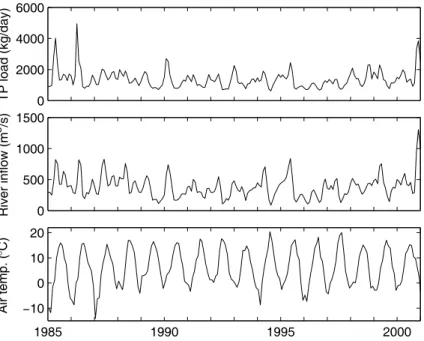
The results from the calibration are given in Fig. 2, showing total phosphorus and dissolved phosphorus between 1985 and 2000. The fit to experimental data, expressed as root mean square error (RMSE), (Mayer and Butler, 1993), is given in Table 5. The model results agree with the empirical data except for the slightly high concentrations for the BIOLA model (Fig. 2). Time series of three important inputs; total phosphorus load, river inflow and air temperature are shown in Fig. 3.
Observations from the subbasin Värmlandssjön are depth-integrated monthly averages from five locations. Observations from the lake outflow, River Göta Älv, are monthly samples from the sampling location at Vargön, 3 km downstream from Lake Vänern. Model results are monthly values for the FYRISÅ and LEEDS models but daily values
Fig. 2. Comparison of the model results for FYRISÅ (· · ·), HBVNP ( · ), LEEDS (), and BIOLA ( ) to measured data (l).
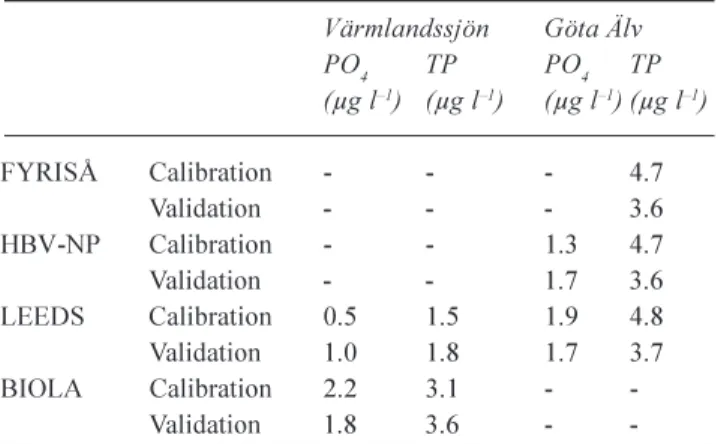
Table 5. The model fit to experimental data (expressed as root
mean square error). The calibration time is 19851992 and the validation is 19932000 except for BIOLA with calibration 1990 1993 and validation 19851989 and 19942000.
Värmlandssjön Göta Älv PO4 TP PO4 TP (µg l1) (µg l1) (µg l1) (µg l1) FYRISÅ Calibration - - - 4.7 Validation - - - 3.6 HBVNP Calibration - - 1.3 4.7 Validation - - 1.7 3.6 LEEDS Calibration 0.5 1.5 1.9 4.8 Validation 1.0 1.8 1.7 3.7 BIOLA Calibration 2.2 3.1 - -Validation 1.8 3.6 -
-for HBVNP and BIOLA. This gives comparisons of similar variables for LEEDS at Värmlandssjön, and for HBVNP and BIOLA at River Göta Älv, while the other observation model comparisons in Fig. 2 are slightly off.
The retention of dissolved P in the HBVNP lake module depends on temperature and a calibrated parameter which, to reduce the dissolved P concentration of outflow to match observations, had to be so high that the temperature dependence was neutralised. This is possible because the retention does not depend on the current concentration of dissolved P. The outcome is a dissolved P without seasonal variations. In BIOLA, the primary sink of dissolved P is uptake by phytoplankton. Internal sources, i.e. mineral-isation of organic matter, contribute only 3% (in Lake Värmlandssjön); the rest is taken from external loads. The modelled phytoplankton in BIOLA peaks in late summer/
19850 1990 1995 2000 2 4 6 LEEDS HBVŦNP BIOLA Dissolved P (µ g/l) 0 20 40 FYRISÅ, HBVŦNP, LEEDS & BIOLA
Total P (µ g/l) 0 2 4 6 Dissolved P (µ g/l) BIOLA LEEDS 0 20 40 Total P (µ g/l) LEEDS BIOLA 0 2 4 6 Dissolved P (µ g/l) BIOLA LEEDS Measurements 0 20 40 Total P (µ g/l) LEEDS BIOLA Värmlandssjön Dalbosjön River Göta Älv
Fig. 3. Three of the most important inputs to the models: total phosphorus load (top), river inflow (middle), and air temperature (bottom). All
values are monthly averages.
Table 6. The change in dissolved phosphorus and total phosphorus
for the two scenarios. For FYRISÅ and HBVNP the change is in outflow concentration, while for LEEDS and BIOLA it is in Lake Värmlandssjön. The average concentration in Värmlandssjön (19902000) is 2 µg l1 for PO
4 and 7 µg l1 for total phosphorus.
Variable Model
FYRISÅ HBVNP LEEDS BIOLA PULPANDPAPERMILLEXPANSION
PO4 (µg l1) - 0.00 0.01 0.01
Ptot (µg l1) 0.09 0.12 0.02 0.01
NUTRIENTLOADREDUCTION
PO4 (µg l1) - -0.6 -0.1 -0.25
Ptot (µg l1) -1.3 -0.6 -0.4 -0.35 early autumn causing the abrupt decrease seen in the
phosphate time series (Fig. 2). These peaks are sometimes double the size of observed phytoplankton peaks.
Modelled total phosphorus (TP) does not show the variations that dissolved P does for LEEDS and BIOLA. The reason is (for BIOLA) the high, almost constant concentration of detritus in the model, which is the main part of TP. The detritus concentration is mostly organic matter coming from the land, primarily the constant industrial loads in Lake Värmlandssjön.
A much higher RMSE value for validation than for calibration is a sign of overfitting, i.e. using too complex a model. This is not the case for any of the models. For total P in Göta Älv, the RMSE for validation is consistently lower than for calibration. This is plausible given the noisy data and short validation time. For all models, the RMSE is higher for total phosphorus than for phosphate, reflecting the higher variance in total phosphorus measurements. The standard deviation of sampling and analysis is 1.3 µg l1 for total
phosphorus and 0.7 µg l1 for dissolved phosphorus, as
determined by comparing samples from adjacent depths on the same location and sampling day.
SCENARIO SIMULATIONS
The models are used to simulate two scenarios for which changes in dissolved and total phosphorus concentration are compiled in Table 6. The models gave similar results. Increased emissions from Skoghall pulp and paper mill had a negligible effect on water quality. The increase in dissolved
phosphorus and total phosphorus is less than 1% above the reference simulation (Fig. 2). Installation of septic tanks to rural households decreased the concentration of dissolved phosphorus between 8% and 19% compared with the reference simulation (Fig. 2), while total phosphorus decreased about 5%.
The second scenario did not have any radical effect on the processes governing dissolved P. In BIOLA, the lower dissolved P concentration decreased the algal growth, causing lower algal concentration peaks, but the overall picture is the same. In the HBVNP lake module, the reduction of dissolved P was still minimal; thus there was no change in function of the model. The scenarios effect
0 2000 4000 6000 TP load (kg/day) 0 500 1000 1500 River inflow (m 3 /s) 1985 1990 1995 2000 Ŧ10 0 10 20 Air temp. ( °C)
on total phosphorus was for BIOLA mostly and for the HBVNP lake module only; the effect of the change in dissolved P, while for LEEDS the scenario had a substantial effect on TP also. The reason for the HBVNP result is that the load reduction was made for dissolved P (and N) only, while for BIOLA and Leeds several variables were influenced by the decrease in nutrient inflow, although much more so for LEEDS.
MODEL COMPARISONS
In this section, the models are compared regarding their suitability as tools for management of eutrophication problems. The first thing to look at is how well the models simulate the present situation. The fit to calibration and validation data (phosphorus) is similar for the FYRISÅ, HBVNP, and LEEDS models (Fig. 2, Table 5). The BIOLA model is slightly poorer than the others. The RMSE is about twice that of LEEDS (Table 5).
The different model constitutions give the models different qualifications for scenario simulations. Long-term effects of build-up and release of nutrients in the lake, associated with load changes, can be modelled only if the model includes sediment accumulation, as do LEEDS and BIOLA. These are also the only models able to distinguish different parts of the lake spatially. The resolution of LEEDS is two basins and the resolution of BIOLA is five basins. Incorporation of sequential basins with water flow in only one direction is possible in all models, but simulation of mutual water exchange can be modelled only in LEEDS and BIOLA.
The execution time (Table 4) of the FYRISÅ and HBVNP models is short, whereas the LEEDS and especially the BIOLA model have long run times. This does not severely affect the simulation of scenarios, but long execution times hamper the calibration of a model. BIOLA especially , with a very long run time and many parameters is very time consuming to calibrate for a new lake. The LEEDS and BIOLA models have more state variables and outputs not discussed in this paper (see Table 1). They can, therefore, give more comprehensive answers to the scenario questions. The numbers of different input time series are about equal for the four models, though multiple time series are necessary for the multibasin models (Table 4).
Discussion
The primary sinks of dissolved phosphorus in a lake are algal uptake, adsorption to particles and bacterial uptake (Correll, 1998). The low dissolved P concentration in Lake Vänern gives only a low concentration of phytoplankton,
except in some polluted bays (Welch and Lindell, 1978). While the complex model BIOLA simulates algae, and thereby associated variations in dissolved P, the HBVNP lake module fails to simulate dissolved P variations when the temperature dependence of dissolved P retention is neutralised. This happens because the retention function of HBVNP dissolved P does not respond to the algae and dissolved P that are actually in Lake Vänern.
The sedimentation of particulate phosphorus in the HBVNP lake module depends on the modelled concentration though it is similar to the sedimentation of detritus in BIOLA. The two models have about the same sinking velocity for particular P and detritus. The value, c. 0.008 m d1, is lower than the value observed by Burns and
Rosa (1980) for particulate organic carbon (POC, 0.24 m d1)
for their smallest size range (110 µm). In the case of BIOLA, this can be due to the detritus, mostly of river organic matter, largely humic and not particulate. The net settling velocity in the LEEDS model is 0.02 m d1. A still
lower net settling velocity, 0.0005 m d1 was used by James
and Bierman Jr. (1995).
Algae, zooplankton and phosphate contribute to total P in the BIOLA model, thus several processes are involved in changes of total P. The largest in Lake Värmlandssjön is, according to BIOLA, growth of phytoplankton and cyanobacteria and grazing by zooplankton but these processes do not contribute to changes in total P. The most important process for TP is sedimentation of detritus, while sedimentation of phytoplankton and release of phosphate from the sediment is of much less consequence.
The concentration of phosphorus in River Göta Älv is more variable than that in Lake Vänern. Also the P in Lake Dalbosjön is more variable than in Lake Värmlandssjön (Fig. 2).
It was shown earlier that all the models fit the calibration data fairly well but disagree to a large extent on the effects of changed nutrient emissions to the lake. This might well reflect the selection of the period of calibration period entirely after 1985, when water quality was nearly constant in Lake Vänern. All the scenario simulations are, therefore, extrapolations, outside the area of calibration. The problem is probably most severe for the conceptual models, FYRISÅ and HBVNP, while the ecological and more processbased models, LEEDS and BIOLA are more likely to function reasonably outside their calibration range.
The model validation also uses data from this period of nearly constant water quality. Therefore, the estimate of model error that the validation gives is only valid when the emissions are close to the present ones, and not for conditions with drastically changed nutrient emissions to the lake. To get reliable error estimates for other conditions,
the models must be validated under those conditions. There is also the problem with the inaccuracy and imprecision of ecological data, as pointed out by Rykiel (1996). No model can be expected to give results that are more accurate than the reference data available. The results of the scenario simulations, although uncertain and disparate, show that the nutrient remedial action can have substantial impact on phosphorus in Lake Vänern.
Conclusions
This study shows that no one model is always preferable; all four models have their advantages and disadvantages. The simpler models have the advantage of ease of use and of minimal execution and calibration time. They also benefit from being part of catchment models. The more complex models are useful for more complex scenarios; they include more dimensions, variables and processes that are necessary to answer certain questions.
The fit to calibration data is good for the FYRISÅ, HBV-NP and LEEDS models while the BIOLA model is slightly worse. The fit to validation data is similar to that for calibration data. The model input requirements of daily input data for HBVNP and BIOLA cannot be met for the river inflow, and have had to be approximated using interpolated monthly data. From the scenario simulations, one can conclude that an increase in emissions of 40% from a pulp and paper mill has a negligible effect on the water quality, while a 14% reduction in phosphorus emissions following better waste-water treatment in rural households decreases the phosphorus concentration in the lake.
When used to model scenarios, the results between the models vary, but the uncertainty (RMSE) is large and, since all the scenarios are extrapolations (outside the area of calibration and validation), they are also unreliable.
Acknowledgement
The authors wish to thank Lars Sonesten for access to the modeThe authors wish to thank Lars Sonesten for access to the FYRISÅ model. C.Pers was financed by the Swedish Environmental Protection Agency and the Swedish Foundation for Strategic Environmental Research through the Swedish Water Management Research Programme (VASTRA).
References
Andersson, L., Hellström, M. and Persson, K., 2002. A nested model approach for phosphorus load simulation in catchments: HBVP. In: Proc. XXII Nordic Hydrological Conference, A. Killingtveit (Ed.), Nordic Association for Hydrology, Røros, Norway. 229238.
Arheimer, B. and Brandt, M., 1998. Modelling nitrogen transport and retention in the catchments of southern Sweden. Ambio 27, 471480.
Bergstrand, M., Brandt, M., Arheimer, B., Grahn, G., Gyllander, A., Pers, B. C., Svensson, P., Ejhed, H., Johnsson, H., Olsson, K., Mårtensson, K., Löfgren, S. and Westling, O., 2002. TRK nutrient load in Sweden, An operational system for catchment modelling of nutrient transport, retention and source apportionment. In: Proc. XXII Nordic Hydrological Conference, A. Killingtveit (Ed..), Nordic Association for Hydrology, Røros, Norway. 211228.
Bergström, S., 1995. The HBV model. In: Computer Models of
Watershed Hydrology, V.P.Singh (Ed.). Water Resources
Publications, Littleton, Colorado. 443476.
Brandt, M. and Ejhed, H., 2002. TRK transport retention källfördelning belastning på havet (TRK Transport Retention
Source Appointment Load to the Sea). Report 5247, Swedish
Environmental Protection Agency (In Swedish).
Burns, N.M. and Rosa, F., 1980. In situ measurement of the settling velocity of organic carbon particles and 10 species of phytoplankton. Limnol. Oceanogr., 25, 855864.
Correll, D.L., 1998. The role of phosphorus in the eutrophication of receiving waters: A review. J. Environ. Qual., 27, 261266. Dahl, M., 2004. Appropriate Modelling Complexity: An
Application to mass-balance modelling of Lake Vänern, Sweden.
PhD. Thesis, Dept. of Earth Sciences, Uppsala University, Uppsala, Sweden. 42pp.
Dahl, M. and Wilson, D.I., 2004. Is Lake Vänern well mixed? A statistical procedure for selecting model structure and resolution.
J. Great Lakes Res., 30, 267276.
Håkanson, L., 1995. Models to predict lake annual mean total phosphorus. J. Aquat. Ecosyst. Health, 4, 2558.
Håkanson, L., 1999. Water Pollution methods and criteria to
rank, model and remediate chemical threats to aquatic ecosystems. Backhuys Publishers, Leiden, The Netherlands.
James, R.T. and Bierman Jr., V.J., 1995. A preliminary modeling analysis of water quality in Lake Okeechobee, Florida: Calibration results. Water Res., 29, 27552766.
Janse, J.H. and Aldenberg, T., 1990. Modelling phosphorus fluxes in the hypertrophic Loosdrecht lakes. Hydrobiolog. Bull., 24, 6989.
Johansson, J. and Kvarnäs, H., 1998. Modellering av näringsämnen i Storsjön och dess tillrinningsområde (Modelling of nutrients
in Lake Storsjön and is catchment). Rapport 1998:13,
Länsstyrelsen Gävleborg (In Swedish).
Jørgensen, S., 1994. Fundamentals of ecological modelling, 2nd Edition. Elsevier, Amsterdam, The Netherlands.
Jørgensen, S.E., 1995. Stateoftheart management models for lakes and reservoirs. Lakes Reservoirs: Res. Manage., 1, 79 87.
Kvarnäs, H., 1996. Modellering av näringsämnen i Fyrisåns avrinningsområde källfördelning och retention (Modelling
of nutrients in the catchment of River Fyrisån source appointment and retention). Tech. rep., Fyrisåns vattenförbund
(In Swedish).
Kvarnäs, H., 1997. Modellering av näringsämnen i Vätterns tillrinningsområde källfördelning och retention (Modelling
of nutrients in the catchment of Lake Vättern source appointment and retention). Report 46, Vätternvårdsförbundet,
(In Swedish).
Lindström, G., Johansson, B., Persson, M., Gardelli, M. and Bergström, S., 1997. Development and test of the distributed HBV96 hydrological model. J. Hydrol., 201, 272288. Malmaeus, M. and Håkanson, L., 2003. A dynamic model to
predict suspended particulate matter in lakes. Ecol. Model., 167, 247262.
Malmaeus, M. and Håkanson, L., 2004. Development of a lake eutrophication model. Ecol. Model., 171, 3563.
Mayer, D.G. and Butler, D.G., 1993. Statistical validation. Ecol.
Model., 68, 2132.
Nash, J.E. and Sutcliffe, J.V., 1970. River flow forecasting through conceptual models. Part I A discussion of principles. J.
Hydrol., 10, 282290.
Omstedt, A., 1990. A coupled onedimensional sea iceocean model applied to a semienclosed basin. Tellus, 42A, 568582. Orlob, G. T. (Ed.), 1983. Mathematical Modelling of Water Quality:
Streams, Lakes, and Reservoirs. Wiley, Chichester, UK..
Pers, B.C., 2002. Model description of BIOLA a biogeochemical
lake model. Reports Hydrology No. 16, SMHI, Sweden.
Pers, B.C. and Persson, I., 2003. Simulation of a biogeochemical model in different lakes. Nord. Hydrol., 34, 543558. Petterson, A., Brandt, M. and Lindström, G., 2000. Application of
the HBVN model to the Baltic Sea drainage basin. Vatten, 56, 713.
Reynolds, C.S., 1999. Modelling phytoplankton dynamics and its application to lake management. Hydrobiologia, 395/396, 123 131.
Rodi, W., 1987. Examples of calculation methods for flow and mixing in stratified fluids. J. Geophys. Res., 92 (C5), 5305 5328.
Rykiel, E., 1996. Testing ecological models: the meaning of validation. Ecol. Model., 90, 229244.
Sahlberg, J., 1988. Modelling the thermal regime of a lake during the winter season. Cold Reg. Sci. Technol., 15, 151159. Scavia, D., 1980. An ecological model of Lake Ontario. Ecol.
Model., 8, 4978.
SMHI, 1999. Integrated hydrological modelling system (IHMS). Manual version 4.5.
Sonesten, L., Wallin, M. and Kvarnäs, H., 2004. Kväve och fosfor till Vänern och Västerhavet Transporter, retention och åtgärdsscenarier inom Göta Älvs avrinningsområde (Nitrogen
and phosphorus to Lake Vänern and the Western Ocean Transports, retention and remedial actions within the Göta Älv catchment). Report no 2004:33, Länsstyrelsen i Västra
Götalands län or Report no 2004:17, Länsstyrelsen i Värmlands län or Report no 29, Vänerns vattenvårdsförbund (In Swedish). Wallin, M., 1994. Tillförsel av kväve och fosfor till Vänern 1992 samt förslag till mål och åtgärder (Nitrogen and Phosphorus
load to Lake Vänern 1992 along with proposed goals and actions). Report no 1, Åtgärdsgrupp Vänern, Karlstad (In
Swedish).
Welch, E.B. and Lindell, L.T., 1978. Phosphorus loading and response in Lake Vänern nearshore areas. Environ. Sci., 12, 321327.
Wilander, A. and Persson, G., 2001. Recovery from eutrophication: Experiences of reduced phosphorus input to the four largest lakes of Sweden. Ambio, 30, 475485.