CODNSTO
*OF
R -sac ws 4rle buud hf
0
A ri
g 19
GA
U
.INiLBRTR
M A''SARUSTTS
NSTTUT
OfTEC NOL OG'Y
CA
DIG
39-*SAHSTS
IN A SUPERSONIC NOZZLE
by
DANIEL B. DAWSON
Research was carried out under the Sponsorship of the U. S. Navy, Office
of Naval Research, Power Branch Contract Nonr 3963(07)
GAS TURBINE LABORATORY REPORT No. 90
April 1)b''
MASSACHUSETTS INSTITUTE OF TECHNOLOGY Cambridge, Massachusetts
ABSTRACT
Experiments were performed involving condensation of supersaturated benzene and chloroform vapors in a supersonic nozzle, with compressed air as the carrier gas.
Measurements were made by means of static pressure taps along the nozzle walls, and from the resultant pressure profile it was possible to deduce the point of incidence of condensation. Incidence of condensation
for chloroform was generally above the triple point, whereas incidence for benzene was generally below the triple point. For the latter, condensate
droplets were assumed to be supercooled liquid, and physical properties
for these droplets were obtained from the extrapolation of liquid properties. Experiments showed that the magnitude of the water vapor content of the carrier air made no observable difference in the condensation behavior of either fluid. It was demonstrated that addition of small amounts of these fluids to the carrier air tended to reduce the thickness of the boundary layer in the nozzle.
Comparison of experimental results with theory show, without making any adjustments to physical properties of condensate droplets to account for size, that incidence of condensation for chloroform can be predicted by the revised theory of nucleation, whereas benzene incidence can be pre-dicted by neither revised nor classical theory. These results, combined with prior data on other fluids, show that at present neither theory seems
to be generally applicable. In support of previous conclusions, the
problem may well be the assumption that bulk properties may be assigned to small (30 - 50 molecules) droplets of condensate.
ACKNOWLEDGEMENTS
The author is indebted to his thesis advisor, Professor K. C. Russell of the Department of Metallurgy, for his advice and guidance throughout the period during which this work was in progress. His contributions to the theoretical considerations were appreciated, as were his efforts to maintain the relationship of this project to the field of metallurgy.
The author further wishes to express his gratitude for the assistance, encouragement, and advice of Professor P. G. Hill of the Department of Mechanical Engineering, who originated the condensation work undertaken at the Gas Turbine Laborat-ory, and acted as unofficial advisor for this experiment.
Mr. Harry Jaeger spent considerable time demonstrating the apparatus and assisting with matters of theory and procedure, and his earlier work provides the basis on which this report is built. Mr. Ernest Willson made or modified much of the existing equipment, and helped with the run-ning of the early experiments. Mr. Thorvald Christensen was likewise instrumental in the manufacture and setup of the experimental apparatus.
Mrs. Joan Kukolich provided assistance with theoretical problems as well as doing much of the programming. Mrs. Madelyn Euvrard, prior to a temporary leave necessitated by illness, was helpful in the procure-ment of supplies and equipprocure-ment, and in making the author feel at home
in the G.T.L. Miss Jennifer Jacobs typed the final draft of the manu-script, managing text, equations and corrections in excellent humor.
Finally, the author wishes to thank his wife, Betty, who has com-bined the roles of wage earner, manuscript typist, and mother-to-be, and provided the encouragement necessary to complete this project.
TABLE OF CONTENTS Page
ABSTRACT i
ACKNOWLEDGEMENTS ii
TABLE OF CONTENTS iii
LIST OF FIGURES V
NOMENCLATURE vi
I. INTRODUCTION 1
I.A Background to the Problem 1
I.B Earlier Investigations 2
I.C The Present Experiment 4
II. EXPERIMENTAL PROGRAM 6
II.A Preliminary Considerations 6
II.B Experimental Equipment 10
II.C Experimental Procedure 14
II.D Presentation of Data 15
III. THEORETICAL CONSIDERATIONS 18
III.A Gas Dynamics 18
III.B Nucleation- Theory 19
III.C Drop Growth 23
IV. COMPARISON OF THEORY WITH EXPERIMENTAL DATA 26
IV.A Incidence of Condensation 26
IV.B Pressure Profile Shape 28
V. CONCLUSIONS 30
TABLE II - SUMMARY OF CHLOROFORM EXPERIMENTS AND RESULTS REFERENCES
FIGURES 1-15
APPENDIX A - METERING OF THE INJECTED VAPOR APPENDIX B - CALCULATION OF wo AND yo
APPENDIX C - DERIVATION OF GAS DYNAMIC RELATIONS APPENDIX D
-APPENDIX E
-EFFECT OF PRESSURE, MOISTURE AND INJECTED VAPOR ON EFFECTIVE NOZZLE FLOW AREA
CALCULATION OF PHYSICAL AND THERMODYNAMIC PROPERTIES OF THE TEST FLUIDS
APPENDIX F - TABULATION OF EXPERIMENTAL DATA
34 35 A-1 B-1 C-1 D-1 E-1 F-1
LIST OF FIGURES
1. Schematic Diagram of Apparatus. 2. Detail of Nozzle II.
3. Effective Area Distribution of Nozzle II.
14. Mass-Flow Effect on Pressure Profiles with Benzene Condensation, Tests 9, 15 and 19.
5. Temperature Effect on Pressure Profiles with Benzene Condensation, Tests 19 and 34.
6. Comparison of Theory with Data for Benzene Condensation, Test 12. 7. Comparison of Theory with Data for Benzene Condensation, Test 10. 8a. Comparison of Theory with Data for Benzene Condensation, Test 23. 8b. Effect of Decrease in Surface Tension, Test 23.
8c. Effect of Increase in Surface Tension, Test 23. 9. Incidence of Benzene Condensation.
10. Mass-Flow Effect on Pressure Profiles with Chloroform Condensation,
Tests 514 and 67.
11. Temperature Effect on Pressure Profiles with Chloroform Condensa-tion, Tests 61 and 66.
12. Comparison of Theory with Data for Chloroform Condensation, Test 146. 13. Comparison of Theory with Data for Chloroform Condensation, Test 48. 14. Comparison of Theory with Data for Chloroform Condensation, Test 49. 15. Incidence of Chloroform Condensation.
NOMENCLATURE
A Nozzle flow area
*
A Nozzle flow area at throat
C Pre-exponential factor in nucleation-rate equation
c L Specific heat of condensate
c Specific heat of perfect gas at constant pressure p
c' Specific heat at constant pressure of mixture of carrier and vapor p
c Specific heat of perfect gas at constant volume
*
g Number of molecules in critical-sized cluster
*
AG Free energy of formation of critical-sized cluster *1
AG Free energy of formation of critical-sized cluster without gasifi-cation effects
h Specific enthalpy of condensate h Latent heat of vaporization
J Nucleation rate, nuclei per unit time per unit volumne K Boltzmann Gas Constant
K Shape factor in calculating droplet surface area M Mach number F Molecular weight ii Mass-flow rate n Mass of molecule P Stream pressure p Vapor pressure R Gas constant
T Universal gas constant r Radius of droplet
*
r Radius of critical-sized droplets r Surface-area average radius
S Supersaturation ratio,
p/psat T Temperature
U Internal energy of condensate u Stream velocity
v Specific volume
VL Volume per molecule of liquid phase
x Streamwize co-ordinate
y Mole fraction of injected vapor Z A function of y, Z =li/(y-1) + 1/2 $ Mass flux impinging on droplet surface
r
Gasification factor in nucleation-rate equation y Ratio of specific heats, c /cp v
U Mass fraction of stream that is condensate Condensation coefficient
p Density
a Surface tension
w Mass fraction of stream that is injected vapor
Subscripts
c Referring to the carrier gas
D Referring to the droplet conditions
i Referring to conditions at incidence of condensation L Referring to the liquid state
m Referring to the carrier gas + vapor mixture Referring to initial or stagnation conditions
s Referring to the solid state v Referring to the vapor
I. INTRODUCTION
A. Background to the Problen
Despite the considerable amount of recent experimentation that has been done on the subject of homogeneous nucleation and growth of conden-sate droplets from a supersaturated vapor, much work yet remains to be done.
An understanding of the nature of condensation is of prime importance in many fields, particularly in the design of steam tunbines. Condensate droplets can erode turbine components severely, and condensation may result in the failure of the turbine to achieve predicted performance if it is not taken into account in design calculations. With the possibility that in the near future turbines may be run using metal vapors as the working fluid, it is imperative that condensation studies be extended to a larger range of materials. While it is of course desirable to ascertain in detail the condensation behavior of certain fluids with particular applications, it is also desirable (and perhaps necessary) that knowledge of the theoret-ical aspects of nucleation and growth processes be advanced at the same time. In particular, many fluids, do not, for a variety of reasons, lend
themselves to the study of their condensation behavior. In such cases, accurate and applicable theoretical prediction of the condensation process would be invaluable.
Advances in the understanding of nucleation and growth have applications in other fields, also. Metallurgy and ceramics, for instance, deal with phase changes of a different nature; mainly liquid-solid (solidification) and solid-solid. However, the nucleation and growth equations for these
transformations are in many cases either identical to or similar to the corresponding condensation equations. But the study of vapor-liquid trans-formations has an advantage in that both the experiments and the theoretical relations are simpler than in the case of liquid-solid and solid-solid
transformations.
B.. Earlier Investigations
The earliest condensation experiments were performed in cloud chamber apparatus Experiments by Wilson (1899) and Powell (1928) were followed by work with a number of fluids by Volmer and Flood (1934). The cloud chamber method has certain drawbacks, however.' For one thing, the onset of conden-sation is chosen as the point at which a cloud first becomes visible. This depends to a large degree on the judgment of a particular observer, and the appearance of a cloud may correspond to a time considerably later than the onset of substantial nucleation. Also, the slow rate of expansion in the cloud chamber means that much care must be taken that foreign particles (such as dust) are not present in any large quantities, or homogeneous nucleation will not be possible. Finally, the observations are qualitative
rather than quantitative.
These objections are largely done away with by conducting the expan-sion in a converging-diverging supersonic nozzle. The expanexpan-sion is rapid enough that, as demonstrated by Stodola (1927) and others, homogeneous nu-cleation should occur even for high concentrations of dust particles. And, the condensation process may be observed down the length of the nozzle by pressure measurements.
A considerable number of nozzle experiments have been conducted using steam or water vapor as the working fluid, which is understandable when one
considers the importance of the steam turbine in industry today. Among the
experimenters have been Yellot (1934), Rettaliata (1936), Binnie and Woods (1938), Binnie and Green (1942), and more recently Wegener and Pouring (1964) and Jaeger (1966). Water vapor, however, is certainly not an ideal fluid
for the study 6f nucleation and growth, since its behavior is influenced to a large degree by the high dipole moment of the water molecule.
Data on other fluids is limited. Stever and Rathbun (1951) studied condensation of air, and Willmarth and Nagamatsu (1952) and Faro, Small and Hill (1952) provide some data on nitrogen. Scharrer (1939) studied the nucleation on ions of several organic fluids. Tests in the Gas Turbine Laboratory have been conducted recently by Duff (1966) using pure carbon dioxide, by Kremmer and Okurounmu (1965) using pure ammonia, and by Jaeger
(1966) using ammonia and water vapor mixed with air used as a carrier gas.
Reviews of existing data have been made by Wegener (1958), Stever (1958) and Hill (1965). There have been efforts in these and other papers to find some correlation between experimental data and the present theoretical equa-tions for nucleation and growth.
At present there are two conflicting theories concerning the nucleation of condensate from the supersaturated vapor. One approach, usually referred to as the classical theory, treats the condensate nuclei as stationary in
space. Lothe and Pound (1962) and others have proposed a revised theory in which the partition functions for the rotational and translational de-grees of freedom of theanuclei-are accounted for, resulting in a substantial increase in predicted nucleation rate. For the tests conducted here using benzene and chloroform, the rates predicted by revised theory were on the order of 1015 greater than those predicted by classical theory.
By means of laborious hand calculations, Oswatitsch (1942) was able to show for a limited amount of data that water vapor condensation agreed well with the predictions of classical theory. This was confirmed by Hill (1965)
and Jaeger (1966) using a procedure involving the IBM 7094 computer. With the assumption that supercooled liquid nuclei exist below the triple point, the data of Duff (1966) on carbon dioxide also agrees well with the classi-cal nucleation equations. On the other hand, Kremmer and Okurounmu (1965) and Jaeger (1966) conclude that ammonia shows much better agreement with the revised theory.
C. The Present Experiment
The experiments detailed herein were undertaken to expand the previous Gas Turbine Laboratory condensation work to include two more liquids. The nozzle used here was used in all three previous Gas Turbine Laboratory in-vestigations, and the other experimental equipment was identical in most respects to that used by Jaeger (1966).
There are, of course, both advantages and disadvantages to using similar equipment. On the positive side, many of the problems which one ordinarily encounters in assembling experimental apparatus have been ironed out. Fur-thermore, additional investigations may provide support for previous work
or corrections for previous mistakes. On the other hand, there is a tendency to perpetuate these same mistakes. For this and other reasons, it is desirable that experiments be conducted with the same fluids but on different apparatus, so as to provide a check on the work conducted here.
Benzene and chloroform were chosen as test fluids for several reasons. It was hoped that experimental data on them would provide some resolution of the conflict over nucleation theories. As will be discussed in Section II,
The results of the tests were certainly not in uniform support of
either of the theories. It is true that chloroform agreed well with the re-vised theory. But benzene did not agree with either revised or classical theory. In fact, results for benzene indicated that a nucleation rate ap-proximately midway between the two theories (or about a factor 10 times the rate predicted by classical theory) provided generally good agreement between data and theory. This conflicting data seems best to support the
conclusion of Jaeger (1966) that any agreement between data and the present theories is mostly fortuitous.
II. EXPERIMENTAL PROGRAM
A. Preliminary Considerations
It has already been mentioned that one of the chief problems encoun-tered with the cloud chamber apparatus is that of ensuring that nucleation is homogeneous, rather than heterogeneous. The presence of sites on which nuclei will preferentially form will reduce the supersaturation necessary to cause condensation if these sites are present in sufficient quantities. In an expansion in a supersonic nozzle, the problem of contamination due to the presence of heterogeneous nucleation sites is not as serious as it is
in the case of the cloud chamber, principally because the expansion rate (and hence the nucleation rate) is much greater in the nozzle.
The contamination can be of three principal types: dust and other inert foreign particles, water vapor, and liquid droplets of the test vapor present prior to the incidence of condensation.
It is shown in calculations by Duff (1966) that there is little chance that dust particles could be present in concentrations sufficient to make homogeneous nucleation difficult. However, in the experiments run here, the carrier air was filtered as a precaution, and prior to any actual measure-ments the apparatus was always run for a few minutes to clear out any dust which might have accumulated in the pipes.
Jaeger (1966) showed that the presence of water vapor had a significant effect on the critical supersaturation necessary for condensation of ammonia. This was to be expected since ammonia has an affinity for water vapor. For benzene and chloroform, no such effect would be expected. However, to check this assumption, some tests were run in which the moisture present in the
carrier air was reduced from a normal concentration of 35 parts per million
(by weight) to less than .03 parts per million.
The presence of liquid droplets mixed with vapor prior to condensation was a more serious problem than the two previously mentioned. This would
arise if the liquid benzene or chloroform were not vaporized completely before being injected into the carrier air stream. As a result, the mass
fraction of injected vapor would be overestimated, and the liquid droplets would provide heterogeneous nucleation sites. As will be described, a means of visually checking the extent of vaporization was installed at the vapor injection point.
A point which needed checking was the assumption made previously by
Jaeger (1966) that the thickness of the boundary layer at any position in the nozzle was unchanged either by the injection of a vapor into the carrier air stream, or by small pressure changes due to condensation or variation of stagnation pressure. The investigation of these effects is considered in more detail in Appendix D.
The choice of benzene and chloroform for these tests was dictated by several factors. Most previous nozzle work had been done on relatively light molecules (carbon dioxide, with a molecular weight of 48, being the heaviest), so it was desirable to extend the experiments to heavier molecules. Also, because the effect of the molecular dipole moment on condensation be-havior has not been resolved, benzene (with a zero moment) proved to be an interesting fluid to study. Chloroform had the advantage of a low free-zing point. Since expansion in the nozzle was unlikely to cool the fluid below this point, there was no need to decide whether to assume solid or
with other fluids, including benzene, where the triple point was higher. Toxicity was a problem with both fluids, but was not the problem it might have been for other fluids (such as carbon tetrachloride). Finally, there had to be sufficient data available in the literature that the physical properties of these fluids could be found over a wide range of temperatures.
Another consideration was the selection of the most useful experimental technique for studying the condensation process. Duff (1966) found inter-ferometry to be useful in showing that flow was one-dimensional and in in-vestigating the boundary layer thickness at the nozzle throat, but had no success in applying the same method to condensation. Jaeger (1966) studied the normal shock characteristic in condensing flow and concluded that any possible advantages that this method might have were far outweighed by in-herent disadvantages.
In view of the good results obtained by most previous investigators when using static pressure measurements, this method was adopted for all tests. As a means for studying condensation, it has several advantages. It gives a quantitative rather than qualitative measure of condensation, and the measurements by static pressure taps are easily taken and easy to interpret. The static pressure at any distance from the nozzle throat gives a continuous measure of the effect of condensation by the relation
(to be derived later):
d P _ M2
irdp
1 dA (1)Pdx _(M -1)(1-11) + Py C T (1-wo)M /M + WO-P dx - A dx
T_71.p V c
where P is the static pressure M is the Mach number
Y is the specific heat ratio (C /C ) of the uncondensed gas mixture
h is the latent heat vaporization of the test vapor
C is the specific heat of the uncondensed gas mixture
T is the absolute temperature
(1- Ub) is the mass fraction of the total mass flow that is carrier air
M ,Mc are the molecular weights of the test vapor and carrier air, respectively
A is the flow area
x is the distance from the nozzle throat
Note that when yrdp=0, the relation reduces to the expression for an isentropic expansion. When condensation occurs and ji and dp are not 0, there will be a rise in pressure if the first term of the dp/dx coefficient (due to the release of latent heat) is greater than the second term.
Note, also, that the second term of the dp/dx expression approaches a value of 1/(1-0) when the molecular weight of the test vapor is close to the molecular weight of the carrier air (=29). In this case, for a pressure rise to occur we must have:
h
__ > 1 1 (since P is generally less than 0.25)
C T 1-11 p
In the case of benzene (R = 78.1) and chlorofor(Th = 119.4), the second term becomes much smaller; on the order of 0.4 and 0.3 respectively. As a result, the latent heat term does not have to be very large in order to get a substantial pressure increase due to condensation.
Another point to consider is that as the condensation occurs closer to the throat (and hence the Mach number approaches 1.0), the denominator
in the first term on the right-hand side of equation (1) becomes very small, and therefore the magnitude of any pressure rise which may occur due to con-densation will become much greater.
B. Experimental Equipment
The equipment used in this experiment may be divided into three broad categories. There is a system to provide high pressure carrier air. There is a second system to store, meter, and vaporize measured quantities of the test liquid, and to mix this vapor with the carrier air. Finally, there is the nozzle in which the pressure distribution is measured. A schematic
drawing of the test equipment is given as Figure 1.
1. Carrier Air System
The carrier air was supplied by an oil-free, two-stage, piston-type compressor. A large receiving tank maintained a steady supply of the air at 90 psig. After leaving the tank, the air was filtered twice, and then dried in a dehumidifier. The dehumidifier was packed with activated alumina desiccant, and if properly reactivated after prior use, it could provide dried air with a dewpoint of -60OF (which, at one atmosphere total pressure, corresponds to 35 ppm water vapor if one assumes extrapolated liquid proper-ties below the triple point). Because of dehumidifier limitations, the pressure available was reduced to 60 psig by means of a regulator on the air line.
Further drying of the air could be accomplished by the use of a cold trap. This was, in essence, a counterflow heat exchanger with one end im-mersed in boiling liquid nitrogen (-3210F), so that air passing through the
low temperature end would lose most of the water vapor present. Taking air from the dehumidifier at a dew point of -60 0F, the cold trap could reduce
0
the moisture content to a dew point of less than -150 F (corresponding to .03 ppm water), which was the lowest limit which could be measured by the
available equipment. The counterflow arrangment allowed nearly total tem-perature recovery of the carrier air at exit. The cold trap could be used without any liquid nitrogen if a moisture level lower than that provided by the dehumidifier was not necessary, or (as shown in the schematic) it
could be bypassed entirely. The pressure drop in the cold trap was about
5 psi greater than when the bypass was used.
After passing through the cold trap, the carrier air could be heated in another heat exchanger. This consisted of a stainless-steel coil (through which the air passed) contained in a jacket through which steam could be passed. It was used in only about half of the experiments, primarily when
0
a fixed temperature was desired. Stagnation temperatures of over 200 F could be obtained with this heater, but the use of lucite view port windows on the air line made such high temperatures dangerous.
To measure the moisture content of the carrier air, an "Alnor Dew Pointer" was connected to a tap on the air line downstream of the point of test vapor injection (the reason for the choice of this position will be
discussed later). This device operates on the cloud chamber principle. A sample of air is expanded rapidly into a chamber, and will show a condensa-tion cloud if the expansion is great enough. The dew point is related to the expansion ratio at which a cloud is first visible, and precise instruc-tions for obtaining it are given with the "Dew Pointer". The device was never operated when benzene or chloroform were being injected into the
carrier air, since these liquids would have a disastrous effect on any rubber gaskets or seals present.
2. Test Vapor Injection System
The liquid was stored in a pressurized tank, and metered with a flat-plate orifice. This equipment is described in more detail in Appendix A.
The stream of liquid passing through the metering orifice was heated intwo heat exchangers before being injected into the carrier air system as vapor. The first was three feet long, of the counterflow type, and heated with high pressure (120 psig) steam. The second consisted of a
coiled fifteen-foot length of 1/4" diameter stainless steel tubing, wrap-0
ped with electrical heating tape and heated to about 400 F.
To improve the performance of the heat exchangers and assure complete vaporization of the liquid, it was necessary to inject a small quantity of high pressure bleed air downstream of the metering orifice but before the
first heat exchanger. Initially, the bleed air was taken directly from the compressor, but the high moisture level of this bleed air negated the drying effect of the cold trap in spite of the small flow rate of air involved. Therefore, the bleed air was subsequently taken immediately upstream of the cold trap, with the pressure drop in the trap providing a sufficient pressure difference to get good heat exchanger performance. Placing the "Dew Pointer" downstream of the vapor injection point, it now proved
pos-0
sible to get dew points of at least -150 F (the lowest that could be mea-sured with the "Dew Pointer"), despite the addition of small amounts of
0
-60 F dew point bleed air.
Propelled by the bleed air, the vaporized test liquid was injected into the two-inch diameter carrier air pipe by a short length of stainless steel tubing which directed the vapor against the pipe wall. At this point, view ports were installed which allowed a visual check on the extent of
at the injection point. The flow of bleed air was adjusted to the minimum which would still maintain complete vaporization.
3. Nozzle and Related Equipment
The nozzle used was the same one used by Kremmer and Okurounmu (1965), Duff (1966) and Jaeger (1966), and was referred to as Nozzle II by them. Figure 2 shows its construction. It had a rectangular, constant-width
cross-section, .15" by .20" wide at the throat. The top and bottom plates were hinged to give a variable divergence angle. In all tests conducted here, the plates were set at a total included angle of about 60. The side walls were formed by two flat plates, one of which was pierced on the nozzle centerline with .020" diameter static pressure taps, spaced .10" apart in the region in which experimental observations were made, and .20" apart farther downstream. These taps were connected to a manometer board (des-cribed below) .
The experimentally-determined effective area distribution of Nozzle II is shown in Figure 3. The effective area, or actual flow area, is given by the true area at a given cross section less the area of the boundary layer. More is said about this in Section II.C "Experimental Procedures" and in Appendix D.
Connected to the downstream end of the nozzle was a steam ejector which had the dual purpose of ejecting the toxic benzene and chloroform
vapors to the roof, and lowering the back pressure on the nozzle so as to keep the recovery. shock far down the nozzle.
The manometer board mentioned previously consisted of a bank of twenty-five mercury-filled, U-tube manometers, each side of the tubes being 100" tall. Nineteen pressure taps on the nozzle were connected to U-tubes, and the pressure distribution which showed on the manometer board could be
C. Experimental Procedure
The general procedure involved in an experimental run was to first measure the conditions at nozzle inlet: PO and To, the stagnation
pres-sure and temperature; and wo, the initial fraction of the total mass flow that was test vapor. Secondly, the pressure distribution in the nozzle was recorded by a Polaroid photograph of the manometer board.
The stagnation pressure near the nozzle inlet, where the Mach number was on the order of 0.1, was measured by a static pressure tap connected to a mercury-filled, U-tube manometer. The stagnation temperature was measured at the same point by an iron-constantin thermocouple placed in the air
stream. The mass flow rate of vapor injected into the carrier air could be determined as outlined in Appendix A, and from this the initial mass frac-tion of vapor, wo, could be found by the procedure outlined in Appendix B.
Plotting the distribution of static pressure rations, P/PO, versus
*
(A/A ) , the effective area distribution, has proven to be one of the
eff'
most useful methods of presenting condensation data. The pressure ratios can be found from the static pressure distribution recorded on the manometer board and the measured stagnation pressure. However, each pressure ratio must be related to a corresponding effective area ratio. This may be done
quite easily if we assume that the boundary layer thickness (and hence the effective area ratio) at a given point in the nozzle will not be changed
a) by a change in the composition of the gas mixture, or b) by small (10 to 20%) variations in the pressure.
As shown in Appendix D, these assumptions are incorrect, but the magnitude of the corrections is small enough that we may, for the time being, ignore them.
With the assumption of an invariant effective area distribution, we need only determine it for one set of conditions. This is most easily done
by finding the pressure distribution corresponding to the expansion of pure carrier air in the nozzle.
According to Shapiro (1953), by assuming a one-dimensional, isentropic expansion of a perfect gas we may relate the effective area ratio to the pressure ratio by this equation:
A y12 Y1/(-)1/2 1/E,-(PO Yl -1/2 (2
A/A* = i(.2(Y+l)/(y-i) -l/Y (Y1)/Y (2)
This relation is tabulated for various values of y in the Gas Tables (Keenan and Kaye, 1945). For expansion of pure carrier air, the table for
y = 1.4 may be used.
With the addition of benzene and chloroform, both of which have a y = 1.1,
the Y of the mixture of carrier air and test vapor will be somewhat less than 1.4. Thus, from equation (2), we find that the pressure ratio for a
given area ratio will be somewhat greater for the mixture than for pure air, even for a non-condensing, isentropic expansion.
For an experimental run, the actual pressure ratio corresponding to a given tap will be greater than what would be predicted by the equation (2), the difference being due to the release of latent heat of vaporization upon
condensation of the injected vapor as shown by equation (1).
D. Presentation of Data
Two parameters, which represent important means of presenting conden-sation data, should be explained at this point.
The "supersaturation", or supersaturation ratio, of a vapor is defined as S = p/p sat' where p is the actual vapor pressure and psat is the partial
pressure of saturated vapor at the same temperature. For SKIl the vapor is said to be undersaturated; for S>1 it is supersaturated. Si, the super-saturation at the onset (or incidence) of condensation, is a useful measure of the condensation behavior of a particular fluid.
The "incidence of condensation" represents the point at which condensa-tion can first be seen to have begun. It generally corresponds to the forma-tion of about 0.1% condensate (by weight), which also corresponds roughly to the first point at which the pressure ratio becomes noticeably greater than the value predicted by equation (2). The point of incidence is defined by the partial pressure, p , and temperature, Ti, at which condensation
be-gins.
For a given test, the supersaturation, pressure and temperature at in-cidence may all be found from the pressure profile by picking the pressure ratio (P/PO). at which the experimental profile first appears to depart sig-nificantly from the calculated isentropic expansion profile.
P P. and().p = yoP. Pi =P(PO) i ad pi Yi T
~
(y -1)/y T. = To( ). = TO(m)) 1 To PO iwhere y is the specific heat ratio of the gas mixture, and corresponds to the y used in equation (2) to calculate the non-condensing profile, and yo is the initial mole fraction of test vapor at the nozzle inlet. The
method of calculation of y and yo from measured data is given in Appendix B. The experimental data for all tests is summarized in Tables 1 and 2 for benzene and chloroform, respectively, and includes the following:
a) the initial conditions: wo, yo, PO, To
b) the conditions at incidence of condensation: p,, T., S.
c) the moisture content of the carrier air, by dew point. The experimental pressure distributions for all tests are tabulated in Appendix F. Typical pressure distributions, P/Po versus A/A , are shown in Figures 4 through 8 (for benzene), and 10 t14ouQ~ ib (for chloro-form).
In Figures 9 and 15, the points of incidence for the benzene and
chloroform tests, respectively, are shown along with the corresponding satura-tion lines on a log-log plot of vapor pressure versus temperature.
Firgures 4 and 10. illustrate the effect of injecting increasing quan-tities of vapor. If the initial temperature is the same, there will be an increase in the pressure rise due to condensation (a larger "hump", in other words) as well as a rise in the pressure ratio at which the incidence of condensation occurs. Figures 5 and 11 illustrate the effect of increas-ing the initial temperature. If the mass fraction of injected vapor re-mains constant, a rise in initial temperature will depress the pressure ratio at which incidence occurs.
Figures 6 through 8 and 12 through 14 show a comparison of theoretical pressure profiles with certain experimental profiles. The methods by which these theoretical profiles may be determined are presented in the following section.
III. THEORETICAL CONSIDERATIONS
The differential equations from which the state of a condensing flow can be derived for any position in the nozzle are based on the theories of gas dynamics, and nucleation and growth of condensed phases. Gas dynamic theory provides three differential equations in terms of four unknowns. The final relation, which makes the solution of the differential equations possible, is obtained from nucleation and growth theory. The method by which the differential equations are derived is outlined below. References are given for those who desire a more detailed derivation.
A. Gas Dynamics
The derivation of the differential equations from gas dynamic theory makes use of the following assumptions:
1. Flow is steady, one-dimensional, and inviscid, and no heat transfer takes place between the fluid and the surroundings. 2. The vapor phase consists of a mixture of perfect gases.
3. The volume of the condensate is negligible in comparison to the volume it occupied as a vapor.
4. The boundary layer thickness (and hence the effective area distribution) is not affected by small changes in pressure, or by a small change in the composition of the vapor phase. The differential equations were derived from four relations:
1. Conservation of Mass: m = pAu= constant
1-p
2. Conservation of Energy: C dT + udu = h dp
p fg
3. Conservation of Momentum: -AdP = rhdu
4. Equation of State for a Perfect Gas: P = pRT
An additional relationship is found in the definition of the Mach number, M = u/(yRT)1 /2. As outlined in Appendix C, from these relations
it is possible to obtain three equations (for dP/dx, dT/dx and du/dx) in terms of five unknowns: P(x), T(x), u(x), y(x) and A(x).
One of the unknowns, A(x), may be determined from the experimental effective area distribution. One more relation is needed to solve the equations, and this comes from the theory of nucleation and growth of
condensed phases. B. Nucleation Theory
The formation of a condensed phase from the vapor phase is opposed
by a potential barrier, the Gibbs Free Energy change (AG), which is a func-tion of the size and shape of the condensate particles formed as well as the physical properties of the fluid.
If we assume that the condensate forms spherical droplets (or nuclei),
AG will reach a maximum value at some droplet radius r , called the criti-cal radius, and thereafter will rapidly become smaller. Nuclei whose
*
radii are less than r will tend to shrink, and nuclei whose radii are
* *
greater than r will tend to grow. Thus, AG , the Gibbs Free Energy of
*
formation of a nucleus of critical radius'r , represents the potential barrier which opposes the formation of stable condensate droplets.
At present there are two opposing theories which attempt to describe the nucleation process. However, although the two theories disagree on other points, they do agree on the form of the nucleation rate equation:
J = C exp(-AG */KT) (3)
where J is the nucleation rate, in particles per unit volume per unit time, of critical-sized nuclei, at a given point;
C is a factor to be explained subsequently K is the Boltzmann gas constant
*
AG is the total Gibbs Free Energy change in forming a critical-sized nucleus of condensate.
The point of disagreement between the two theories involves the terms which are thought to be contained in AG
Classical nucleation theory, as proposed by Becker and Doring (1935), Frenkel (1946), and Zeldovich (1942) among others, makes the assumption that nuclei are stationary in space, and hence the terms involved in AG may be reduced to two:
1. The change in free energy associated with the formation of the droplet surface;
2. The free energy change due to the isothermal change in vapor pressure which occurs when the vapor condenses as liquid.
The two terms, when combined, may be referred to as AG ( which may or may not be the total free energy change, AG , as we shall see).
2
AG -g KTin(S) + 4 (r ) (4)
*
where g is the number of molecules in a critical-sized cluster
S is the supersaturation
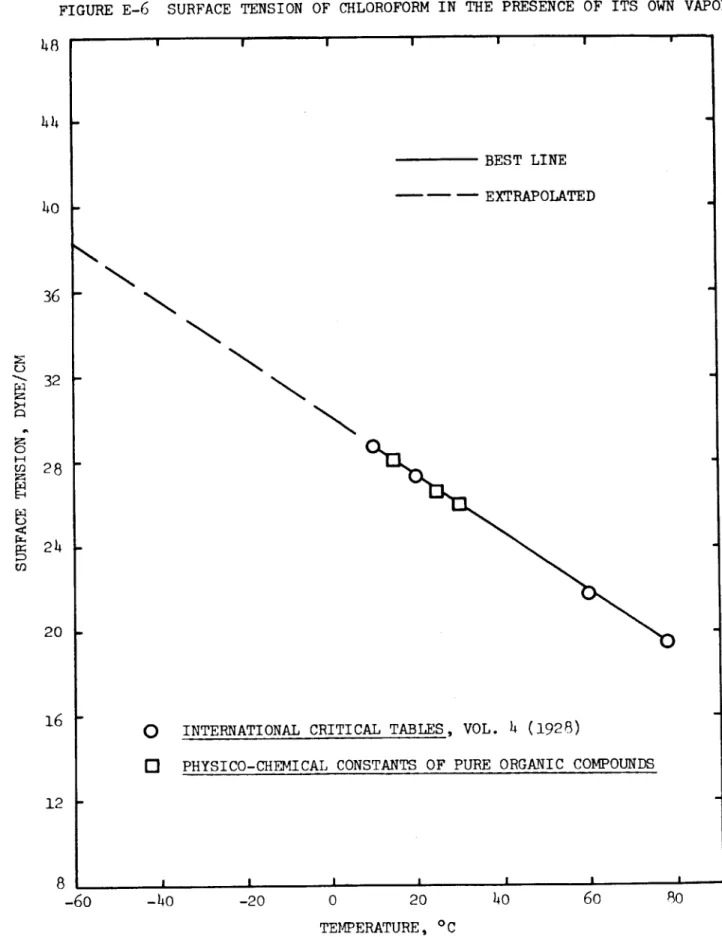
a is the flat-film surface tension of the liquid in the presence of its own vapor.
* *
The means by which g and r may be calculated will be shown
subse-*
quently, but first, it is necessary to consider the differences in AG which arise due to the revised nucleation theory.
The revised theory, which was first clearly set forth by Lothe and Pound (1962), and was elaborated upon in Feder, Russell, Lothe and Pound
(1966), takes issue with the assumption that nuclei are stationary in space. According to revised theory, one cannot ignore the rotational and translational degrees of freedom present in a nucleus of condensate
*
in the vapor phase. The total AG predicted by the revised theory will consist of the AG which classical theory predicts, plus free energy con-tributions from the translational and rotational motion of the droplet as
a whole, plus minor correction terms which account for the conservation of degrees of freedom.
Using the notation of Lothe and Pound, the total free energy change may be written as:
AG =AG -KTtnr
where KT Inr is taken as the sum of the additional free energy terms pre-scribed by the revised theory. The factor r is commonly referred to as the "gasification factor". Note that because of the form of the additional free energy terms in the expression above, the nucleation rate equation may be rewritten as
J = Cr exp (-AG /KT) (5)
with the gasification factor appearing as a pre-exponential. Then, for *'*
the classical theory,
r
= 1 and AG = AGNov, since we have removed the additional free energy terms from the
* *
exponential, we may consider the calculation of g and r . It is known that they may be related geometrically by
*
g v = 4 * 3 (6)
3
where vL is the volume of a condensate molecule.
* * *
Also, since AG is a
maximum
for r (and g ), the differential of* * *
equation (It) with respect to g may be set equal to zero. The term dr /d.g which occurs in this differential mr-y be fo'ind by differentiating equation (6).
* 2ovL
r
* * 2
g =2 h(r ) a
3 KTinS
or g =32 a3vL (8)
3 ('KTinS)3
Substituting the values into equation (4), and noting also that VL is inversely proportional to p the liquid density, it appears that the nucleation rate J as given in equation (5) will have an exponential term due to AG which is proportional to
3
PLZ
indicating a high degree of sensitivity to the physical properties of the fluid.
The equation for the gasification factor,
r,
is quite complicated, and an approximation shown below was used to calculate values ofr
for benzene and chloroform.I
M T 10 (19) 105 PLPwhere M is the molecular weight of the vapor
p is t1le vapor partial pressure in atmospheres PL is the liquid density in gm/cc
0
T is the temperature in K
Values of r for typical conditions for both benzene and chloroform were 14 , 16
in the range 10 to 10
The pre-exponential factor, C, in equation (5) is essentially the concentration of single molecules times the impingement frequency of single molecules on critical-sized clusters.
2 2o 1/2 C =( ) v ( -2)
KT L rm (10)
where m is the mass of the molecule.
The equations presented above represent a considerab le simplification of nucleation theory. For a more detailed treatment, the reader is referred to Frenkel (1946) for the classical theory, and to Feder, Russell, Lothe and Pound (1966) for the revised as well as the classical theory.
C. Drop Growth
The development of the equation for the growth of the condensed drop-lets makes use of the following assumptions:
1. The velocity distribution of the vapor molecules is Vaxwellian before collision, and after reflection or evaporatio.
2. The droplets are spherical.
3. Reflected molecules have come to thermal equilibrium with the d'rop-let before leaving its surface.
4. The rate of evaporation from the droplet is equivalent to the equilibrium rate of condensation at the droplet temperature and pressure.
5. The vapor surrounding the droplets is a mixture of perfect gases. We may assume that only a fraction of the molecules which collide with the droplet attach themselves to it. This fraction of the colliding mole-cules which does not reflect is given by , the mass accommodation coeffi-cient or "sticking" coefficoeffi-cient. The remainder, or (1- ), are reflected.
a, the rate at which molecules strike the droplet surface, is equal to p/(27rRT)l/2. If the fraction (1-E) are reflected, then the mass flux into the droplet must be
/2TRT
and by the assumption 4, the mass flux evaporating from the droplet is
related to the flat-film saturation pressure at the droplet temperature by:
_nD 2a
(P.)D pLRTDr
The conservation of mass may be written
dr & ) (11)
dt pL D
The energy flux per unit area to the drop is a(ZRT), where Z = ([l/(y-1)] + 1/2). The energy flux away from the droplet due
to reflection is (1-E) a (ZRT D), by assumption 3. The evaporating mass flux also carries the energy aD (ZRT D
The rate of change of the internal energy of the droplet is
dT foir3 D + 4 rUd
3
PLcL
+t 2PLUf
D where U f h =(g )RT - (h ) (12) fD fg y-l D fg DcL = specific heat of condensate
Thus, conservation of energy may be written
4r 3 D 7r 2 Ldr UD + 3~ L
P~L dt Tt r PL f D
2
hrr [8(ZRT) - (1-E) 8 (ZRTD) -u D(ZRTD)] (13)
Combining with equations (11) and (12), this may be rewritten as
-(Z-O)(1- ) - Z(l- ) = 0 (14) a TD D h where $ = -y-l RTD
To account for collisions of the vapor with the carrier gas, another term may be added to equation (14) of the form
-Z (1c) (1- )
c T R
D c
where subscript c refers to the carrier gas.
With these relations, TD and dr/dt may be evaluated if an initial radius is assumed. It is now possible to find yi and dz, and hence the four unknowns (dp/dx, dP/dx, dT/dx, dM/dx) are related by four equations. A
Runge-Kutta numerical integration procedure may be applied to solve these differential equations: dY = 8wJA dY = Y dr+ r*dY 2 ldt 1 dY = Y + JA ( hr*2) 3 2 dt dY hdx = = [Y + JA( wr*3)] 4 =m 3 dt 3 dY I = P[( hf d _dA [1 _ (y-1)(-)-5 dx OC 'T dx A dx
W
ey p dY = - T[(Y-7)(l-) 1 dP + h 6 dx ey P dx OC 'T dx p dY = =M[l- 1 dP + 1 dy+ 1dT + 1 dR) T dx YM2 P dx 2 y dx T dx R dxdYl, dY2 and dY3 are variables which are created to make the solution easier. Details of the derivation of the last four equations are presented in Appendix C, which also explains the meaning of 8 and * (variables intro-duced to reduce the complexity of the above equations).
IV. COMPARISON OF THEORY WITH EXPERIMENTAL DATA
The primary purpose of this experiment was to provide experimental
data with which to compare theoretical data computed by the methods presented in the preceding section. There are two major parameters which are useful in comparing theory with data.
A. Incidence of Condensation
For a given set of inlet conditions, theory should correctly predict the point of incidence,which corresponds roughly to the point of maximum nuclea-tion rate. The nucleation rate equation as developed in III.B is affected to a great degree by two factors: the pre-exponential gasification factor
(r), and the free energy barrier to nucleation (AG ).
The classical theory of nucleation predicts a r of 1, whereas revised theory predicts a r of lo 1-1015 for benzene, and 1015_ 1016 for
chloro-form. Thus, with a theoretical nucleation rate that is 10 1-1016 greater than that predicted by classical theory, the incidence of condensation will occur at much lower supersaturations for revised theory.
*1
It has been shown previously that AG is strongly dependent on the physical properties of the fluid. In particular, it is proportional to the cube of the surface tension. Therefore, a rise in surface tension will result in a greater barrier to nucleation, and consequently a greater
supersaturation will be necessary for condensation to occur.
Because of the small size of the liquid droplets, it is not neces-sarily correct to assume that the surface tension (a) of these droplets is the same as the flat-film surface tension (a.). However, a problem arises
in that there is disagreement over the direction toward which the correction in the flat-film values should go. Kirkwood and Buff (1949), for instance,
predict a reduction in surface tension with increasing curvature, whereas Oriani and Sundquist (1963) predict just the opposite for very small (10-100 molecules) droplets. The range of values for o/a, may go from about 0.8 to 1.2, and as a result the correction which is made for the surface tension may either raise or lower the point of incidence, depending on which correction is adopted.
For both benzene and chloroform, the point of incidence may be predicted quite accurately by assuming a certain value of r. For chloroform, a r of 1016 or greater provides good agreement on incidence between theory and data, as shown by Figures 12 through 14. The data on incidence for all chloroform tests is summarized in Figure 15, which is a log-log plot of incident pressures and temperatures. Also plotted on this are the saturation pressure, and lines of predicted incidence for r=l (classical theory) and r=1016 (revised theory). Again, note that the data agree much better with revised theory than with classical theory.
For benzene, a r of 10710 8 provides good agreement between theory and data, while neither revised nor classical theory will agree with data unless some modifi-cation (to the surface tension, for instance) is made. Figures 6 through 8a
demonstrate the relatively accurate prediction of incidence for" r=l0 , and in Figure 9 the incidence data for all benzene tests is summarized. The lines of predicted incidence in Figure 9 for r=l, r=108 and r=l015 also show the good agreement for 10 , and the poor agreement for classical and revised theories.
However, in the case of benzene where the incidence data appears to fall about midway between revised and classical theories, it is possible to modify the surface tension data such that both theories may be made to agree with ex-perimental incidence data. If it is assumed that the Oriani and Sundquist
correction to flat-film surface tension is correct, and the flat-film values are increased by about 10%, then the incident points now predicted by revised theory will show more agreement with data (see Figure 8c). Conversely, if the Kirkwood and Buff correction is adopted, and flat-film surface tension is re-duced by about 20%,then classical theory will now correctly predict points of incidence (see Figure 8b). While this "curve-fitting" is arbitrary, it does demonstrate the effect which uncertainity concerning the surface tension can have.
B. Pressure Profile Shape
The pressure profile shape may be considered in two parts: the shape following incidence, and the total pressure rise far downstream where nearly all the vapor has condensed.
The latter is a function primarily of the amount of vapor injected, and the heat of vaporization of the fluid. It is essentially independent of the point of incidence and the profile shape farther upstream.
The shape of the pressure profile following the incidence of condensa-tion is a funccondensa-tion primarily of the condensacondensa-tion coefficient, E, although
it is also affected to a lesser degree by the point of incidence and the amount and type of vapor injected.
Considering equation (1), incidence of condensation close to the throat (M=l) will tend to accentuate the pressure rise closely following incidence, which will often give a 'hump" to the pressure profile rather than a "ramp". This may be seen in Figure 11, for chloroform condensation, where a rise in
inlet temperature lowers the point of incidence, smoothing out the hump. The effect of the amount and type of injected vapor on the profile shape following incidence is similar to the effect these have on the downstream pressure rise. The more latent heat that is released, the greater the rise
in pressure.
The condensation coefficient (&) represents the fraction of molecules which collide with a droplet which are not reflected. The lower the value of
E, the more the growth of the condensate droplets is retarded. A low C (less
than about 0.1) will tend to smooth out the profile, and the pressure rise will not reach its final height until far downstream. The condensation coefficient should not be too important a factor for either benzene or chloroform. Hirth and Pound (1963) predict E=0.9 for benzene, and &=0.5 for chloroform.
The comparison of theory with data in Figures 6 through 8 (for benzene) and 12 through 14 (for chloroform) show that agreement on the pressure profile shape is only fair, although it is certainly much better for chloroform than for benzene. In particular, the profile shape following incidence for the chloroform data is quite good, and deviation between theory and data which oc-curs farther downstream is minor. The benzene profiles do not correspond either on the shape following incidence or on the downstream shape.
The fact that the theoretical downstream profile shape for benzene (and chloroform, to a lesser extent) deviates from the experimental shape would seem to mean that the amount of vapor injected was incorrectly measured,
or that a mistake was made in deriving the theoretical equations, or the data for heat of vaporization was incorrect. All three possibilities have been checked, with no error being found.
V. SUMMARY AND CONCLUSIONS
The comparison of theory and data for benzene condensation offers sup-port for neither the-classical nor the revised nucleation theories. If
an arbitrary pre-exponential factor of 10 -_10 is put into the nucleation rate equation, the point of incidence can be accurately predicted for a wide range of initial conditions. The summary of incidence data in Figure 9 shows the good agreement of theory with data for a pre-exponential factor of 10 , and also shows the absence of any substantial scatter in the experimental points of incidence. By making an arbitrary reduction in surface tension of about 20%, it is possible to get good agreement on incidence points be-tween data and classical theory (r=l). By a similarly arbitrary increase in
surface tension of 10%, it is also possible to get good agreement between revised theory (r=101 5) and experimental data.
The downstream pressure profile shape for benzene does not agree well with theoretical predictions, either in the shape immediately following
in-cidence or in the shape far downstream. The reason for the disagreement is not clear, but since the profile shape is not closely related to the point of incidence, conclusions on nucleation theory should not be affected.
Revised nucleation theory (r=10 16) shows good agreement with experi-mental chloroform data. The point of incidence of condensation may be
pre-16
dicted accurately by a pre-exponential factor of 10 or greater, as shown in Figures 12 through 14 and summarized in Figure 15. The predicted pres-sure profile shape following incidence and farther downstream both corres-pond closely tc data.. Classical theory will predict correct points of incidence only for a substantial (30% or more) decrease in surface tension.
For both benzene and chloroform condensation, there was no apparent change in either point of incidence or pressure profile shape when the moisture content of the carrier air was reduced by the use of the cold trap,
as shown in the incidence plots (Figures 9 and 15).
As explained in Appendix D, there was apparently a slight decrease in boundary layer thickness when benzene and chloroform were mixed with the
carrier air, but the effect was small and could be taken into account when experimental data were plotted.
In conclusion, it appears that the condensation behavior of chloroform may be predicted with good precision if the revised theroy of nucleation is adopted. Benzene condensation data appears to agree with neither classical nor revised theory, and instead falls about midway between the predicted behavior of these two theories.
The prediciton of the pressure profile shape following incidence does not in all cases agree with experimental data. Although this should have little affect on the conclusions made concerning nucleation theory, it does deserve further investigation. Since this represents the first time that relatively heavy molecules have been tested in the Gas Turbine Laboratory, it would seem desirable that more large molecular weight substances be tested.
Despite the fact that chloroform condensation showed good agreement with revised nucleation theory, it doesn't appear that any general conclusions
concerning the applicability of either theory may yet be made. Based on
current data, water vapor and carbon dioxide agree well with classical theory, ammonia and chloroform agree well with revised theory, and benzene agrees with neither theory. This would seem to lend support to the conclusion of Jaeger (1966) that neither theory is applicable in its present form, since both theories assign bulk properties to very small droplets. In the case of surface tension in particular, this assumption does not seem to be valid.
INITIAL CONDITIONS WO PO To (Atm) (OK)