Computational Understanding of Image
Memorability
by
Zoya Bylinskii
Submitted to the Department of Electrical Engineering and Computer
Science
in partial fulfillment of the requirements for the degree of
Master of Science
at the
MASSACHUSETTS INSTITUTE OF TECHNOLOGY
February 2015
c
○ Massachusetts Institute of Technology 2015. All rights reserved.
Author . . . .
Department of Electrical Engineering and Computer Science
January 30, 2015
Certified by . . . .
Antonio Torralba
Associate Professor
Thesis Supervisor
Certified by . . . .
Aude Oliva
Principal Research Scientist
Thesis Supervisor
Accepted by . . . .
Leslie A. Kolodziejski
Chair, Department Committee on Graduate Theses
Computational Understanding of Image Memorability
by
Zoya Bylinskii
Submitted to the Department of Electrical Engineering and Computer Science on January 30, 2015, in partial fulfillment of the
requirements for the degree of Master of Science
Abstract
Previous studies have identified that images carry the attribute of memorability, a predictive value of whether a novel image will be later remembered or forgotten. In this thesis we investigate the interplay between intrinsic and extrinsic factors that affect image memorability.
First, we find that intrinsic differences in memorability exist at a finer-grained scale than previously documented. Moreover, we demonstrate high consistency across participant populations and experiments. We show how these findings generalize to an applied visual modality - information visualizations. We separately find that intrinsic differences are already present shortly after encoding and remain apparent over time. Second, we consider two extrinsic factors: image context and observer behavior.
We measure the effects of image context (the set of images from which the experi-mental sequence is sampled) on memorability. Building on prior findings that images that are distinct with respect to their context are better remembered, we propose an information-theoretic model of image distinctiveness. Our model can predict how changes in context change the memorability of natural images using automatically-computed image features. Our results are presented on a large dataset of indoor and outdoor scene categories.
We also measure the effects of observer behavior on memorability, on a trial-by-trial basis. Specifically, our proposed computational model can use an observer’s eye movements on an image to predict whether or not the image will be later remembered. Apart from eye movements, we also show how 2 additional physiological measurements - pupil dilations and blink rates - can be predictive of image memorability, without the need for overt responses. Together, by considering both intrinsic and extrinsic effects on memorability, we arrive at a more complete model of image memorability than previously available.
Thesis Supervisor: Antonio Torralba Title: Associate Professor
Thesis Supervisor: Aude Oliva Title: Principal Research Scientist
Acknowledgments
Many people have earned my heartfelt thanks, through my continuing journey in science. I offer my thanks to:
∙ Aude Oliva, who has been an incredible source of support, mental and physical energy, invaluable brainstorming, and amazing foresightedness - a superwoman. ∙ Antonio Torralba, who has never ceased to dazzle me with his insightfulness,
inventiveness, and most importantly - optimism.
∙ Sven Dickinson, my first academic advisor, who has had a tremendous impact on where I am and where I’m going - a perpetual source of fuel.
∙ John Tsotsos, Stan Sclaroff, and Hanspeter Pfister, who have shown me that a good scientist is first and foremost a good person, and then a good researcher. ∙ My amazing colleagues and collaborators, most notably Melissa Le-Hoa Võ and
Michelle Borkin, who never stop smiling.
∙ Phillip Isola, who has been a mentor, a friend, and a truly inspiring researcher with a never-ending supply of ideas.
∙ Adrian Dalca, who has been a vital source of academic and personal support, and incredible kindness.
∙ My family and friends in Toronto, Vancouver, and Boston, who keep me ticking. And a very special thank you to the people, who by nature and nurture, have instilled in me the desire to know and understand as much as possible, Marina and Vasili Gavrilov. And to my biggest source of inspiration, Alexei Bylinskii.
Funding for this work has been provided by the National Sciences and Engineering Research Council of Canada (NSERC), the National Science Foundation (NSF), Xerox, Google, and the MIT Big Data Initiative at CSAIL.
Contents
1 Introduction 15
2 Understanding Intrinsic Effects on Memorability 19
2.1 Related work . . . 19
2.2 FIGRIM (Fine-Grained Image Memorability) dataset . . . 20
2.3 Crowdsourcing (within-category) experiment AMT 1 . . . 20
2.4 Memorability scores and comparison to other experiments . . . 22
2.5 Some scene categories are intrinsically more memorable . . . 25
2.6 Within categories, some images are intrinsically more memorable . . . 25
3 Computationally Modeling Context Effects on Memorability 27 3.1 Related work . . . 27
3.2 Crowdsourcing (across-category) experiment AMT 2 . . . 28
3.3 In-lab control experiment . . . 28
3.4 Contextually distinct images are more memorable . . . 30
3.5 More varied image contexts are more memorable overall . . . 32
3.6 Modeling image memorability as a function of image context . . . 34
3.7 When context matters most . . . 36
4 Eye movements to predict individual image memories 41 4.1 Related work . . . 41
4.2 Eyetracking experiments . . . 42
4.4 Eye movements are predictive of whether an image will be remembered 46
4.5 When individual differences matter most . . . 47
4.6 Not all images are equally predictable . . . 47
5 Contributions to Cognitive Science: Pupils as Indicators of Memory Processes 51 5.1 Related work . . . 51
5.2 In-lab experiments . . . 52
5.3 Differences in memorability show up early and change over time . . . 54
5.4 Pupil size and blink rates are predictive of differences in memorability 55 5.5 Discussion . . . 55
6 Application to Information Visualizations 57 6.1 Motivation . . . 57
6.2 Related work . . . 58
6.3 MASSVIS (Massive Visualization) dataset . . . 59
6.4 Online crowdsourcing experiments . . . 61
6.5 Some visualizations are intrinsically more memorable . . . 61
6.6 Visualization attributes are predictive of memorability . . . 62
6.7 How visualization memorability differs by publication source . . . 65
6.8 Discussion . . . 66
7 Conclusion 69 7.1 Contributions and discussion . . . 69
7.2 Future applications . . . 72
List of Figures
2-1 Sample crowdsourcing experimental sequence . . . 22
2-2 Sample images from the FIGRIM dataset . . . 24
3-1 Comparison of memorability scores across 3 experiments . . . 30
3-2 Effects of context on memorability . . . 33
3-3 Difference in memorability scores between AMT 1 and AMT 2 . . . . 35
3-4 A scene classifier evaluated on images affected by context . . . 38
3-5 Images most and least affected by context . . . 39
4-1 Sample eyetracking experimental sequence . . . 43
4-2 Discriminating successful from unsuccessful encoding fixations . . . . 45
4-3 Classifying whether an image will be remembered . . . 48
4-4 Automatically sorting images by predictability . . . 49
5-1 Sample of target images for pupil experiments . . . 53
5-2 Memorability and response time across lags . . . 54
5-3 Pupil size and blink rate as a function of memorability . . . 56
6-1 The most and least memorable visualizations . . . 62
6-2 The memorability of different visualization attributes . . . 63
6-3 The memorability of different visualization types . . . 64
6-4 Most memorable visualizations per publication source . . . 65
List of Tables
2.1 FIGRIM dataset statistics for AMT 1 experiment . . . 21
3.1 FIGRIM dataset statistics for AMT 2 experiment . . . 28
3.2 Image distinctiveness (in AMT 1) correlated with multiple memorabil-ity measurements . . . 32
3.3 Image distinctiveness (in AMT 2) correlated with multiple memorabil-ity measurements . . . 32
3.4 Context entropy correlated with multiple memorability measurements 34 3.5 Change in contextual distinctiveness correlated with multiple memo-rability measurements . . . 34
3.6 Change in context entropy correlated with multiple memorability mea-surements . . . 36
6.1 Sources used for MASSVIS dataset . . . 60
6.2 Attributes for labeling information visualizations . . . 60
Chapter 1
Introduction
This thesis lies at the intersection of the computational and psychological sciences, containing many novel findings about image memorability, from human experiments conducted both online and in the lab, and from computational models. Image mem-orability, pioneered by the Oliva Lab [30, 31, 29, 38, 3, 9, 37, 36, 16, 61], is an objective and quantifiable measure of an image that is independent of the observer and can be computationally predicted. Thus, image memorability is driven by intrin-sic features in an image that dictate how memorable or forgettable an image will be across a population. However, extrinsic effects like the experimental context in which an image appears, or how attentive an individual is while looking at an image, can modulate the memorability of an image to finally determine whether an image will be remembered or forgotten on a particular trial. These extrinsic effects are quantified and modeled in this thesis.
Here we build on the initial work in image memorability conducted by [30, 31, 29, 3] who first showed that memorability is an intrinsic property of images, independent of observer. The consistency across people as to which images are remembered and which forgotten allows memorability to be a property that can be computationally estimated from images, and thus opens up the doors to computational applications, from educational material to promotional material, visual design, and human com-puter interfaces. In order to make these applications possible, a good understanding of what drives and impacts image memorability is thus crucial.
The work that is described in this thesis is motivated by a number of questions that have been prompted by previous studies of memorability, including:
1. How generalizable are the findings about the consistency of human visual mem-ory?
2. How do extrinsic effects such as context and observer differences affect image memorability?
3. How quickly do differences in memorability become apparent, and how is mem-orability modulated by time?
4. Can physiological measurements be used to predict memorability, without the need for explicit (overt) responses from human participants?
This thesis is an attempt to answer these questions. In Chapter 2, we show that human consistency at remembering and forgetting images holds at a within-category level - a finer grained level than previously found. We show that intrinsic memorability generalizes also to information visualizations - an entirely different form of visual imagery (Chapter 6).
In Chapters 3 and 4, we show how the extrinsic effects of context and observer dif-ferences, correspondingly, modulate the intrinsic memorability of images. We present an information-theoretic framework to quantify context differences and image dis-tinctiveness using state-of-the-art computer vision features, and we show correlations with image memorability scores. We discuss where context has the greatest effect on memorability (Chap. 3), and show how the images that are most distinct relative to their image context are also the most memorable. In Chapter 6 we also hint at dis-tinctiveness being a factor influencing the memorability of information visualizations. Moreover, we demonstrate how physiological measurements, including eye move-ments (Chap. 4), pupils (Chap. 5), and blinks (Chap. 5) can be predictive of memorability. Specifically, in Chapter 4 we present a computational model that, given an individual’s eye movements on an image, can predict with reasonable ac-curacy whether the individual will remember the image at a later point in time. In
other words, without explicit responses from a user, it is already possible to determine if an image has been successfully encoded into memory using eye movements as an indicator of how much attention was paid to the image.
In Chapter 5, we show that pupils dilate more, and blinks decrease, when retrieving less memorable images than when retrieving more memorable images (due, likely, to differences in cognitive effort). We demonstrate how these effects change over time by varying the lags at which images and their repeats occur. Additionally, we show that differences in memorability are already apparent at the shortest lag (only 20 seconds after image presentation), and become even more pronounced at later lags (Chap. 5). Some of the computational applications made possible by this research are outlined in Chapters 6 and 7. The robustness and predictability of memorability, as well as the ability to use automatic, physiological measurements (such as eye movements, pupils, and blinks) to measure a higher-level cognitive process such as memory puts power at the hands of the application designer.
Chapter 2
Understanding Intrinsic Effects on
Memorability
Does human consistency in image memorability generalize to finer-grained scene cat-egories? Do people remember and forget the same images in different catcat-egories?1
2.1
Related work
Recent work in image memorability [30, 31, 29, 3] has reported high consistency rates among participants in terms of which images are remembered and which forgotten, indicating that memorability is a property that is intrinsic to the image, despite individual differences between observers. The high consistency was first demonstrated for a database of images from hundreds of scene categories [31], and later shown to extend to narrower classes of images - faces [3]. To show that this consistency is not a special property of face stimuli but holds more generally, here we replicate this result across 21 separate natural scene experiments, each consisting of hundreds of instances of a single scene category (both indoor and outdoor). This is the first image memorability study to consider fine-grained scene categories. We further extend these findings and show they continue to hold for an entirely different visual domain - information visualizations - in Chapter 6.
2.2
FIGRIM (Fine-Grained Image Memorability) dataset
For our studies, we constructed the FIne-GRained Image Memorability (FIGRIM) dataset. We created this novel dataset by sampling high-resolution (at least 700× 700𝑝𝑥) images from 21 different indoor and outdoor scene categories from the SUN Database [67]. We chose all SUN scene categories with at least 300 images of the required dimensions. Image duplicates and near-duplicates were manually removed2. The images were downsampled (to avoid introducing resolution discrepancies), and cropped to 700×700𝑝𝑥3. From each scene category, 25% of the images were randomly chosen to be targets and the rest of the images became fillers (table 2.1 lists the number of targets and fillers per scene category). The targets are the images for which we obtained memorability scores. Sample dataset images are provided in Fig. 2-2.
We are publicly releasing the full FIGRIM dataset4 with a range of popular image features (including Gist and convolutional neural net features) precomputed for all 9𝐾 images of the dataset, as well as memorability scores for each of the 1754 target images. For the target images, we provide separate memorability scores for the image presented in the context of its own scene category (discussed in Chap. 2) and different scene categories (discussed in Chap. 3). Additionally, for the collection of 630 target images used for our eyetracking experiments (discussed in Chap. 4), we are providing the eyetracking data and responses of a total of 42 participants (16.2±1.6 participants per image).
2.3
Crowdsourcing (within-category) experiment AMT 1
We ran Amazon Mechanical Turk (AMT) studies following the protocol of Isola et al. [31] to collect memorability scores (i.e. performance on a recognition memory task) for each of the scene categories, separately. We set up memory games on AMT
2We calculated the Gist descriptor [47] of each image, displayed its 5 nearest neighbors, and
removed identical copies and near-duplicates. Some remaining duplicates were removed after post-processing the experimental data.
3Images were later resized to 512
× 512𝑝𝑥 to fit comfortably in browser windows for the online
AMT experiments (Chap. 2-3), and to1000× 1000𝑝𝑥 for the eyetracking experiments (Chap. 4).
4
category targets fillers datapts HR (%) FAR (%) HR FAR per target cons. (𝜌) cons. (𝜌)
amusement 68 296 64.2 10.2 0.85 0.80 84.8 park (SD: 15.5) (SD: 9.7) (SD: 0.3) (SD: 0.3) (SD: 3.2) playground 74 330 63.3 14.7 0.78 0.84 86.4 (SD: 14.4) (SD: 12.7) (SD: 0.4) (SD: 0.3) (SD: 2.7) bridge 60 260 61.2 13.2 0.77 0.84 90.2 (SD: 13.2) (SD: 12.0) (SD: 0.4) (SD: 0.2) (SD: 4.4) pasture 60 264 59.2 11.5 0.86 0.83 86.2 (SD: 17.5) (SD: 9.5) (SD: 0.3) (SD: 0.4) (SD: 3.7) bedroom 157 652 58.9 13.5 0.77 0.81 84.5 (SD: 14.7) (SD: 10.9) (SD: 0.2) (SD: 0.2) (SD: 3.9) house 101 426 58.0 14.4 0.73 0.80 82.7 (SD: 13.3) (SD: 10.3) (SD: 0.3) (SD: 0.3) (SD: 3.7) dining 97 410 57.8 14.1 0.77 0.79 83.8 room (SD: 13.6) (SD: 10.8) (SD: 0.4) (SD: 0.3) (SD: 2.8) conference 68 348 57.1 12.5 0.77 0.80 85.2 room (SD: 13.7) (SD: 8.8) (SD: 0.4) (SD: 0.3) (SD: 3.3) bathroom 94 398 57.1 16.3 0.73 0.82 86.6 (SD: 12.8) (SD: 13.9) (SD: 0.4) (SD: 0.3) (SD: 3.4) living 138 573 56.9 14.4 0.77 0.73 81.2 room (SD: 14.1) (SD: 9.6) (SD: 0.3) (SD: 0.3) (SD: 2.7) castle 83 389 56.4 12.8 0.87 0.77 91.5 (SD: 17.2) (SD: 8.9) (SD: 0.2) (SD: 0.4) (SD: 3.3) kitchen 120 509 56.2 16.8 0.74 0.80 80.5 (SD: 14.0) (SD: 10.7) (SD: 0.3) (SD: 0.2) (SD: 3.5) airport 75 323 55.6 14.9 0.76 0.86 95.9 terminal (SD: 13.6) (SD: 10.8) (SD: 0.3) (SD: 0.2) (SD: 3.7) badlands 59 257 52.9 15.6 0.82 0.90 80.1 (SD: 20.3) (SD: 15.1) (SD: 0.3) (SD: 0.2) (SD: 7.0) golf course 88 375 52.9 15.2 0.84 0.77 80.2 (SD: 17.6) (SD: 9.9) (SD: 0.3) (SD: 0.2) (SD: 3.9) skyscraper 62 271 52.8 13.5 0.85 0.76 84.4 (SD: 17.0) (SD: 10.6) (SD: 0.3) (SD: 0.3) (SD: 4.3) tower 86 376 52.7 18.9 0.75 0.83 82.2 (SD: 14.3) (SD: 13.0) (SD: 0.4) (SD: 0.3) (SD: 3.0) lighthouse 56 247 52.1 15.2 0.78 0.88 90.3 (SD: 15.2) (SD: 12.4) (SD: 0.4) (SD: 0.2) (SD: 4.3) mountain 69 302 50.2 14.9 0.87 0.83 79.3 (SD: 21.7) (SD: 11.7) (SD: 0.2) (SD: 0.2) (SD: 2.9) highway 71 348 50.0 15.0 0.69 0.85 85.9 (SD: 12.9) (SD: 10.4) (SD: 0.5) (SD: 0.3) (SD: 4.6) cockpit 68 320 49.5 18.2 0.70 0.88 80.6 (SD: 17.2) (SD: 14.7) (SD: 0.5) (SD: 0.2) (SD: 3.5) Table 2.1: FIGRIM dataset statistics for AMT 1 (within-category), with a total of 1754 target and 7674 filler images. The HR and FAR scores are computed over the targets, for which we have an average of 85 experimental datapoints per image. The average HR across all the scene categories is 56.0% (𝑆𝐷 : 4.2%), and the average FAR is 14.6% (𝑆𝐷 : 2.0%).
1.0 s
... ...
1.4 s
time
false alarm
correct rejection hit
repeat
+ +
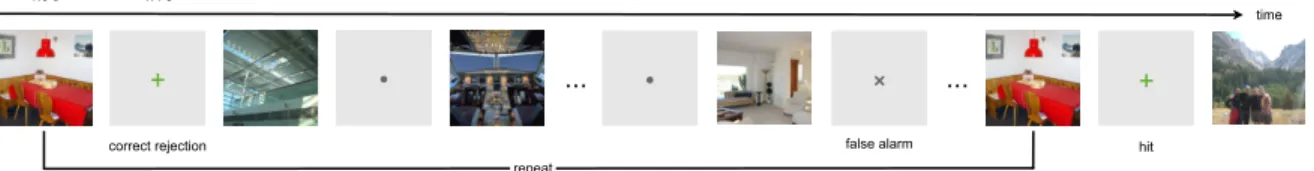
Figure 2-1: An example AMT experimental sequence. During image presentation, the partic-ipant presses a key if the image has already appeared in the sequence, and receives feedback at the end of the image presentation. A false alarm occurs when on first presentation, the participant indicates that the image has repeated. No key press during first presentation is recorded as a correct rejection. A hit occurs when a repeated image is correctly remembered, and otherwise, the response is recorded as a miss.
where sequences of 120 images (a mix of target and filler images sampled from a single scene category) were presented for 1 second each, with a distance of 91-109 images between an image and its repeat, and consecutive images separated by a fixation cross lasting 1.4 seconds. Images and repeats occurred on average 4.5 minutes apart, thus allowing us to capture memory processes well beyond short-term and working memory. Some filler images repeated at much shorter intervals of 1-7 images and were used as vigilance tests to recognize when a participant wasn’t paying attention to the game5. Participants were instructed to press a key when they detected an image repeat, at which point they received feedback. No image repeated more than once. Participants could complete multiple memory games, since we ensured that a different set of images was presented each time. Figure 2-1 depicts an example experimental sequence.
2.4
Memorability scores and comparison to other experiments
On average, 80 workers saw each target image and its repeat (see table 2.1 for a complete breakdown), providing us with enough data points per image to collect reliable statistics about the memorability of each image. We define a hit to be a correct response to an image presented for the second time. A miss is when an image was repeated, but not recognized. False alarms and correct rejections are
5Vigilance repeats also occurred at the very beginning of the game, within the first 100 images
incorrect and correct responses (respectively) to target images shown for the first time. We define hit rate (HR) and false alarm rate (FAR):
HR(I) = hits(I)
hits(I) + misses(I)× 100% (2.1)
FAR(I) = false alarms(I)
false alarms(I) + correct rejections(I) × 100% (2.2) We also define HR and FAR to be category averages - computed over all images belonging to a single category. The HR scores vary from 49.5% to 64.2% (𝑀 = 56.0%, 𝑆𝐷 = 4.2%)6. FAR scores vary between 10.2% and 18.9% (𝑀 = 14.6%, 𝑆𝐷 =
2.0%), following a partial mirror effect [20, 64], where high HR are often accompanied by low FAR. The Spearman rank correlation between the HR and FAR scores is−0.66 (𝑝 < 0.01). Individual scores for all the categories can be found in table 2.1, and for comparison, memorability scores from other experiments are included in table 7.1. For instance, scene categories with lower memorability scores have similar performances to experiments with face stimuli [3] and data visualizations (see Chap. 6 or [9]). Lower variability across the stimuli in these categories could lead to lower scores (see Chap. 3, Sec. 3.5 for the possible reason). By the same token, scene categories with higher memorability scores have similar memory performances as the experiments with hundreds of scenes [31], likely due to larger variability across stimuli.
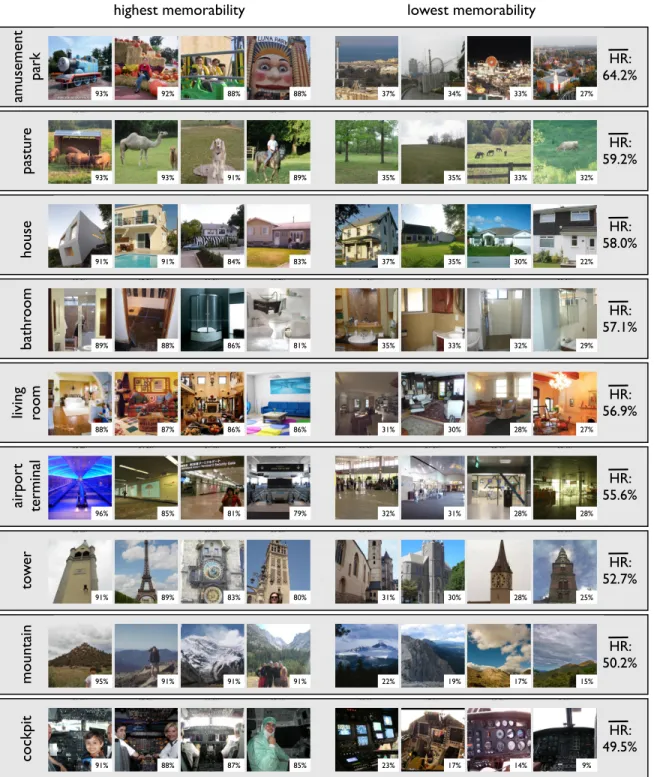
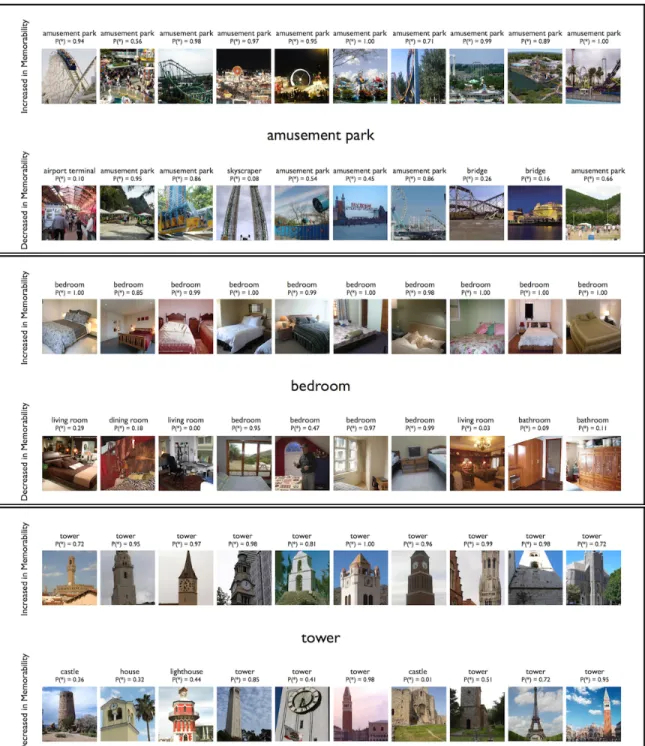
Figure 2-2 includes a sample of some of the most memorable and forgettable images in a few FIGRIM categories. The most memorable categories are amusement parks and playgrounds, scenes consisting of a large variety of objects in different configurations, and often containing people. Interestingly, 8/9 of the indoor categories are in the top 13 most memorable scene categories (the last indoor category, cockpits is the least memorable category overall). Qualitatively, the most memorable instances across categories tend to contain people, animals, text, and objects like cars and flags. Overall, memorable images tend to be distinct from the other images in their category – they may have unusual objects, layouts, or perspectives. This latter point will be quantified in Chapter 3.
92.9% 92.1% 88.1% 87.6% 36.8% 33.8% 33.0% 27.4%
88.1% 86.6% 86.1% 86.1% 31.2% 30.5% 27.5% 26.9%
93.3% 93.3% 90.8% 88.9% 35.3% 34.7% 33.0% 31.9%
90.9% 88.8% 82.9% 80.0% 30.9% 30.4% 27.7% 25.0%
highest memorability lowest memorability
mo unta in to w er livi ng ro om pa stur e am us ement pa rk HR: 64.2% HR: 59.2% HR: 50.2% HR: 56.9% HR: 52.7% 84.8% 81.4% 78.8% 95.7% 32.3% 31.2% 28.4% 28.4% HR: 55.6% ai rpo rt termi na l 91.5% 91.0% 83.5% 83.1% 36.6% 35.4% 29.9% 22.4% ho us e HR: 58.0% 91.5% 87.5% 86.9% 85.4% 22.9% 17.1% 13.5% 9.0% co ckpi t HR: 49.5% 94.9% 91.4% 91.4% 91.2% 21.8% 18.8% 17.1% 15.5% 88.8% 87.5% 86.2% 80.7% ba thr oo m 34.8% 32.6% 32.1% 29.3% HR: 57.1% 93% 92% 88% 88% 37% 34% 33% 27% 32% 33% 35% 35% 89% 91% 93% 93% 91% 91% 84% 83% 37% 35% 30% 22% 29% 32% 33% 35% 81% 86% 88% 89% 88% 87% 86% 86% 31% 30% 28% 27% 28% 28% 31% 32% 79% 81% 85% 96% 91% 89% 83% 80% 31% 30% 28% 25% 15% 17% 19% 22% 91% 91% 91% 95% 91% 88% 87% 85% 23% 17% 14% 9%
Figure 2-2: A sample of the most memorable and forgettable images from 9 of the 21 categories in the FIGRIM dataset, sorted from most to least memorable category, with the HR per category reported. Inset are the HR scores of the individual images.
2.5
Some scene categories are intrinsically more memorable
How consistent is the relative ranking (the ordering in table 2.1) of the scene cate-gories? For instance, if we select a different subset of images, is the average memo-rability of the amusement park images still going to be at the top? We took half the images from each category, and computed the HR scores for all the categories. We also computed the HR scores for the other half of the images in all the categories. Over 25 such half-splits, the rank correlation between these 2 sets of HR scores was 0.68 (with significant 𝑝-values). Thus, the relative memorability of the scene cat-egories is stable, and some scene catcat-egories are intrinsically more memorable than others.
2.6
Within categories, some images are intrinsically more
mem-orable
Previous studies have demonstrated that memorability is consistent across participant populations for a general set of scene images (HR: 𝜌 = 0.75, FAR: 𝜌 = 0.66) [31] and for the specific classes of faces (HR: 𝜌 = 0.68, FAR: 𝜌 = 0.69) [3]. Here we show that this also holds at a fine-grained level across very different categories of scenes, thereby both replicating and extending previous results.
The consistencies of the image memorability scores were measured separately for each of the scene categories (see table 2.1). This was done by splitting the participants of AMT 1 into two independent groups, computing the memorability scores of images based on the participants in each group separately, ranking the images according to the memorability scores, and computing the Spearman rank correlation between the two possible rankings. Results are averaged over 25 such half-splits of the participant data. For all of the scene categories, consistency of HR scores ranges from 0.69 to 0.86 and from 0.79 to 0.90 for FAR scores. These high values demonstrate that memorability is a consistent measure across participant populations, indicating real differences in memorability across images.
Chapter 3
Computationally Modeling Context
Effects on Memorability
How can image distinctiveness be quantified for natural images? How does context affect image memorability? When does context matter most?1
3.1
Related work
Previous studies have suggested that items that stand out from (and thus do not compete with) their context are better remembered [39, 50, 63, 27, 53, 17, 66, 56, 2, 65]. For instance, Standing observed a large long-term memory capacity for images that depict oddities [56]. Konkle et al. demonstrated that object categories with conceptually distinctive exemplars showed less interference in memory as the number of exemplars increased [39]. Additionally, for the specific categories of face images, studies have reported that a distinctive or atypical face (i.e., a face distant from the average) is more likely to be remembered [4, 13, 59]. Nevertheless, recent work on predicting image memorability [31, 29, 38] has largely ignored the effects of image context (the set of images from which the experimental sequence is sampled) on memory performance, instead focusing on the modeling of intrinsic image features.
Here, we are able to rigorously quantify, using a large-scale natural scene database,
category targets fillers datapts HR (%) FAR (%) HR FAR per target cons. (𝜌) cons. (𝜌) 21 scenes 1754 7296 74.3 66.0 11.1 0.74 0.72
(SD: 7.5) (SD: 13.9) (SD: 9.5) (SD: 0.2) (SD: 0.1) Table 3.1: FIGRIM dataset statistics for AMT 2 (across-category). The targets are the same for AMT 1 and AMT 2. The difference in the number of fillers between AMT 1 and AMT 2 is accounted for by demo images that were presented to participants at the beginning of each experiment, and are included with the fillers. Each category in AMT 1 had 20 demo images, while AMT 2 had a total of 42 demo images, sampled from all the categories.
the observation that images that are unique or distinct with respect to their image context are better remembered. We steer away from subjective human ratings, and instead compute statistics over automatically-extracted computer vision features. By systematically varying the image context across experiments (AMT 1 and AMT 2), we are able to computationally model the change in context at the feature level, and predict corresponding changes in image memorability.
3.2
Crowdsourcing (across-category) experiment AMT 2
We ran another AMT study on the combined target and filler images across all the scene categories, and collected a new set of memorability scores, following the same protocol as before (see Chap. 2, Sec. 2.3). The dataset statistics are provided in table 3.1. The average memorability scores for this experiment are: HR: 𝑀 = 66.0%, 𝑆𝐷 = 13.9%, FAR: 𝑀 = 11.1%, 𝑆𝐷 = 9.5%. Per-image memorability scores correlate strongly with those measured in the within-category experiment AMT 1 (Spearman 𝜌 = 0.60 for HR and 𝜌 = 0.75 for FAR), demonstrating that the intrinsic memorability of images holds across different image contexts.
3.3
In-lab control experiment
We selected a subset of the target images from the AMT experiments in order to verify replicatability of the online data using in-lab experiments. From each scene category from AMT 1 we obtained the 15 target images with the highest and 15 with the lowest memorability scores. This was done to capture the range of memorabilities
of images in each of the scene categories. These 630 images became the targets for our in-lab experiments. We recruited 20 participants for our experiments.
An experimental sequence was composed of about 1000 images, of which 210 were targets that repeated exactly once in the sequence, spaced 91-109 images apart. Images in the test sequence were presented for 2 sec, separated by a fixation cross lasting 0.5 sec. Participants were instructed to respond (by pressing the spacebar) anytime they noticed an image repeat in the sequence, at which point they would receive feedback. In a single experimental session, the targets consisted of 30 images taken from each of 7 randomly selected scene categories, making up a total of 210 targets. The filler images were chosen in equal proportions from the same set of scene categories as the targets. Participants could choose to complete up to 3 sessions (each with a disjoint set of 7 categories) on separate days. The memorability scores for the in-lab experiment are HR: 𝑀 = 64.9%, 𝑆𝐷 = 21.3%, FAR: 𝑀 = 6.0%, 𝑆𝐷 = 8.9%.
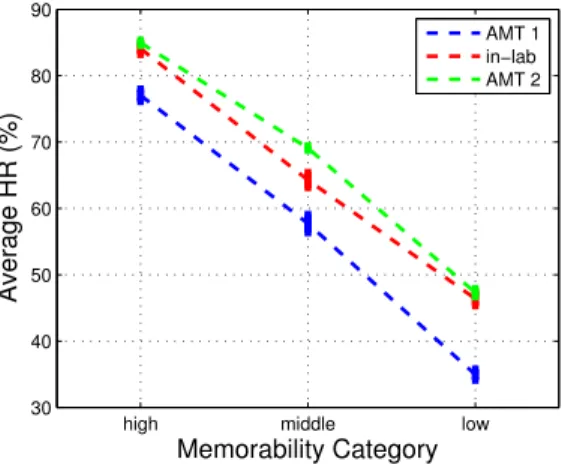
Note that by changing the number of scene categories in an experiment (from 1 in AMT 1, to 7 in this in-lab experiment, to 21 in AMT 2), we are also increasing the variability of the experimental image context. To demonstrate the effect of number of scene categories on memorability, we sorted the HR scores of the overlapping targets in all 3 experiments by the scores of AMT 2 and binned them into high, middle, and low memorability. In figure 3-1, as the number of scene categories increases, the overall memorability scores of all the images in the experiment also increase (even for the least memorable images). At the same time, the difference between the (high, middle, low) memorability bins remains statistically significant, indicating that some images are intrinsically more memorable and others forgettable.
The rank correlation of the HR scores for the 630 target images used in the in-lab experiment with the scores for the same images in AMT 1 is 0.75, and with AMT 2 is 0.77. Thus, across all 3 of the experiments (two online, one in-lab), the relative rank-ing of these target images are highly consistent, providrank-ing further evidence that image memorability is to a large extent an intrinsic property of images that holds across different populations of human participants, different image contexts, and different experimental settings.
high middle low 30 40 50 60 70 80 90 Memorability Category Average HR (%) AMT 1 in−lab AMT 2
Figure 3-1: Memorability scores for images in the context of 21 scenes (AMT 2) are higher than in the context of 7 scenes (in-lab), and higher still than in the context of 1 scene (AMT 1). At the same time, the most memorable images remained the most memorable, and the most forgettable remained the most forgettable. Standard error bars have been plotted.
3.4
Contextually distinct images are more memorable
We call images contextually distinct if they are distinct with respect to their image context (the set of images from which the experimental sequence is sampled). To model context effects, we first estimate the probability distribution over features in an image’s context. Then we define the distinctiveness of the image as the probability of its features under this distribution. We consider two different contexts: (a) within-category context composed of images from a single within-category (AMT 1), and (b) across-category context composed of images from all categories (AMT 2). To estimate the probability distribution of features in the context, we use kernel density estimation [28].
For each image 𝐼, we compute a feature vector 𝑓𝑖 = 𝐹 (𝐼), where 𝐹 can be any
feature mapping. We model the probability of features 𝑓𝑖 appearing in image context
C as: 𝑃𝑐(𝑓𝑖) = 1 ‖𝐶‖ ∑︁ 𝑗∈𝐶 𝐾(𝑓𝑖− 𝑓𝑗) (3.1)
where 𝐾 can be any kernel function, and‖𝐶‖ indicates the size of the context, mea-sured in number of images. We use an Epanechnikov kernel and
leave-one-out-cross-validation to select the kernel bandwidth. We tried a number of features2 (see Tables 3.2 and 3.3), but found that scene-based CNN features worked best, and that is the feature space we use for the rest of this chapter. The features come from a convolu-tional neural network (CNN), a popular feature space recently shown to outperform other features in computer vision [41, 51]. Specifically, we used the Places-CNN from [69] trained to classify scene categories. We took the 4096-dimensional features from the response of the Fully Connected Layer 7 (𝑓 𝑐7) of the CNNs, which is the final fully-connected layer before producing class predictions. We then reduced this feature vector to 10 dimensions using PCA. This was found to prevent overfitting and increase efficiency in estimating the kernel densities. Note that in contrast to simple visual descriptors like Gist, the deep features are trained to predict image semantics, and this may account for some of the performance boost.
In figure 3-2a, we correlate the memorability score of an image, HR(𝐼), with its distinctiveness with respect to the image context, 𝐷(𝐼; 𝐶). Mathematically, we define3:
𝐷(𝐼; 𝐶) =− log 𝑃𝑐(𝑓𝑖) (3.2)
Furthermore, we denote 𝐶2 as the across-category context of AMT 2, and 𝐶1 as the
within-category context of AMT 1. We find that 𝐷(𝐼; 𝐶2) is positively correlated
with HR(𝐼) (Pearson 𝑟 = 0.24, 𝑝 < 0.01), as plotted in 3-2a. The correlation also holds when images are compared to images within the same category (correlation between 𝐷(𝐼; 𝐶1) and HR(𝐼) is 𝑟 = 0.26, 𝑝 < 0.01). Thus, more contextually distinct
images are more likely to be memorable. We present the same correlations according to some alternative measurements of memorability (definitions provided in Appendix A) in Tables 3.2 and 3.3.
2The object-based CNN features come from a pre-trained model from Caffe available at http:
//caffe.berkeleyvision.org tuned to perform object classification [33]. The Gist features, as defined in [47], are calculated using the LabelMe Toolbox available at http://labelme.csail.mit. edu/Release3.0/browserTools/php/matlab_toolbox.php [52].
feature space HR FAR ACC MI DPRIME GIST 0.12 (𝐻𝑆) -0.19 (𝐻𝑆) 0.21 (𝐻𝑆) 0.21 (𝐻𝑆) 0.19 (𝐻𝑆) object-based CNN 0.19 (𝐻𝑆) -0.14 (𝐻𝑆) 0.22 (𝐻𝑆) 0.22 (𝐻𝑆) 0.20 (𝐻𝑆) scene-based CNN 0.26 (𝐻𝑆) -0.26 (𝐻𝑆) 0.35 (𝐻𝑆) 0.36 (𝐻𝑆) 0.34 (𝐻𝑆) Table 3.2: 𝐷(𝐼; 𝐶) of images (𝐶 = AMT 1) correlated with different memorability measure-ments. Here, 𝐻𝑆 = significant at the 𝑝 = 0.01 level.
feature space HR FAR ACC MI DPRIME
GIST 0.12 (𝐻𝑆) -0.01 (𝑁 𝑆) 0.12 (𝐻𝑆) 0.11 (𝐻𝑆) 0.11 (𝐻𝑆) object-based CNN 0.13 (𝐻𝑆) -0.05 (𝑆) 0.15 (𝐻𝑆) 0.12 (𝐻𝑆) 0.12 (𝐻𝑆) scene-based CNN 0.24 (𝐻𝑆) -0.17 (𝐻𝑆) 0.32 (𝐻𝑆) 0.33 (𝐻𝑆) 0.32 (𝐻𝑆) Table 3.3: 𝐷(𝐼; 𝐶) of images (𝐶 = AMT 2) correlated with different memorability measure-ments. Here, 𝐻𝑆 = significant at the 𝑝 = 0.01 level, 𝑆 = significant at the 𝑝 = 0.05 level, 𝑁 𝑆 = not significant.
3.5
More varied image contexts are more memorable overall
We also measure the context entropy by averaging 𝐷(𝐼; 𝐶) over all the images in a given image context. This is just the information-theoretic entropy:
𝐻(𝐶) = E𝑐[𝐷(𝐼; 𝐶)]
= E𝑐[− log 𝑃𝑐(𝑓𝑖)]
(3.3)
Here, E𝑐 is just expectation over the image context specified by 𝐶. As in figure
3-2b, the Pearson correlation between 𝐻(𝐶) and 𝐻𝑅 = E𝑐[HR(I)], is 𝑟 = 0.52 (𝑝 =
0.01) - and more results provided in Table 3.4. Thus, categories that contain many contextually distinct images are more memorable overall. For instance, the mountain category contains a relatively stable collection and configuration of scene elements: mountains and sky. The amusement park category, however, consists of a much larger variability of images: images of roller-coasters, concession stands, or other rides, consisting of different elements. Thus entropy in feature space can explain some of the differences in average HR we observe across categories in AMT 1.
HR (I ) D(I; C) D(I; C2) D(I; C1) HR c2 (I ) HR c1 (I ) H(C) HR HR C2 HR C1 KL(Pc1kPc2) (a) (b) (c) (d)
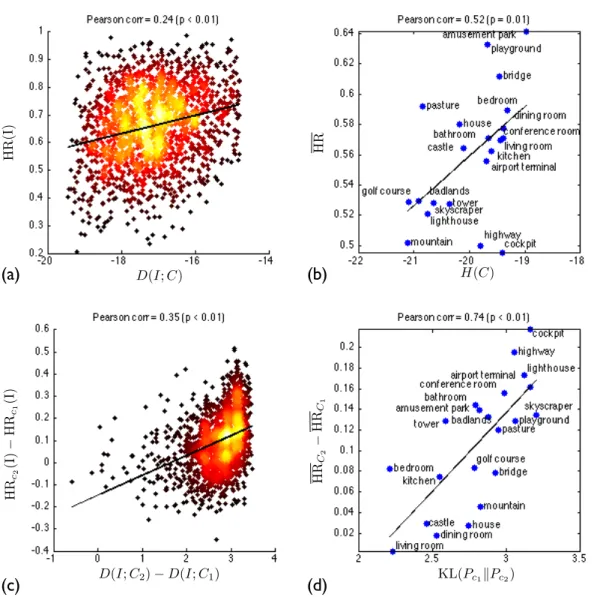
Figure 3-2: The effects of context on memorability. In figures (a) and (c), each dot is a single target image from the FIGRIM dataset, for a total of 1754 images. Brighter coloring represents a greater density of points. In figures (b) and (d), all images in a given category are collapsed into a single summary number. The trends we see are: (a) Images are more memorable if they are less likely (more contextually distinct) relative to the other images in the same image context; (b) Image contexts that are more varied (have larger entropy) lead to higher memorability rates overall; (c) Images that become more distinct relative to a new context become more memorable; (d) Scene categories that are more distinct relative to other categories become more memorable in the context of those other categories.
feature space HR FAR ACC MI DPRIME GIST 0.48 (𝑆) -0.23 (𝑁 𝑆) 0.34 (𝑁 𝑆) 0.35 (𝑁 𝑆) 0.36 (𝑁 𝑆) object-based CNN 0.51 (𝑆) -0.29 (𝑁 𝑆) 0.34 (𝑁 𝑆) 0.38 (𝑁 𝑆) 0.32 (𝑁 𝑆) scene-based CNN 0.52 (𝑆) -0.16 (𝑁 𝑆) 0.28 (𝑁 𝑆) 0.37 (𝑁 𝑆) 0.34 (𝑁 𝑆) Table 3.4: 𝐻(𝐶) of images in AMT 1 (within-category) correlated with different memora-bility measurements.
feature space HR FAR ACC MI DPRIME RANK
GIST 0.24 (𝐻𝑆) 0.10 (𝐻𝑆) 0.15 (𝐻𝑆) 0.10 (𝐻𝑆) 0.12 (𝐻𝑆) 0.10 (𝐻𝑆) object-based CNN 0.32 (𝐻𝑆) 0.00 (𝑁 𝑆) 0.25 (𝐻𝑆) 0.21 (𝐻𝑆) 0.24 (𝐻𝑆) 0.15 (𝐻𝑆) scene-based CNN 0.35 (𝐻𝑆) 0.00 (𝑁 𝑆) 0.29 (𝐻𝑆) 0.25 (𝐻𝑆) 0.28 (𝐻𝑆) 0.14 (𝐻𝑆) Table 3.5: Change in contextual distinctiveness between AMT 1 and AMT 2 correlated with different memorability measurements.
3.6
Modeling image memorability as a function of image
con-text
AMT experiments 1 and 2 systematically vary the context for images, while keep-ing the images constant. This allows us to isolate the effects of context from other possible confounds4. To model the change in context, we compute the difference in
the distinctiveness of an image relative to its own scene category versus all scene categories. In figure 3-2c we see that changing the context of an image to make it more distinct relative to the other images in its context, increases its memorability. The Pearson correlation between 𝐷(𝐼; 𝐶2)− 𝐷(𝐼; 𝐶1) and HR𝐶2(𝐼) - HR𝐶1(𝐼) is 0.35
(𝑝 < 0.01) with more results provided in Table 3.5.
We can also consider change in memorability at the category level. In figure 3-3 we see that across all categories, HR for each category goes up in the context of images from other categories. However, how much change there is in image memorability when we switch contexts depends on the scene category.
How does a scene category’s memorability change when the category is combined with other categories? We measure this change in context as the Kullback—Leibler
4Spurious correlations are possible when both contextual distinctiveness and memorability
cor-relate with a third causal factor, but when we systematically change the context while keeping everything else fixed (particularly, the experimental images), we can isolate the effects of context alone.
0.45 0.5 0.55 0.6 0.65 0.7 0.75 0.8
Scene Categories (sorted by difference in scores)
Average HR (%)
living roomdining room
housecastle
mountainkitchenbridgebedroom
golf course
pasturetower
playgroundbadlandsskyscraper
amusement park bathroom
conference roomairport terminal
lighthousehighwaycockpit
AMT1 AMT2
Figure 3-3: The average memorability of the images in each scene category went up when images were presented in the context of images from other scene categories (AMT 2) com-pared to when they were presented only in the context of images from the same category (AMT 1).
divergence between the density functions computed over contexts 𝐶1 and 𝐶2 as:
KL(𝑃𝑐1||𝑃𝑐2) = E𝑐1[− log 𝑃𝑐2(𝑓 )]− E𝑐1[− log 𝑃𝑐1(𝑓 )] (3.4)
The first term is the probability of the images in a category under the context of AMT 2, and the second term is the probability of the images under its own category in AMT 1. Intuitively, this measures how much more (or less) likely a category’s images are under the context of AMT 2 compared to that of AMT 1. In figure 3-2d, the Pearson correlation between the change in context entropy and change in memorability is 𝑟 = 0.74 (𝑝 < 0.01) with more results provided in Table 3.6.
Consider the cockpit category: many of the cockpit images look the same when viewed only with other cockpits; however, when mixed with images from other scenes, they become very distinct: there is no other scene category with similar images. Compare this with dining rooms that can also look like living rooms and kitchens,
feature space HR FAR ACC MI DPRIME GIST 0.64 (𝐻𝑆) 0.41 (𝑁 𝑆) 0.47 (𝑆) 0.39 (𝑁 𝑆) 0.41 (𝑁 𝑆) object-based CNN 0.55 (𝑆) 0.24 (𝑁 𝑆) 0.35 (𝑁 𝑆) 0.46 (𝑆) 0.47 (𝑆)
scene-based CNN 0.74 (𝐻𝑆) 0.44 (𝑆) 0.51 (𝑆) 0.50 (𝑆) 0.60 (𝐻𝑆) Table 3.6: Change in context entropy between AMT 1 and AMT 2 correlated with different memorability measurements.
and thus are not as visually distinct when combined with images from these other scene categories.
3.7
When context matters most
To better understand when context matters most, consider the images that were memorable with respect to their own category, but became more forgettable when combined with other categories. In figure 3-4, we can see that these images tend to look different from other images in their category, and are more similar to images of other categories. These images may have been more memorable in the first place because they stood out from other images in their category. They no longer stand out when combined with other categories.
To quantify this intuition, we mapped the Places-CNN deep features to category labels by training a linear multi-class SVM on the filler images of the FIGRIM dataset with labels of 21 scene categories. We then evaluated our classifier on the target images of the FIGRIM dataset to automatically predict the most likely scene category for each image (the overall scene classification accuracy was 91.56%). These predicted category labels are included with each image in fig. 3-4. Notice that for the images that decreased in memorability, more of the predicted labels come from other categories. Compare this to the images that increased in memorability when combined with other categories - they are more likely to be correctly classified.
We can also consider the probability, under the scene classifier, of the correct category label. These probabilities are included with each image in fig. 3-4. Images with a higher probability value are more typical examples of their scene category. Across all 1754 target images, the Pearson correlation between the probability of the
correct category label and the change in memorability due to context (from AMT 1 to AMT 2) is 𝑟 = 0.30 (𝑝 < 0.01). In other words, the images least likely to belong to their own category experience the greatest drop in memorability when they are combined with images of other categories.
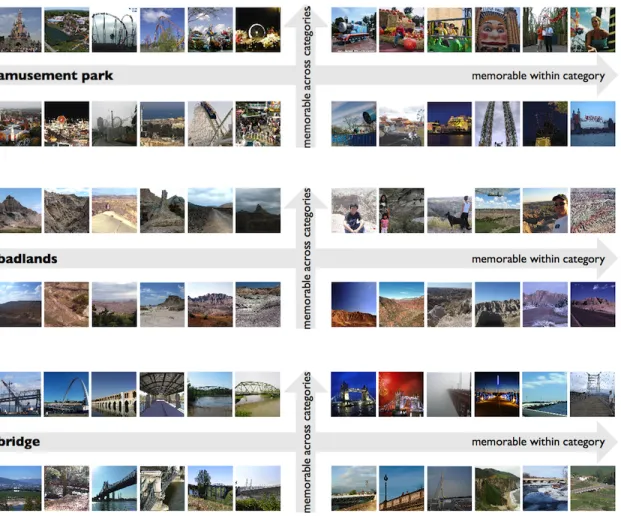
Which images remain memorable within and across categories? It is the images that will look distinct enough from the other images in their category, but will not look like images from other categories either. Consider the images in the top right quadrant in figure 3-5. These are images that are memorable across contexts. Take for example the bridge in front of the red sky. It looks like no other scene category other than a bridge, but it also looks like no other bridge (the red sky is unique). Compare this to the bridge in the bottom right, which looks more like a pasture. Among bridges, it is memorable, but among pastures it is not. Thus, the memorability of the images in the top right quadrant is least affected by context, but the memorability of images in the bottom right quadrant is most affected by context.
Figure 3-4: We evaluated a scene classifier on the images in that increased most and those that dropped most in memorability when combined with other categories. Here we show 3 categories. For each image, we provide the classifier’s predicted category label, as well as the probability of the correct category label (where * is replaced with the correct category). Images that drop in memorability are more likely to be confused with other categories.
Figure 3-5: Memorability scores of images in the top right quadrant of each plot are least affected by context whereas the scores of images in the bottom right quadrant are most affected by context. Images in the top right are distinct with respect to both contexts, while images in the bottom right are distinct only with respect to their own category.
Chapter 4
Eye movements to predict individual
image memories
To what extent can one population of human participants reliably predict another? Can an individual’s eye-movements on an image be used to predict if the image will be later remembered?1
4.1
Related work
Little work has considered the intersection between image memorability and visual attention [42, 46, 19, 14]. Mancas et al. [42] use saliency features to show a slight improvement over the automatic image memorability predictions in [31]. They use a form of visual attention (i.e. saliency, eye movements) to improve on image mem-orability. We refer to image memorability as a population predictor because it ignores trial-by-trial variability, effectively averaging over a population of partici-pants or experiments. We, instead, use visual attention to improve the trial-by-trial predictions of memory (an individual trial predictor). Bulling and Roggen [14] use eye movement features to predict image familiarity, classifying whether images have been seen before or not. They assume that all images seen again are remem-bered, particularly due to the long exposure times (10 seconds) used per image, and
by testing on a small dataset of 20 faces. They also use eye movement analysis as a population predictor to decide whether an image was previously seen, while we use eye movement analysis as an individual trial predictor, taking into account indi-vidual differences in making predictions of whether an image will be later remembered.
Our work is also related to recent studies on the use of eye movements for decoding an observer’s task [8, 23]. These studies consider features extracted from the eye movements of individual participants to determine the task they are performing (e.g., what question they are answering about an image), modeled on the original Yarbus experiment [68]. These studies utilize a very small set of images (ranging from 15-64) with a very constrained theme (grayscale photographs taken between 1930-1979 with at least two people [23]; paintings depicting “an unexpected visitor" [8]). In our study, we measure the eye movements of participants on 630 target images sampled from 21 different indoor and outdoor scene categories. We extract features from eye movements to determine whether or not an image is correctly encoded (measured by whether it is correctly recognized on a successive exposure). We are able to solve our decoding task using only 2 seconds of viewing time per image, whereas the previous studies worked with durations of 10 sec [14, 23], 30 sec [8], 50 sec [57], and 60 sec [8]. For this purpose, we learn image-specific classifiers to distinguish fixations on one image versus fixations on other images.
4.2
Eyetracking experiments
We used a similar set-up to the in-lab experiment from Chap. 3, Sec. 3.3, but with important differences to collect eye-movements in an un-biased manner (outlined in Fig. 4-1). Images were presented to participants at 1000× 1000𝑝𝑥. We used the same set of 630 targets as in the in-lab experiment, but split the images over 4 separate experimental sessions (of 157-158 target images, randomly sampled from all categories). Target images were repeated 3 times in the sequence, spaced 50-60 images apart. Images remained on the screen for 2 seconds, and participants gave a
? correct + ? incorrect ? correct 2.0 s until keypress 0.3 s ... ... 0.2 s 0.4 s time false alarm
correct rejection hit
repeat
Figure 4-1: An example eyetracking experimental sequence. The main differences from the AMT experiment in Fig. 2-1 are the slightly longer image presentation times, the collection of key presses after image presentation at the prompt, and the forced-choice response.
forced-choice response at the end of each image presentation to indicate whether the image appeared previously or not. After a keypress response and feedback, a fixation cross came on the screen for 0.4 seconds, followed by the next image.
Eyetracking was performed on an SR Research EyeLink1000 desktop system at a sampling rate of 500Hz, on a 19 inch CRT monitor with a resolution of 1280× 1024 pixels, 22 inches from the chinrest mount. The experiments started with a randomized 9-point calibration and validation procedure, and at regular intervals throughout the experiment drift checks were performed, and if necessary, recalibration. Each experi-ment lasted 75-90 minutes, and participants could take regular breaks throughout. All participant eye-fixations and keypresses were recorded. We recruited a total of 42 par-ticipants for our study (16.2±1.6 participants per image). The memorability scores for this experiment were: HR: 𝑀 = 75.8%, 𝑆𝐷 = 14.4%, FAR: 𝑀 = 5.2%, 𝑆𝐷 = 7.4%.
4.3
Classification model
Given a set of fixations on an image, we want to know: will the viewer remember this image at a later point in time? The key idea is that if a viewer’s fixations differ from the fixations expected on an image, the viewer may not have encoded the image correctly. Thus, when evaluating a novel set of fixations, we want the probability that these fixations came from this image - as opposed to some other image. If the probability is high, we label the fixations as successful encoding fixations, since we believe they will lead to a correct recognition of the image later. Otherwise, we assume the image was not properly encoded, and will be forgotten. To provide some further
intuition, a few examples are provided in figure 4-2. We construct a computational model by training a separate classifier for each image, differentiating fixations that belong to this image from fixations on all other images.
After preprocessing2, we convert an observer’s fixations on an image into a
fixa-tion map by binning the fixafixa-tions into a 20× 20 grid, normalizing the binned map, and smoothing it by convolution with a Gaussian with 𝜎 = 2 grid cells. Coarse sampling and smoothing is necessary to regularize the data.
For each image, we train an ensemble classifier 𝐺𝑖 = 𝑔(𝐼) to differentiate fixation
maps on this image (positive examples) from fixation maps on all other images (negative examples). For training, we only consider successful encoding fixations -the fixations made on an image -the first time it appeared in -the image sequence, and led to a correct recognition later in the sequence.
We use a RUSBoost classifier [54], which handles the class imbalance problem3, and balanced accuracy as a metric of performance because it avoids inflated per-formance estimates on datasets with unequal numbers of positives and negatives [12]. It is calculated as:
balanced accuracy = 0.5× true positives true positives + false negatives + 0.5× true negatives
true negatives + false positives
(4.1)
Over 5 train-test splits, the balanced accuracy of our classifier on determining whether a set of fixations comes from a specific image vs some other image is 79.7% (SD: 13.9%), where chance is at 50%. This high performance indicates that we are able to successfully learn diagnostic fixation patterns for an image to distinguish it from all other images. However, not all images produce diagnostic fixation patterns, and thus predictive power varies by image (section 4.6).
2We processed the raw eye movement data using the EyeLink Data Viewer, removed all fixations
shorter than 100 ms or longer than 1500 ms, and kept all others that occurred within the 2000ms recording segment (from image onset to image offset).
3𝑁 being the total number of images, we have order 𝑁
− 1 negatives, since those come from all other images while the positives come from a single image.
Image Highest-confidence instances Lowest-confidence instances
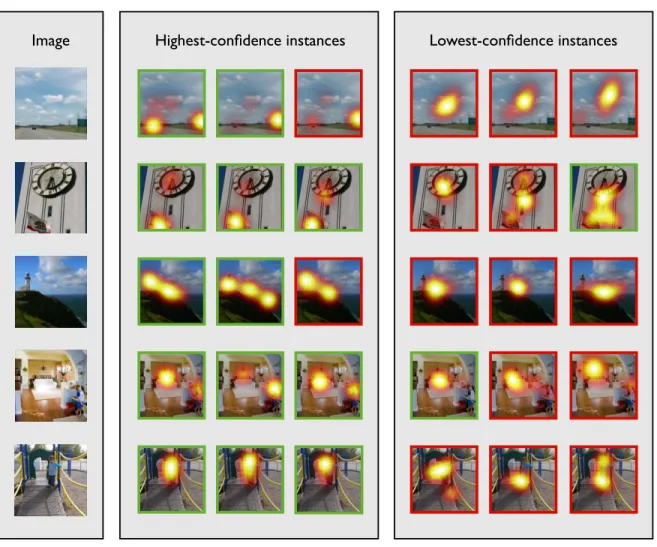
Figure 4-2: Examples of individual viewers’ fixation maps (at encoding) overlaid on top of the images viewed. For each of these 5 example images, we include the 3 highest-confidence and 3 lowest-confidence instances under the image’s classifier (trained to differentiate fixations on this image from fixations on other images). Fixations that later led to a correct recognition of the image are outlined in green, and those where the image was unsuccessfully remembered are in red. This depicts some of the successes and failure modes of our model.
4.4
Eye movements are predictive of whether an image will
be remembered
Here we use the model developed in the previous section to make image memorability predictions on a trial-by-trial basis. As demonstrated in previous chapters, people are highly consistent in which images they remember and forget. Thus as a baseline we use an image’s memorability score (HR from AMT 2, Chap. 3) to make trial-by-trial predictions. We refer to this as a population predictor because these memorability scores are obtained by averaging over observers.
We compare this population predictor with an individual trial predictor which uses a viewer’s eye movements on a particular trial to predict whether an image will be remembered. Our individual trial marker involves measuring the confidence of a viewer’s fixation map under the classifier 𝐺𝑖. Our split of the original eyetracking
data is threefold: we have a set of participants on each image for training the classi-fier 𝐺𝑖 to differentiate fixations on image 𝐼 from fixations on other images; another
set of participants on each image is used for estimating the threshold required to dif-ferentiate successful from unsuccessful encoding fixations (where we use the ground truth data on whether the participants successfully recognized the image); finally, we evaluate the fixation maps of the last set of participants using the learned threshold to classify fixations as successful or unsuccessful. For picking the threshold, we perform a grid search over 200 values, and optimize for balanced accuracy.
Over 15 different threefold splits of data, we obtain a balanced accuracy of 66.02% (𝑆𝐷 : 0.83) at determining whether a set of encoding fixations is successful and will lead to a correct recognition of the image at a later point in time. Compare this to 60.09% (𝑆𝐷 : 1.55%) when using the memorability score of an image - our population predictor which does not take into account the trial-to-trial variability. Additional baselines that we considered were the similarity of the fixation map to a center prior, achieving an accuracy of 56.35% (SD: 0.60%), and the coverage of the fixation map (proportion of image fixated), achieving an accuracy of 55.89% (SD: 0.58%). Thus,
neither of the baselines could explain away the predictive power of our model4.
4.5
When individual differences matter most
Consider the cases where images are not consistently memorable or forgettable across individuals. We sort images by their AMT scores (which we obtain from AMT 2, Chap. 3), and progressively remove images at the memorability extremes. The re-sulting prediction performance is plotted in figure 4-3a. Memorability scores fall to chance at predicting individual trials precisely because the images at the memorability extremes were most predictive. Meanwhile, our eye movement features retain predic-tive power, indicating that individual differences become most relevant for the middle memorability images. These are the images that may not be memorable at-a-glance, and may require the viewer to be more “attentive”.
4.6
Not all images are equally predictable
Our classifier is more likely to make a successful prediction on a given trial when it is confident. A classifier is confident when it can easily discriminate successful from unsuccessful fixations on an image. For instance, an image with all of the important content in the center might not require the viewers to move their eyes very much and this makes prediction particularly difficult because successful and unsuccessful fixations may not be that different.
Our model construction allows us to easily estimate the expected confidence of our classifier on an image. For a given image 𝐼, we compute the expected confidence of classifier 𝐺𝑖 as the average confidence value over its positive training examples
-the successful fixation maps on image 𝐼. When we sort images by this measure (see fig. 4-4), we obtain the results in fig. 4-3b. We can achieve a balanced accuracy above
4Successful fixations tend to be alike; every unsuccessful set of fixations is unsuccessful in its own
way : the fixations may be center-biased (the viewer does not move his eyes to look around), they may be off-center or even off-the-image (the viewer is distracted), the fixations might be randomly distributed over the image and have high coverage (the viewer is not paying attention to the task), etc. Thus baseline models that try to separate successful from unsuccessful fixations using simple principles, like coverage or center bias, will not have full predictive power.
(a) 0 5 10 15 20 25 30 35 40 45 50 55 60 65 70 75 80 85 90 95 45 50 55 60 65 70 75
Percent of images removed at memorability extremes
Balanced Accuracy (%)
Eye movement predictor Memorability predictor (b) 5 10 15 20 25 30 35 40 45 50 55 60 65 70 75 80 85 90 95 100 65 66 67 68 69 70 71 Balanced Accuracy (%)
Percent images used, sorted by expected classifier confidence
Figure 4-3: (a) When we prune images at the memorability extremes, memorability scores fall to chance as a predictor of per-trial memory performance, while eye movements remain important for making trial-by-trial predictions. (b) Our classifier makes more accurate predictions when it has higher expected confidence. Standard error bars are included for both plots.
images sorted by expected classifier confidence
...
Figure 4-4: Images sorted by expected classifier confidence (from least to most). A classi-fier with high confidence on its positive training examples will do better at differentiating successful from unsuccessful fixations on an image. Overlaid on top of each image is the average fixation map computed over all successful encodings of the image.
70% for the images where our classifier has the highest confidence. Thus, we can automatically select images that our classifier will likely do well on. This becomes an important feature for applications where we have a choice over the input images that can be used, and need to have a system to robustly predict from eye fixations, whether an image will be later remembered.
Chapter 5
Contributions to Cognitive Science:
Pupils as Indicators of Memory
Processes
How quickly can an image fade from memory? Can physiological measurements like pupillary responses and blink rates be used to track image memorability without the need for overt responses? 1
5.1
Related work
Memory for objects and scenes is massive and image details can be stored for hours or even days [11, 25, 39, 40]. Isola et al. have demonstrated that images in a collection that are the most memorable at shorter intervals are still the most memorable even after 40 minutes [30].
We confirm that memorability is an intrinsic property of images that is stable over time, using a logarithmic set of time intervals (lags of 8, 16, 32, 64 images). Differences in image memorability are already present briefly after encoding, at the shortest lag (only 20 seconds). Moreover, differences in memorability produce different rates of forgetting. The most memorable images degrade least in memorability across time.
The graded effect of memorability also shows up in the pupil and blink rates, as differences in physiological responses during retrieval.
While it has been known since the early 60s that the overt pupillary response can be linked to covert cognitive constituents like information processing and mental load [10, 24, 35, 22], recent studies have started using pupil dilations more deliberately to investigate recognition memory [21, 34, 44, 48, 49, 62]. For instance, Võ and colleagues [62] have demonstrated that pupils dilate more to “old”, studied items than to “new” ones, and termed this effect the Pupil Old/New Effect or PONE.
Usually, studies interested in pupil measurements disregard blinks as missing data. However, in addition to pupil dilations, blinks provide mutually exclusive, but com-plementary indices of information processing [55]. Blink rates have been shown to decrease under conditions of high visual and/or cognitive load, since a reduced blink rate supports a continuous input of visual information especially necessary when cog-nitive demands are high [45].
With regards to image memorability, these finding suggest that since a correct retrieval of less memorable images requires more cognitive effort, we should see an increase in pupil dilations as well as a decrease in blink rate. Furthermore, memories encoded longer ago should also require more cognitive effort to retrieve and should be accompanied by similar physiological markers.
5.2
In-lab experiments
From the Isola et al. [31] database of 2222 images with accompanying memorability scores, we chose 80 images each with the highest, lowest, and medium memorability scores, while balancing the occurrence of indoor/outdoor scenes, people, and animals in the 3 memorability categories. There was no difference in mean luminance between low and high memorability categories for neither LAB, HSV, nor RGB values, all 𝑡(158) < 1. The images were resized to be 512× 512 pixels. A sample from the 240 target images used in our present study can be found in Fig. 5-1.
Figure 5-1: Sample of top, medium, and low memorability images used from the memora-bility images of [31] as the targets for our experiments.
(low, medium, high) and lag (8, 16, 64, 256). Each participant was presented with a sequence of 1216 images, 240 of which were target images presented twice. The other 736 images were fillers, which were sampled randomly from the remaining images in the database. We randomly assigned target images to prespecified positions within the image sequence repeating at one of 4 lags categories (8, 16, 64, 256). Pupil dilations and blink rates were recorded with the EyeLink1000 set-up described in Sec. 4.2. 15 subjects participated.
Stimulus-locked recording segments of 2000 ms were baseline-corrected by sub-tracting the average pupil dilation over the 100 ms preceding stimulus onset. Peak horizontal dilations in the 2000 ms after stimulus onset were submitted separately to ANOVAs with memorability (low, medium, high) and lag (8, 16, 64, 256) as within-subject factors. Blinks were recorded as events where the pupil size was very small, missing in the camera image, and/or severely distorted by eyelid occlusion. We com-puted the blink rate as the average percentage of blinks in each of the conditions.
(a) (b)
Figure 5-2: (a) The most memorable images remain the most memorable for different lag lengths, and decay at a slower rate even for longer lags. (b) Response times follow the opposite pattern.
5.3
Differences in memorability show up early and change over
time
HR decreased with lower image memorability2, 𝐹 (13, 2) = 63.33, 𝑝 < 0.01, 𝜌𝜂2 = 0.70 and with increasing lag, 𝐹 (13, 3) = 97.76, 𝑝 < 0.01, 𝜌𝜂2 = 0.63. We also found an
interaction of memorability and lag, 𝐹 (13, 6) = 10.22, 𝑝 < 0.05, 𝜌𝜂2 = 0.18, as the rate of forgetting increased from high-mem images (-3.58), over medium-mem images (-6.94) to low-mem images (-8.30). Hit rates already differed significantly at the shortest lag: high (97%) vs. low (71%), 𝑡(12) = 3.79, 𝑝 < 0.05. See Fig. 5-3a.
RTs (response times) were measured from scene onset to button press and are only considered for successful recognition trials. Similar to HR, we see a main effect of memorability, 𝐹 (12, 2) = 105.72, 𝑝 < 0.01, 𝜌𝜂2 = 0.59, a main effect of lag,
𝐹 (12, 3) = 53.18, 𝑝 < 0.01, 𝜌𝜂2 = 0.61, and an interaction of memorability and
lag, 𝐹 (12, 6) = 2.39, 𝑝 < 0.05, 𝜌𝜂2 = 0.09, with a difference in slopes across lags
as a function of memorability: high = 24.07, medium = 40.08, and low = 41.91. RTs already differed significantly at the shortest lag: high (779ms) vs. low (897ms), 𝑡(12) = 9.48, 𝑝 < 0.01. See Fig. 5-3b.
2Note that memorability scores were fixed from the previous study of [31], whereas the HR
5.4
Pupil size and blink rates are predictive of differences in
memorability
The Pupil Old/New Effect (PONE) is measured as the difference in pupillary re-sponses to old images correctly identified as “old” (Hits) versus new images correctly identified as “new” (Correct Rejections, CRs). There was a significant PONE dur-ing retrieval with pupils dilatdur-ing more to Hits vs. CRs (𝑀 = 241, 𝑡(13) = 5.98, 𝑝 < 0.01). Differences in image memorability produced a graded PONE response, 𝐹 (13, 2) = 3.33, 𝑝 < 0.05, 𝜌𝜂2 = 0.20, with low-mem images eliciting a greater
PONE than high-mem images, 𝑡(13) = 2.23, 𝑝 < 0.05. The PONE was also modu-lated by the lag between image encoding and its successful retrieval, 𝐹 (13, 3) = 3.98, 𝑝 < 0.05, 𝜌𝜂2 = 0.23, with an increased PONE at the longest lag compared to lag-16, 𝑡(13) = 2.57, 𝑝 < 0.05.
The Blink Old/New Effect (BONE) was calculated as the difference in mean blink-ing rate for Hits versus CRs. There was a significant BONE, with reduced blinkblink-ing rates for Hits vs. CRs during retrieval (𝑀 = −16%, 𝑡(13) = 3.47, 𝑝 < 0.01). The BONE was further modulated by image memorability, 𝐹 (13, 2) = 6.04, 𝑝 < 0.01, 𝜌𝜂2 = 0.32, with blink rate significantly reduced for low-mem compared to high-mem
images, 𝑡(13) = 2.83, 𝑝 < 0.05. The BONE was not significantly modulated by the lag between image encoding and its successful retrieval, 𝐹 (13, 3) = 1.98, 𝑝 = 0.13, 𝜌𝜂2 = 0.13, but there was a marginally significant decrease of blink rate at lag-256
compared to lag-16, 𝑡(13) = 2.13, 𝑝 = 0.05. We therefore propose that this Blink Old/New Effect could be used as a complementary measure of memory processes.
5.5
Discussion
Image memorability has strong and robust effects on both recognition memory per-formance and eye activity measures. This study not only corroborated earlier findings that memorability is an intrinsic property of an image that is shared across different viewers and remains stable over time, but also clearly showed that low memorable