Compressive algorithms for search and storage in
biological data
by
Yun William Yu
B.S., Indiana University (2009)
B.A., Indiana University (2009)
MRes, Imperial College London (2010)
MPhil, Imperial College London (2014)
Submitted to the Department of Mathematics
in partial fulfillment of the requirements for the degree of
Doctor of Philosophy
at the
MASSACHUSETTS INSTITUTE OF TECHNOLOGY
June 2017
@2017
Massachusetts Institute of Technology. All rights reserved.
Signature of Author.
Signature redacted
V
Department of Matftematics
Certified by.
Signature redacted
May 1, 2017
Bonnie Berger
Simons Professor of Mathematics and Professor of Computer Science
Thesis Supervisor
Accepted by.
Signature redacted
Professor Jonathan Kelner
Applied Mathematics Graduate Chair
AUG
012017
SLIBRARIES
Compressive algorithms for search and storage in biological
data
by
Yun William Yu
Submitted to the Department of Mathematics on May 1, 2017, in partial fulfillment of the
requirements for the degree of Doctor of Philosophy
Abstract
Disparate biological datasets often exhibit similar well-defined structure; efficient algorithms can be designed to exploit this structure. In this doctoral thesis, we present a framework for similarity search based on entropy and fractal dimension; here, we prove that a clustered search algorithm scales in time with metric entropy-number of covering hyperspheres-if the fractal dimension is low. Using these ideas, entropy-scaling versions of standard bioinformatics search tools can be designed, including for small-molecule, metagenomics, and protein structure search.
This 'compressive acceleration' approach taking advantage of redundancy and sparsity in biological data can be leveraged also for next-generation sequencing (NGS) read mapping. By pairing together a clustered grouping over similar reads and a homology table for similarities in the human genome, our CORA framework can accelerate all-mapping by several orders of magnitude.
Additionally, we also present work on filtering empirical base-calling quality scores from Next Generation Sequencing data. By using the sparsity of k-mers of sufficient length in the human genome and imposing a human prior through the use of fre-quent k-mers in a large corpus of human DNA reads, we are able to quickly discard over 90% of the information found in those quality scores while retaining or even im-proving downstream variant-calling accuracy. This filtering step allows for fast lossy compression of quality scores.
Thesis Supervisor: Bonnie Berger
Title: Simons Professor of Mathematics and Professor of Computer Science
Acknowledgments
I would like to give immense thanks to my advisor Bonnie Berger for her support and
guidance throughout my PhD. Much of my growth as an independent scientist over
the last five years has been a direct result of her encouragement and confidence in my abilities. I would also like to thank my other thesis committee members, Peter Shor
and J6rn Dunkel, for generously giving their time and advice.
The work included in this thesis would not have been possible without Deniz Yorukoglu, Noah Daniels, Jian Peng, and David Danko. Though the research and
writing process included both highs and lows, many of my fondest memories are of
working and learning with them to push forward our work.
I would also like to thank the many Berger Lab members and alumni who have
both influenced my research prespectives during my PhD, but also provided a first-rate
environment in which to work for these years, especially Michael Baym, Po-Ru Loh, George Tucker, Mark Lipson, Sean Simmons, Alex Levin, Bianca Dumitrascu, Hoon
Cho, Sumaiya Nazeen, Hilary Finucane, Ariya Shajii, Emily Berger, Yaron Orenstein, Perry Palmedo, Tristan Bepler, Divya Shanmugam, and Andrew Morin.
Addition-ally, many present and former external collaborators and mentors have guided me during this journey, including especially Sophia Yaliraki, Mauricio Barahona, Kent
Orr, Michael Larsen, J. Michael Walker, Jojo Dijamco, Andy Yu, Justin Gullingsrud, Huafeng Xu, Laurent Demanet, and Martin Nowak. Further gratitude must be given to Patrice Macaluso, Barbara Peskin, and Michele Gallarelli for their kindness and
administrative support.
Throughout my PhD, I was generously supported by a Hertz Foundation
Fel-lowship, the Myhrvold and Havranek Family Fellowship. Additional funding for the research in this thesis was provided by grants from the NIH and NSF.
Last but most certainly not least, I am deeply indebted to my family and friends for their unwavering support of my research pursuits, even when the immediate benefits
and applications seemed nebulous at best.
Previous Publications of This Work
Parts of Chapter 1 were published as a review article, which served as the cover article
of Communications of the ACM 59 (8), 72-80, with co-authors Bonnie Berger and Noah Daniels.
Results described in Chapter 2 were published as the cover article of Cell Systems 1 (2), 130-140, with co-authors Noah Daniels, David Danko, and Bonnie Berger. Results described in Chapter 3 were published in Nature Biotechnology 34, 374-376, with co-authors Deniz Yorukoglu, Jian Peng and Bonnie Berger.
Results described in Chapter 4 were initially published in RECOMB 2014 with co-authors Deniz Yorukoglu and Bonnie Berger. Later a more powerful method and more comprehensive analysis results were published in Nature Biotechnology 33, 240-243 with co-authors Deniz Yorukoglu, Jian Peng and Bonnie Berger.
Contents
1 Introduction 17
1.1 Rapid growth in biological databases . . . . 18
1.2 Types of biological data . . . . 21
1.3 Challenges with biological data . . . . 23
1.4 Prior work on these challenges . . . . 28
1.4.1 Similarity search tools . . . . 28
1.4.2 Read mapping methods . . . . 29
1.4.3 NGS read compression . . . . 29
1.5 Organization of thesis . . . . 30
2 Entropy-scaling search of massive biological data 33 2.1 Sum m ary . . . . 33
2.2 Introduction . . . . 34
2.3 R esults . . . . 37
2.3.1 Entropy-scaling similarity search . . . . 37
2.3.2 Practical application of entropy-scaling search . . . . 41
2.3.3 Application to high-throughput drug screening . . . . 42
2.3.4 Application to metagenomics . . . . 44
2.3.5 Application to protein structure search . . . . 48
2.4 Application to other domains . . . . 51
2.5 D iscussion . . . . 53
2.6 M ethods . . . . 56
2.6.1 Ammolite small molecule search . . . . 56
2.6.2 MICA metagenomic search.
2.6.3 esFragBag protein structure search
2.7 Author Contributions . . . . Acknowledgments . . . Supplemental Figures . Supplemental Methods 2.10.1 Theory . . . . . 2.10.2 Ammolite . . . 2.10.3 MICA . . . . . 2.10.4 esFragBag . . .
3 Compressive Read Mapping 3.1 Overview . . . .
3.2 Methods . . . .
for Next-Generation Sequencing
3.2.1 Homology table construction . . . .
3.2.2 Query-side compression and coarse mapping . .
3.2.3 Homology table traversal . . . .
3.2.4 Related work and novelty of CORA framework.
3.2.5 Software features . . . .
3.3 R esults. . . . .
3.3.1 D ata sets . . . .
3.3.2 Experiments on real NGS human data . . . . .
3.3.3 Experiments on simulated human data . . . . . 3.3.4 Experiments on mouse data . . . .
3.3.5 Additional experimental results . . . .
3.3.6 Further details on experimental setup . . . .
4 Traversing the k-mer Landscape for Quality Score
4.1 O verview . . . . 4.2 M ethods . . . . 4.2.1 Dictionary generation . . . . Compression 10 2.8 2.9 2.10 57 57 58 . . . . 5 8 . . . . 5 9 . . . . 5 9 . . . . 5 9 . . . . 7 0 . . . . 7 0 . . . . 7 5 77 77 82 84 94 107 120 124 128 128 129 136 136 138 141 155 155 162 162
4.2.2 Quality score compression . . . . 164
4.2.3 Parameter selection . . . . ... . . . . . 164
4.2.4 Hamming neighbor search . . . . 165
4.2.5 Theoretical guarantees . . . . 166
4.2.6 Memory requirements . . . . 169
4.3 R esults . . . . 170
4.3.1 Experimental design . . . . 170
4.3.2 Datasets . . . . 171
4.3.3 Timing and compression benchmarks. . . . . 172
5 Conclusion 185
List of Figures
1-1 Sequencing vs. Storage . . . . 19
1-2 The NGS Pipeline. . . . . 25
2-1 Entropy-scaling framework for similarity search . . . . 38
2-2 Cartoon depiction of low-fractal dimension points . . . . 39
2-3 Scaling behavior of esFragBag . . . . 52
2-4 Growth in genomic data . . . . 60
2-5 Ammolite cyclic ring structure clustering . . . . 61
2-6 Local fractal dimension of PDB under FragBag distances . . . . 62
3-1 All-mapping performance of CORA framework . . . . 79
3-2 Conventional read mapping methods and compressively accelerated read mapping framework. . . . . 83
3-3 Compact representation of homology table with exact and inexact ho-m ologies. . . . . 86
3-4 Seed position selection for inexact homology table construction. . . . 91
3-5 Estimation of redundancy within read data sets in absence of sequenc-ing error... ... 104
3-6 Sublinearity analysis of CORA framework on simulated paired-end read data. ... ... 106
3-7 Homology table traversal scheme of CORA framework. . . . . 109
3-8 An overview of CORA framework and input/output relations between different stages of the CORA software . . . . 125
3-9 Runtime and sensitivity comparison results for whole genome ungapped
and gapped best-mapping. . . . . 133
4-1 Visualization of Quartz algorithm. . . . . 159
4-2 Downstream SNP calling before and after Quartz compression . . . . 175
4-3 Downstream indel calling before and after Quartz compression. . . . . 176
4-4 Changes in ROC curves when quality score values are removed or as-signed different default values within the Quartz algorithm. . . . . 177
4-5 Quartz compared to other methods on NA12878 dataset. . . . . 178
4-6 Quartz compared to other methods on NA19240 dataset. . . . . 180
4-7 ROC curves for low-coverage datasets. . . . . 181
4-8 Quartz compared to other methods on E. coli dataset . . . . 183
List of Tables
2.1 Ammolite vs. SMSD benchmarks . . . . 45
2.2 Running time of BLASTX, RapSearch2, DIAMOND, and MICA . . . 47
2.3 Cluster generation time for esFragBag . . . . 50
2.4 esFragBag vs. FragBag sensitivity . . . . 51
3.1 Computational cost of CORA's homology table construction stage. 95
3.2 Computational cost of CORA's collapsing stage. . . . . 107 3.3 Computational cost of CORA's homology table traversal stage . . . . 114 3.4 All-mapping and coarse mapping runtimes for different Hamming
dis-tances. . ... ... . .... ... ... .. 134
3.5 All-mapping sensitivity results for different Hamming distances. . . . 135 3.6 Runtime and sensitivity results of all-mapping when mapping recovery
is disabled . . . . 135
4.1 Compression benchmarks on NA12878. . . . . 172
4.2 Runtime and compression benchmarks for different k-mer lengths and Ham m ing distance. . . . . 173
4.3 Runtime benchmarks for Bowtie2
+
GATK and BWA + SAMtoolspipelines. . . . . 173
4.4 ROC AUC values for original uncompressed vs Quartz compressed read
datasets. . . . . 179
4.5 Time and storage requirements after Quartz compression and GATK
recalibration . . . . 183
Chapter 1
Introduction
Parts of the introduction have been previously published, and are revised from:
o Bonnie Berger, Noah M Daniels, and Y William Yu. Computational biology in
the 21st century: scaling with compressive algorithms. Communications of the ACM, 59(8):72-80, 2016 http: //dx. doi. org/10. 1145/2957324
Throughout all areas of data science, scientists are being confronted by a veritable explosion of available data. In many fields, this increase is exponential in nature, even outpacing Moore's and Kryder's laws on the respective doublings of transistors on a chip and long-term data storage density. As such, the challenges posed by the massive influx of data cannot be solved by waiting for faster and larger capacity computers, but require instead the development of data structures and representations that exploit and simplify complexity in the dataset. In this thesis, we focus on taking advantage of the entropic structure of massive biological data to design 'compressive' algorithms that (1) scale sublinearly for the similarity searh problem in large-scale genomics, personal genomics and chemogenomics, and (2) reduce the storage and transmission requirements associated with next-generation sequencing data.
1.1
Rapid growth in biological databases
Computational biologists answer biological and biomedical questions by using
com-putation in support of-or in place of-laboratory procedures, in hopes of obtaining
more accurate answers at a greatly reduced cost. The past two decades have seen unprecedented technological progress with regard to generating biological data;
next-generation sequencing, mass spectrometry, microarrays, cryo-electron microscopy, and other high-throughput approaches have led to an explosion of data. However, this
explosion of data is a mixed blessing. On the one hand, the scale and scope of data should allow new insights into genetic and infectious diseases, cancer, basic biology, and even human migration patterns. On the other hand, researchers are generating
datasets so massive that it has become difficult to analyze them to discover patterns
that give clues to the underlying biological processes.
Certainly, computers are getting faster and more economical; the amount of pro-cessing available per dollar of compute hardware is more or less doubling every year or two; a similar claim can be made about storage capacity (Figure 1-1). In 2002, when the first human genome was sequenced, the growth in computing power was still matching the growth rate of genomic data. However, the sequencing technology used
for the Human Genome Project-Sanger sequencing-was supplanted around 2004, with the advent of what is now known as next-generation sequencing. The material
costs to sequence a genome have plummeted in the past decade, to the point where a whole human genome can be sequenced for less than one thousand U.S. Dollars. As a result, the amount of genomic data available to researchers is increasing by a factor
of ten every year.
This growth in data poses significant challenges for researchers [2]. Currently, many biological 'omics' applications require us to store, access, and analyze large libraries of data. One approach to solving these challenges is to embrace cloud com-puting. Google, Inc. and the Broad Institute have collaborated to bring the GATK
(Genome Analysis Toolkit) to the Google cloud (https://cloud.google.com/genomics/gatk). Amazon Web Services are also commonly used for computational biology research and
18
(a) Growth of genomic sequence data (orange) as compared with the combined power of the top-500 supercomputer list (blue); y-axis is logarithmic
109 109 - Genomic Data M 10. - Computing Power 10' ) 10 LV 107 'A 106 106 105 105 o00 n 104 104 IC 103 103 U 102 102 0 0C 10 10 0 2002 2004 2006 2008 2010 2012 2014 Year
(b) Growth of genomic sequence data (orange) as compared
with hard drive capacity (blue); y-axis is logarithmic
109 109
- Genomic Data M
10' 0
(A - Hard Drive Capacity 10' 0.
107 107 3 106 106 $A Ci105 105 C 10' 10' ' M 104 10' U 104 102 10' 0 10 10 2002 2004 2006 2008 2010 2012 2014 Year
Figure 1-1: (a) Moore's and (b) Kryder's laws contrasted with genomic sequence data
enterprise (e.g., DNAnexus) [3]. However, while cloud computing frees researchers from maintaining their own data centers and provides cost-saving benefits when com-puting resources are not needed continuously, it is no panacea. First and foremost, the computer systems that make up those cloud datacenters are themselves bound
by improvements in semiconductor technology and Moore's law. Thus, cloud
com-puting does not truly address the problem posed by the faster-than-Moore's law exponential growth in omics data. Moreover, in the face of disease outbreaks such as the 2014 Ebola virus epidemic in West Africa, analysis resources are needed at often-remote field sites. While it is now possible to bring sequencing equipment and limited computing resources to remote sites, internet connectivity is still highly constrained; accessing cloud resources for analytics may not be possible.
Computer scientists routinely exploit the structure of various data in order to reduce time or space complexity. In computational biology, this approach has implic-itly served researchers well. Now-classical approaches such as principal component analysis (PCA) reduce the dimensionality of data in order to simplify analysis and uncover salient features [4]. As another example, clever indexing techniques such as the Burrows-Wheeler Transform (BWT) take advantage of aspects of sequence structure [4] to speed up computation and save storage. This Review focuses on cutting-edge algorithmic advances for dealing with the growth in biological data by explicitly taking advantage of its unique structure; algorithms for gaining novel bio-logical insights are not its focus.
Definitions
chemogenomics Computational study of drugs and their targets based on chemical
structure and function
metagenomics Study of the many genomes that make up a particular environment shotgun sequencing Modern genomic sequencing, which chops DNA into many
short pieces
homology search Determining the function, structure, or identity of a gene sequence by locating similar sequences within an annotated database
transcriptome Transcribed RNA from a genome, which results in protein production BLAST Standard biological sequence similarity search tool
1.2
Types of biological data
In the central dogma of molecular biology, DNA is transcribed into RNA, which is
translated by the ribosome into polypeptide chains, sequences of amino acids which singly or in complexes are known as proteins. Proteins fold into sophisticated,
low-energy structures, which function as cellular machines; the DNA sequence determines
the amino acid sequence, which in turn determines the folded structure of a protein. This structure ultimately determines a protein's function within the cell. Certain kinds of RNA also function as cellular machines. Methods have been developed to
gather biological data from every level of this process, resulting in a massive influx of
data on sequence, abundance, structure, function, and interaction of DNA, RNA, and proteins. Much of these data are amenable to standard Big Data analysis methods;
however, in this thesis we focus on examples of biological data which exhibit additional exploitable structure for creating scalable algorithms.
Sequence data, either nucleotide sequences (using a four-letter alphabet
represent-ing the four DNA or RNA bases) or protein sequences (usrepresent-ing a twenty-letter alphabet representing the twenty standard amino acids) are obtained in several ways. For both
protein and RNA sequence data, mass spectrometry-which can determine protein sequence and interactions-and RNA-seq-which can determine RNA sequence and
abundance, allowing scientists to also infer the expression of the gene to which it
might translate-play central roles. However, with the advent of next-generation se-quencing (NGS) technologies, the greatest volume of sequence data available are that
of DNA. To better understand the structure of NGS sequence data, we will expand
on NGS methodologies.
At the dawn of the genomic era, Sanger sequencing was the most widely-used
method for reading a genome. More recently, however, NGS approaches, beginning
with Illumina's 'sequencing by synthesis,' have enabled vastly greater throughput due to massive parallelism, low cost, and simple sample preparation. Illumina sequencing
and other NGS approaches such as SOLiD, Ion Torrent, and 454 pyrosequencing
do not read a single DNA molecule end-to-end as one could read through a bound book. Instead, in shotgun sequencing, DNA molecules are chopped into many small
fragments; from these fragments we generate reads from one or both ends (Figure 1-2a). These reads must be put together in the correct order to piece together an entire
genome. Current reads typically range from 50 to 200 bases long, though longer reads
are available with some technologies (e.g., PacBio). Because no sequencing technology is completely infallible, sequencing machines also provide a quality score (or measure
of the confidence in the DNA base called) associated with each position. Thus, an
NGS read is a string of DNA letters, coupled with a string of ASCII characters that
encode the quality of the base call. A sequencing run will produce many overlapping reads.
While measuring abundance to generate gene expression data (see Supplement) lends itself to cluster analysis and probabilistic approaches, the high dimensionality and noise in the data presents significant challenges. Principal Component Analysis
has shown promise in reducing the dimensionality of gene expression data. Such data
and its challenges have been the focus of other work [4], and thus will be only lightly touched upon here.
As mentioned earlier, function follows form, so in addition to sequence and
expres-sion, structure plays an important role in biological data science. However, we are not interested in only RNA and protein structures; small chemical compounds repre-sent an additional source of relevant structural data, as they often interact with their
22
larger RNA and protein brethren. Physical structures of molecules can be determined
by X-ray crystallography, NMR, electron microscopy and other techniques. Once
de-termined, there are a variety of ways of representing these structures, from labeled graphs of molecular bonds to summaries of protein domains. These representations
can then be stored in databases such as PubChem or the Protein Data Bank, and are often searched through for, e.g. potential small molecule agonists for protein targets.
Importantly, as we will expand upon later in this thesis, interesting biomolecules tend to be sparse and non-randomly distributed in many representational spaces, which can be used for accelerating the aforementioned searches.
When examining more complex phenomena than single proteins or compounds, we often look to synthesize things together into a systems-level understanding of
biology. To that end, we frequently use networks to represent biological data, such
as the genetic and physical interactions among proteins, as well as those in metabolic pathways [4]. While standard network science tools have been employed in these
analyses- e.g. several approaches make use of diffusion or random walks to explore the topology of networks [5, 6]- they are often paired with more specific biological
data, as seen in IsoRank [7] and IsoRankN's [8] use of conserved biological function
in addition to random walks for global multiple network alignment. Other tools solve other biological problems, such as MONGOOSE
[9],
which analyzes metabolic networks. However, given its breadth, biological network science is beyond the scope of this thesis, so we will not discuss it further.1.3
Challenges with biological data
Given DNA or RNA reads from NGS technologies, the first task is to assemble those
fragments of sequence into contiguous sequences. The assembly problem is analogous to the problem of reconstructing a book with all its pages torn out. De novo assembly
is beyond the scope of this thesis, but is possible because the sequence is covered
by many overlapping reads [4]; for this task, the de Bruijn graph data structure is
commonly used [10]. Often, however, a reference genome (or in the case of RNA,
transcriptome) is available for the organism being sequenced; the establishment of a
human reference genome was indeed the purpose of the Human Genome Project.
When a reference sequence is available, NGS reads can be mapped onto this ref-erence (Figure 1-2c). Continuing the book analogy, it is much easier to reconstruct a book with all its pages torn out when one has another (perhaps imperfect) copy of that book to match pages to. Mapping allows the differences between the newly-sequenced genome and the reference to be analyzed; these differences, or variants, may include single-nucleotide polymorphisms (SNPs, which are the genetic analogue to bit-flips) (Figure 1-2b), insertions or deletions, or larger-scale changes in the genome. De-termining the differences between an individual genome and a reference is known as variant calling. While reference-based read mapping is a fundamentally simpler problem than de novo assembly, it is still computationally complex, as gigabytes or terabytes of reads must each be mapped onto the reference genome, which can range from millions (for bacteria) to billions (for mammals) of base pairs. As an exam-ple, the ICGC-TCGA Pan Cancer Analysis of Whole Genomes (PCAWG) [11] brings together more than 500 top cancer researchers from about 80 institutions in a co-ordinated manner with the goal of mapping the entire mutational landscape of 37 common cancer types. Currently each sample requires seven hours to download even on an institutional connection. Importantly, researchers do not trust the provided mapping, and thus they redo mappings. The time spent on mapping is about 50% of the overall time spent on the sequence analysis pipeline. As read mapping is typically the most costly step in NGS analysis pipelines (e.g., GATK), any improvement to existing mappers will immediately accelerate sequence analysis studies on large read datasets.
Driven by the plummeting costs of next-generation sequencing, the 1000 Genomes Project [12] is pursuing a broad catalog of human variation; instead of producing a single reference genome for a species, many complete genomes are catalogued. Like-wise, WormBase and FlyBase are cataloguing many different species and strains of the Caenorhabditis worm and Drosophila fruit fly, respectively. These genomes are enabling cross-species inference, for example about genes and regulatory regions, and
24
cut many
++++
5 times at random (Shotgun) -~ 4--100 bp Read -100 bases (bp) from one or both ends(a) 'Shotgun' sequencing breaks DNA molecules into (b) Single-nucleotide poly-many short fragments, which are read from one or morphisms, or SNPs, are the both ends in the form of reads, and relies on high simplest type of genomic vari-coverage to produce a statistically likely representa- ant, and form the bulk of tion of a whole genome 'variant-calling' analysis
Raw eadsMaped RadsVariant Calls
102 .... A 452 ... A
146 ... 711
Bowtie2 GATK or
or BWA Samtools
(c) The NGS downstream analysis pipeline. Shotgun reads are mapped to a
reference genome with tools such as BWA or Bowtie. The resulting genomic sequence is analyzed for variants with tools such as GATK or Samtools. This allows relationships between genes and diseases to be uncovered.
Figure 1-2: The next-generation sequencing (NGS) pipeline.
25
~100 bp
A C~A A C
--- SNP .*-=*-**
thus insights into function and evolution [4]. Again, the sheer enormity of sequencing
data is problematic for storage, access and analysis.
Given a sequenced genome, the next natural questions ask what genes (genomic
re-gions that code for proteins) are present, what structure each resulting protein takes, and what biological function it performs. Identifying likely genes is a well-studied problem [4] beyond the scope of this thesis. However, determining evolutionary
rela-tionships, structure, and function is at the heart of current research in computational biology. Since some organisms (known as model organisms) are better studied than
others, and evolution is known to conserve sequence, structure, and function, a pow-erful approach to determine these attributes is to search for similar sequences about which more is known. This so-called homology search entails searching for
approxi-mate matches in databases of known gene or protein sequences. The homology search
problem was previously believed to be solved; Basic Local Alignment Search Tool
(BLAST) [4] has been the standard tool for performing homology (similarity) search
on databases of nucleotide and protein sequences. BLAST takes a 'seed-and-extend' approach; it looks for small, k-mer matches that might lead to longer matches, and
greedily extends them, ultimately producing a sequence alignment between a query and each potential database hit. However, BLAST's running-time scales linearly with
the size of the database being searched, which is problematic as sequence databases continue to grow at a faster rate than Moore's law.
On a potentially even larger scale is the growth of metagenomic data. Metage-nomics is the study of the many genomes (bacterial, fungal, and even viral) that make up a particular environment. Such an environment could be soil from a particular
re-gion (which can lead to the discovery of new antibiotics [13]), or it could be the human gut, whose microbiome has been linked to human-health concerns including Autism
Spectrum Disorder [14], Crohn's Disease, and obesity. Metagenomics fundamentally asks what organisms are present, and, in the case of a microbiome such as the gut, what metabolic functions it can accomplish as a whole. One way of addressing this problem is to attempt to map NGS reads from a metagenomic sample onto a set of reference genomes that are expected to be present. This is exactly the read-mapping
problem discussed above, but with many reference genomes, compounding the com-putational requirements. A second way is to perform homology search on a protein sequence database; exact or nearly-exact matches imply the presence of a species, while more distant hits may still give clues to function. For this task, BLASTX [15] is commonly used to translate nucleotide reads into their possible protein sequences, and search for them in a protein database. The difficulty is that the datasets required to shine any light on these questions, namely from 'shotgun' metagenomics, are gi-gantic and vastly more complex than standard genomic datasets. The massive data
results in major identification challenges for certain bacterial, as well as viral, species and genera [16].
The computational study of drugs and their targets based on chemical structure and function is known as chemogenomics [17]. In the fields of drug discovery and drug repurposing, the prediction of biologically active compounds is an important task. Computational high-throughput screening eliminates many compounds from
labori-ous wet-lab consideration, but even computational screening can be time-consuming. Chemogenomics typically relies on comparing chemical graph structures to identify
similar molecules and binding sites. Furthermore, comparing chemical graph struc-tures typically involves computing the maximal common subgraph (MCS), an
NP-hard problem. However, there are an increasing number of such chemical compounds to search; the NCBI's PubChem database has grown from 31 million compounds in
January 2011 to 68 million in July, 2015.
The continued ability to store, search, and analyze these growing data sets hinges on clever algorithms that take advantage of the structure of, and redundancy present in, the data. Indeed, these growing data sets "threaten to make the arising problems computationally infeasible." [4]
1.4
Prior work on these challenges
1.4.1
Similarity search tools
Recent advances in metagenomic search tools have relied on two improvements over BLASTX: indexing and alphabet reduction. RapSearch2 [18] relies on alphabet
re-duction and a collision-free hash table. The alphabet rere-duction, as it is reversible, can be thought of as a form of lossless compression; a 20-letter amino acid alphabet is mapped onto a smaller alphabet, with offsets stored to recover the original sequence
in the full alphabet. The hash-table provides an efficient index of the database to be
searched. DIAMOND [19] also relies on alphabet reduction, but uses 'shaped seeds' essentially, k-mers of length 15-24 with wildcards at 9-12 specific positions-instead
of simple k-mer seeds to index the database. DIAMOND demonstrates search
per-formance three to four orders of magnitude faster than BLASTX, but still linear in the size of the database being searched.
The most widely-used chemogenomics search is the Small Molecule Subgraph
De-tector (SMSD) [20], which applies one of several MCS algorithms based on the size and complexity of the graphs in question. Notably, large chemical compound databases, such as PubCHEM, cannnot be searched on a laptop computer with current tools such as SMSD.
In prior work by the Berger lab, Loh, Baym, and Berger demonstrated that
by computing on a compressed representation of genomic data, they were able to
achieve massive acceleration of the existing BLAST and BLAT search tools [21].
While cluster-based search is well-studied [22], conventional wisdom holds that it provides a constant factor speed-up over exhaustive search. However, Loh, et al.
found that 'compressive acceleration' of biological data scaled sublinearly in the size of the database, and with the compressed size of the database. However, though an impressive engineering achievement, they did not fully characterize the conditions
under which 'compressive acceleration' works, and why it seemed to scale sublinearly with the database size.
1.4.2
Read mapping methods
Techniques for reference-based read mapping typically rely on algorithmic approaches such as the Burrows-Wheeler transform (BWT), which provides efficient string com-pression through a reversible transformation, while the FM-index data structure is a compressed substring index, based on the BWT, which provides efficient storage as well as fast search [4]. BWA (Burrows-Wheeler Aligner) uses the BWT, while the Bowtie2 mapper further relies on the FM-index for efficient mapping of NGS reads [4].
The Genome Multitool (GEM) mapper [23] also uses an FM-index coupled with dy-namic programming in a compressed representation of the reference genome, in order to prune the search space when mapping reads to a reference genome. Masai [24] and mrsFAST [25] use an 'approximate seed' approach to index the space of possible matches, likewise pruning the search space; however, the bulk of its runtime is spent on the extend phase. State-of-the-art mapper mrsFAST-Ultra achieves improvements in efficiency based on machine architecture rather than leveraging redundancy in the data itself with near-perfect sensitivity, but only for the case where there are no inser-tions and deleinser-tions (indels) [26]. Even with these approaches, read mapping remains
a significant bottleneck in genomic research [4].
1.4.3
NGS read compression
Compressing reads for storage is necessary should researchers wish to apply more advanced mapping tools or other analysis in the future [27]. As stated earlier, NGS reads consist of a sequence string and associated quality scores, the latter of which generally uses more space when compressed. By taking advantage of biological struc-ture, both parts of NGS reads can be better compressed. For the sequence component of the read, Mince [28] takes advantage of sequence redundancy by grouping similar reads (those that share a common short- 5bp-substring) together into 'buckets,' allowing that common substring to be removed and treated as the bucket label, so that each read in the compressed representation comprises only its unique differences from the bucket label. This approach allows a general-purpose compressor to achieve
better compression. SCALCE
[4]
also relies on a 'boosting' scheme, reordering reads in such a way that a general-purpose compressor achieves improved compression.1.5
Organization of thesis
The remainder of this thesis is structured as three self-contained chapters (each
pre-viously published as research articles) describing separate research studies, and some brief concluding remarks.
Chapter 2: Entropy-scaling search of massive biological data
Biological data has unique structure, which we take advantage of to perform search that scales sublinearly in the size of the database [29]. Prior work by Loh, et al.
provided the critical observation that much biological data is highly redundant; if a computation is performed on one human genome, and a researcher wishes to perform
the same computation on another human genome, most of the work has already been done [21].
In this chapter, we prove that clustered similarity search on biological datasets
runs in time-complexity dependent on the metric entropy and fractal dimension of the database. This work formalizes and generalizes the family of 'compressive genomics'
algorithms. Additionally, we present accelerated versions of similarity search tools in the domains of metagenomics, protein search, and small molecule search.
Chapter 3: Compressive Read Mapping for Next-Generation Sequencing
The high cost of mapping next-generation sequencing (NGS) reads against a reference
is a major part of the cost of sequencing analysis pipelines. We are able to apply the same kind of clustered 'compressive acceleration' to the read mapping of next-generation sequencing (NGS) reads. Instead of simply clustering, as we do in Chapter
3, we build a homology table of the reference, and cluster the reads. By building data
structures on both the database and queries, we are gain multiplicative acceleration
factors for all-mapping.
In this chapter, we present CORA, which accelerates paired-end read mapping of existing tools like BWA and Bowtie 2 by up to orders of magnitude with minimal or no loss in sensitivity. Using this method, we are able to achieve all-mapping speeds on the order of the speed of many best-mapping methods.
Chapter 4: Traversing the k-mer Landscape for Quality Score Compression
In this chapter, we describe a scalable quality score compression framework, Quartz, that substantially outperforms the compression ratio and speed of other de novo qual-ity score compression methods while maintaining downstream genotyping accuracy.
Unlike some other approaches to compressing quality scores in the literature [27,
30], Quartz [31] takes advantage of the fact that mid-size l-mers can in many cases
almost uniquely identify locations in the genome, bounding the likelihood that a quality score is informative and allowing for lossy compression of uninformative scores.
Because Quartz's lossy compression injects information from the distribution of l-mers in the target genome, it demonstrates not only improved compression over competing approaches, but slightly improves the accuracy of downstream variant-calling [31].
Chapter 5: Conclusion
Here we cursorially summarize the central themes of the previous chapters.
Chapter 2
Entropy-scaling search of massive
biological data
This chapter was originally published as:
e Y William Yu, Noah M Daniels, David Christian Danko, and Bonnie Berger.
Entropy-scaling search of massive biological data. Cell systems, 1(2):130-140,
2015 http://dx.doi.org/10.1016/j.cels.2015.08.004
2.1
Summary
Many datasets exhibit a well-defined structure that can be exploited to design faster search tools, but it is not always clear when such
acceler-ation is possible. Here, we introduce a framework for similarity search based on characterizing a dataset's entropy and fractal dimension. We
prove that searching scales in time with metric entropy (number of cov-ering hyperspheres), if the fractal dimension of the dataset is low, and
scales in space with the sum of metric entropy and information-theoretic entropy (randomness of the data). Using these ideas, we present
acceler-ated versions of standard tools, with no loss in specificity and little loss
in sensitivity, for use in three domains-high-throughput drug screening
(Ammolite, 150x speedup), metagenomics (MICA, 3.5x speedup of DIA-MOND [3,700x BLASTX]), and protein structure search (esFragBag, 10x speedup of FragBag). Our framework can be used to achieve "compres-sive omics," and the general theory can be readily applied to data science problems outside of biology.
Source code: http://gems.csail.mit.edu
2.2
Introduction
Throughout all areas of data science, researchers are confronted with increasingly large volumes of data. In many fields, this increase is exponential in nature, outpacing
Moore's and Kryder's laws on the respective doublings of transistors on a chip and
long-term data storage density [32]. As such, the challenges posed by the massive influx of data cannot be solved by waiting for faster and larger capacity computers
but, instead, require instead the development of data structures and representations that exploit the complex structure of the dataset.
Here, we focus on similarity search, where the task at hand is to find all entries in
some database that are "similar," or approximate matches, to a query item. Similarity search is a fundamental operation in data science and lies at the heart of many other problems, much like how sorting is a primitive operation in computer science.
Traditionally, approximate matching has been studied primarily in the context of strings under edit distance metrics (Box 1) (e.g., for a spell-checker to suggest the most
similar words to a misspelled word) [33]. Several approaches, such as the compressed suffix array and the FM-index [34, 35], have been developed to accelerate approximate
matching of strings. However, it has been demonstrated that similarity search is also important in problem domains where biological data are not necessarily represented
as strings, including computational screening of chemical graphs [36] and searching protein structures [37]. Therefore, approaches that apply to more general conditions
are needed.
As available data grow exponentially [4, 31] (e.g., genomic data in Figure S),
algorithms that scale linearly (Box 1) with the amount of data no longer suffice. The primary ways in which the literature addresses this problem-locality sensitive
hashing [38], vector approximation [39], and space partitioning [40]-involve the con-struction of data structures that support more efficient search operations. However, we note that, as biological data increase, not only does the redundancy present in the data also increase [21], but also internal structure (such as the fact that not all
conceivable configurations, e.g. all possible protein sequences, actually exist) also becomes apparent. Existing general-purpose methods do not explicitly exploit the
particular properties of biological data to accelerate search (see the Theory section in the Supplemental Methods).
Previously, our group demonstrated how redundancy in genomic data could be
used to accelerate local sequence alignment. Using an approach that we called
"com-presive genomics," we accelerated BLAST and BLAT [41] by taking advantage of high redundancy between related genomes using link pointers and edit scripts to a database of unique sequences [21]. We have used similar strategies to obtain equally
encouraging results for local alignment in proteomics [42]. Empirically, this compres-sive acceleration appears to scale almost linearly in the entropy of the database, often
resulting in orders of magnitude better performance; however, these previous studies neither proved complexity bounds nor established a theory to explain these empirical
speedups.
Here, we generalize and formalize this approach by introducing a framework for similarity search of omics data. We prove that search performance primarily depends on a measure of the novelty of new data, also known as entropy. This framework, which we call entropy-scaling search, supports the creation of a data structure that provably scales linearly in both time and space with the entropy of the database, and thus sublinearly with the entire database.
We introduce two key concepts for characterizing a dataset: metric entropy and fractal dimension. Intuitively, metric entropy measures how dissimilar the dataset is from itself, and fractal dimension measures how the number of spheres needed to cover all points in a database scales with the radii of those spheres. Both are
ously defined later, but note that metric entropy is not to be confused with the notion of a distance metric (Box 1). Using these two concepts, we show that, if similarity is defined by a metric-like distance function (e.g., edit or Hamming distance) and the database exhibits both low metric entropy and fractal dimension, the entropy-scaling search performs much better than naive and even optimized methods. Through three applications to large databases in chemogenomics, metagenomics, and protein struc-ture search, we show that this framework allows for minimal (or even zero) loss in recall, coupled with zero loss in specificity. The key benefit of formulating entropy-scaling search in terms of metric entropy and fractal dimension is that this allows us to provide mathematically rigorous guidance as to how to determine the efficacy of the approach for any dataset.
" Edit distance: the number of edits (character insertions, deletions, or substitutions) needed to turn one string into another.
" Scale, in time and space: the amount of time or space a task takes as a function of the amount of data on which it must operate. A task requiring time directly proportional to the size of the data is said to scale linearly; for example, searching a database takes twice as long if the database grows by a factor of two.
" Distance metric: a measure of distance that obeys several mathematical properties, including the triangle inequality.
" Covering spheres: a set of spheres around existing points so that every point is con-tained in at least one sphere and no sphere is empty.
" Metric entropy: a measure of how dissimilar a dataset is from itself. Defined as the number of covering spheres.
" Fractal dimension: a measure of how the number of points contained within a sphere scales with the radius of that sphere.
" Information-theoretic entropy: often used in data compression as shorthand for the number of bits needed to encode a database or a measure of the randomness of that database.
" Pattern matching: refers to searching for matches that might differ in specific ways from a query, such as wildcards or gaps, as opposed to searching for all database en-tries within a sphere of a specified radius as defined by an arbitrary distance function.
Box 1: Definitions
2.3
Results
2.3.1
Entropy-scaling similarity search
The basic framework for the entropy-scaling search of a database involves four steps.
(1) Analyze the database to define a high-dimensional space and determine how to
map database entries onto points in this space (this mapping may be one-to-one). (2) Use this space and a measure of similarity between points to group entries in the
database into clusters. (3) To search for a particular query item, perform a coarse-grained search to identify the clusters that could possibly contain the query. (4) Do
a fine-grained search of the points contained within these clusters to find the closest matches to the query (Figure 2-1).
Here, we provide conceptual motivation for this process. In the following text, we consider entropy to be nearly synonymous with distance between points in a
high-dimensional space; thus, with low entropy, newly added points do not tend to be far from all existing points. For genomic sequences, the distance function can be edit
distance; for chemical graphs, it can be Tanimoto distance; and for general vectors, it can be Euclidean or cosine distance. We are interested in the similarity search
problem of finding all points in a set that are close to (i.e., similar to) the query point.
Let us first consider what it means for a large biological dataset, considered as
points in a high-dimensional space, to be highly redundant. Perhaps many of the points are exact duplicates; this easy scenario is trivially exploited by de-duplication
and is already standard practice with datasets such as the NCBI's non-redundant (NR) protein database [43]. Maybe the points mostly live on a low-dimensional
subspace; statistical tools such as Principal Component Analysis (PCA) exploit this property in data analysis. Furthermore, if the dimension of the subspace is sufficiently
low, it can be divided into cells, allowing quick similarity searches by looking only at
nearby cells [40]. However, when the dimensionality of the subspace increases, cell
search time grows exponentially; additionally, in sparse datasets, most of the cells will be empty, which wastes search time.
I
--.
e.
-Queries Database bA A S A S A S Queries Datab A 0 A 0 A S A S A 0 A 0 Queries D~ d . 4. atabaseFigure 2-1: Entropy-scaling framework for similarity search. (A-D) As shown, (A) The
naive approach tests each query against each database entry to find entries within distance
r of the query (inside the small green disc). (B) By selecting appropriate cluster centers with maximum radius rc to partition the database, we can (C) first do a coarse search to find all cluster centers within distance r + rc of a query (larger green disc), and then the
(D) triangle inequality guarantees that a fine search over all corresponding cluster entries
(blue polygonal regions) will suffice.
38
a
...
-
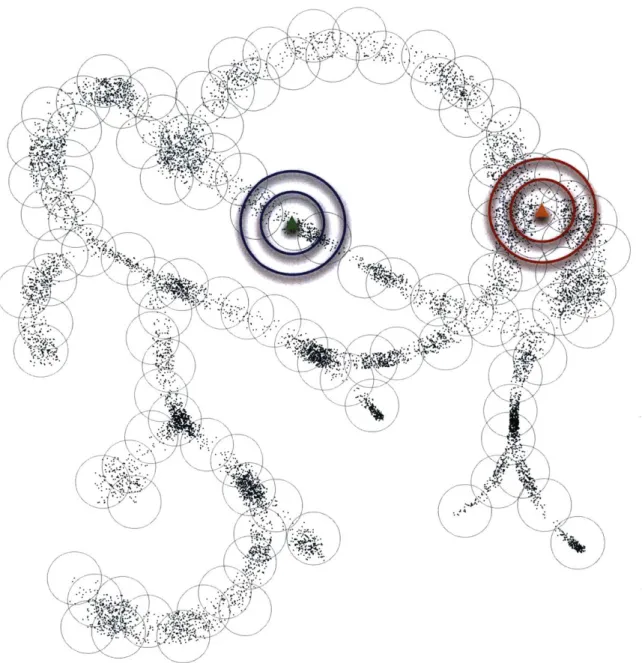
Figure 2-2: Cartoon depiction of points in a high-dimensional space. This cartoon depics points in an arbitrary high-dimensional space that live close to a one-dimensional tree-like structure, as might arise from genomes generated by mutation and selection along an evolutionary tree of life. Although high-dimensional at a fine scale, at the coarser scale of covering spheres, the data cloud looks nearly one-dimensional, which enables entropy-scaling of similarity search. The cluster center generation was performed using the same method we used for protein structure search. The blue circles around the green query point illustrate low fractal dimension: the larger-radius circle contains only linearly more points than the smaller one, rather than exponentially more. In contrast, the red circles around the orange query point illustrate higher local fractal dimension.
More importantly, biological datasets generally do not live in low-dimensional subspaces. Consider the instructive case of genomes along an evolutionary "tree
of life" (Figure 2-2). Such a tree has many branches (although admixture merges branches back together), and looks nearly one-dimensional locally, but it is globally
of higher dimension. Additionally, because of differences due to mutation, each of the branches is also "thick" (high dimensional) when looked at closely. Viewing this example as a low-dimensional subspace, as in PCA, is incorrect.
However, the local low-dimensionality can be exploited by looking on the right
scales: a coarse scale in which the tree looks one-dimensional locally and a fine scale where the branch width matters. We cover the tree with spheres (Box 1) of radius rc,
where r, is on the order of the branch width; these spheres determine our clusters,
and the number of them is the metric entropy of the tree
[44].
Because all the points within a sphere are close to each other, they are highly redundant and can be encoded in terms of one another, saving space.By the triangle inequality, in order to search for all points within distance r of
a query, we need only to look in nearby spheres with centers (i.e., representatives) within a distance r + r, of the query (Figure 2-iD). However, because each sphere has a radius comparable to branch width, the tree is locally one-dimensional on the coarse scale; that is, spheres largely tend to extend along the branches of the tree rather than in all directions. We will call this property of local scaling the fractal dimension d of the tree at the scale r, [45], where r, is essentially our ruler size and d = 1. Thus, increasing the search radius for coarse search only linearly increases the
number of points that need to be searched in a fine search.
A similar analysis holds in the more general case where d
$
1. The entropy-scalingframeworks we introduce can be expected to provide a boost to approximate search when fractal dimension d of a dataset D is low (i.e., close to 1) and metric entropy
|ID|
k is low. Specifically, the ratio provides an estimate of the acceleration factor k
for just the coarse search component compared to a full linear search of a database D. Local fractal dimension around a data point can be computed by determining the number of other data points within two radii r1 and r2of that point; given those
point counts (ni and n2, respectively), fractal dimension d is simply d - log(n2/n) log(r2/ri)
Sampling this property over a dataset can provide a global average fractal dimension. When we search a larger radius around a query, the number of points we encounter grows exponentially with the fractal dimension; low fractal dimension implies that this growth will not obviate the gains provided by an entropy-scaling data structure. More formally, given a database with fractal dimension d and metric entropy k at the scale rc, we show in the Supplemental Methods that the time-complexity of similarity search on database D for query q with radius r is
output size
0 k BD (qr)jr2c)
metric entropyI /
scaling factor
Thus, for small fractal dimension and output size, similarity search is asymptotically linear in metric entropy. Additionally, because the search has to look at only a small subset of the clusters, the clusters can be stored in compressed form, and only decompressed as needed, giving space savings that also scale with entropy. The space-complexity scales with the sum of metric and information-theoretic entropy, rather than just metric entropy (Supplemental Methods: Theory).
2.3.2
Practical application of entropy-scaling search
We have presented the simplest such data to analyze for clarity of exposition. How-ever, real data is generally messier. Sometimes the distance function is not a metric, so we lose the triangle inequality guarantee of 100% sensitivity; sometimes different dis-tance functions can be used for the clustering versus search; and sometimes even what counts as a distinct data point is not entirely clear without domain knowledge (for example, long genomic sequences might be better broken into shorter subsequences).
To show that entropy-scaling frameworks are robust to the variations presented
by real data, we explored a diversity of applications from three major biological "big
challenges of big data"-pharamaceuticals, metagenomics, and protein structure [2]. We demonstrate that the general scheme results in order-of-magnitude improvements
in running time in these different contexts, promising to enable new workflows for practitioners (e.g., fast first-pass computational drug screens and .local analyses of sequencing data in remote field sites for real-time epidemic monitoring). These ap-plications are enabled by augmenting the framework with domain-specific distance
functions in different stages of the process, as well as preprocessing to take
advan-tage of domain-specific knowledge. We expect that as long as the dataset exhibits both low entropy and low fractal dimension-and this is empirically true in biological systems-our entropy-scaling framework has the potential to achieve massive speedup over more naive methods and significant speedup even over other highly optimized
methods.
Source code for the applications discussed here is available at http://gems. csail.mit .edu and in the Supplemental Information.
2.3.3
Application to high-throughput drug screening
Chemogenomics is the study of drug and target discovery by using chemical com-pounds to probe and characterize proteomic functions
[17].
Particularly in the field of drug discovery and drug repurposing, prediction of biologically active compounds is a critical task. Computational high-throughput screening can eliminate many com-pounds from wet-lab consideration, but even this screening can be time-consuming. PubChem [46], a widely-used repository of molecular compound structures, has grown greatly since 2008. In July 2007, PubChem contained 10.3 million compounds. In October 2013, PubChem contained roughly 47 million compounds, while in December 2014 it contained 61.3 million compounds.We designed this compression and search framework around one of the standard techniques for high-throughput screening of potential drug compounds, the use of maximum common subgraph (MCS) to identify similar motifs among molecules [47, 20]. We introduce Ammolite, a method for clustering molecular databases such as PubChem, and for quickly searching for similar molecular structures in compressed space. Ammolite demonstrates that entropy-scaling methods can be extended to data types that are not inherently sequence based. Ammolite is a practical tool that
provides approximately a factor of 150 speed-up with greater than 92% accuracy compared to the popular small molecular subgraph detector (SMSD) [20].
An MCS-based search of molecule databases typically matches pairs of molecules
by Tanimoto distance [20]. Tanimoto distance obeys the triangle inequality and is
more useful in the domain of molecular graphs than other distance metrics such as graph distance [48].
To compress a molecule database, we project the space of small molecules onto a subspace by removing nodes and edges that do not participate in simple cycles (Figure
S2); note that a molecule without cycles will collapse to a single node. Clusters are
exactly pre-images of this projection operator (i.e., all molecules that are isomorphic after simplification form a cluster). Coarse search is performed by finding the MCS on this much smaller projection subspace. This step increases speed by reducing both the required number of MCS operations and the time required for each MCS operation, which scales with the size of the molecule. Further reduction in search time is accomplished by grouping clusters according to size of the molecules within; because Tanimoto distance relies on molecule size, clusters containing molecules significantly larger or smaller then the query need not be searched at all.
The time required to cluster a large database such as PubChem is, nonetheless, significant; clustering the 306-GB PubChem required approximately 400 hours on a 12-core Xeon X5690 running at 3.47GHz, and required 128 GB RAM. However, this database can easily be appended to as new molecules become available, and the clustering time can be amortized over future queries. It is worth noting that the pre-processing of molecular graphs can cause the triangle inequality to be violated; while the distance function is a metric, the clustering does not respect that metric. Ammo-lite can be readily incorporated into existing analysis pipelines for high-throughput drug screening.
Our entropy-scaling framework can be applied to PubChem because it has both low fractal dimension and low metric entropy. In particular, we determined the mean local fractal dimension of PubChem to be approximately 0.2 in the neighborhood between 0.2 and 0.4 Tanimoto distance, and approximately 1.9 in the neighborhood