HAL Id: hal-03153293
https://hal.archives-ouvertes.fr/hal-03153293
Submitted on 26 Feb 2021HAL is a multi-disciplinary open access archive for the deposit and dissemination of sci-entific research documents, whether they are pub-lished or not. The documents may come from teaching and research institutions in France or abroad, or from public or private research centers.
L’archive ouverte pluridisciplinaire HAL, est destinée au dépôt et à la diffusion de documents scientifiques de niveau recherche, publiés ou non, émanant des établissements d’enseignement et de recherche français ou étrangers, des laboratoires publics ou privés.
Chemical Interactions at the Al/Poly-Epoxy Interface
Rationalized by DFT Calculations and a Comparative
XPS Analysis
Kanika Anand, Thomas Duguet, Jérôme Esvan, Corinne Lacaze-Dufaure
To cite this version:
Kanika Anand, Thomas Duguet, Jérôme Esvan, Corinne Lacaze-Dufaure. Chemical Interactions at the Al/Poly-Epoxy Interface Rationalized by DFT Calculations and a Comparative XPS Analysis. ACS Applied Materials & Interfaces, Washington, D.C. : American Chemical Society, 2020, 12 (51), pp.57649-57665. �10.1021/acsami.0c19616�. �hal-03153293�
OATAO is an open access repository that collects the work of Toulouse
researchers and makes it freely available over the web where possible
Any correspondence concerning this service should be sent
to the repository administrator:
[email protected]
This is an author’s version published in:
http://oatao.univ-toulouse.fr/27430
To cite this version:
Anand, Kanika
and Duguet, Thomas
and Esvan, Jérôme
and
Lacaze-Dufaure, Corinne
Chemical Interactions at the Al/Poly-Epoxy Interface
Rationalized by DFT Calculations and a Comparative XPS Analysis. (2020)
ACS Applied Materials and Interfaces, 12 (51). 57649-57665. ISSN 1944-8244
Chemical Interactions at the Al/Poly-Epoxy Interface Rationalized by
DFT Calculations and a Comparative XPS Analysis
Kanika Anand,*
Thomas Duguet, Jérôme Esvan, and Corinne Lacaze-Dufaure
ABSTRACT: A metal−polymer interface is pertinent to numer ous technological applications, especially in spatial sectors. The focus of this work is to elaborate on the metallization process of the poly epoxy surface with aluminum thinfilms, using atomistic details. To this end, X ray photoelectron spectroscopy (XPS) under ultrahigh vacuum and density functional theory calculations are employed. The interfacial bonding between Al atoms and the poly epoxide surface, represented by a dimer model, is studied by determining adsorption energies and by simulating XPS spectra. The latter simulations are mainly performed using the ΔKS method, taking into account the initial and thefinal state effects. Simulated atom by atom metal deposition on model epoxy systems is attempted to further elucidate energetics of metallization and
preferential arrangement of metal atoms at the interface. A fair agreement obtained between XPS experiments and computations rationalizes the interaction mechanism at the atomic scale explaining the formation of the Al/poly epoxy interface. Electronic structure properties highlight the charge transfer from the Al atom(s) to dehydrogenated model epoxy system.
KEYWORDS: epoxy polymers, metal vapor deposition, metal−polymer interface, X ray photoelectron spectroscopy, adsorption, interaction energies, density functional theory, electronic structures
1. INTRODUCTION
Design and tuning of the metal−polymer interface have enabled many technological advancements in the fields of microelectronics, automobile, aerospace, catalysis, and nano medicine.1−7In general, metals and polymers have contrasting properties inducing curiosity about nature of bonds at the interface.8 From the past few decades, combined research efforts (both experiment and theory) have been converged on understanding polymer deposition on metal or metal oxide surfaces.9−15On the other hand, metal deposition on polymer surfaces at nanoscale for low regime coverage is still not entirely understood.8,16A useful dimensionless parameter that characterizes the metal−polymer interaction is the condensa tion coefficient, C = nads/ntot, which is defined as the number of
adsorbed atoms (nads) per total number of impinging atoms
(ntot). The value C has been experimentally determined to
elucidate the interaction between noble metal atoms and the cured epoxy surface.17,18 Epoxy polymers and their new derivatives have desirable properties such as high temperature and chemical stability, rapid curing potential, and self healing ability which are applicable in communication systems, wind turbines, and so forth.19Metallization of such epoxy polymers have found interest in high performance applications, to withstand drastic conditions.20 Kanzow et al. have described initial stage metalfilm growth in the case of noble metals such
as Cu, Au, and Ag, which proceeds via Volmer−Weber (cluster) mode.18 Also, at the initial stage of the metal layer formation, a phenomenological approach of progressive chemisorption of Al metal atoms on epoxy resin surfaces is proposed. Furthermore, oxygen atoms belonging to hydroxy or ether groups are suggested as the most probable bonding partners. Indeed, Al among other reactive metals (M) such as Mg, Ca, Cr, Fe, and Ni, is known to form stable oxides and to create strong (M−)O−C bonds.21−25
It has been demonstrated that the strength of the metal reactivity cannot be a sole factor dictating neither the interaction at the metal−polymer interface nor the film growth mechanism.26−28 Therefore, the support from theoretical calculations can be crucial to comprehend the experiments related to the metal−polymer interface. A complete description of interfacial bonding at the Al/polyethylene terephthalate (PET, thermoplastic) interface is made possible by combined efforts from experiments (X ray photoelectron spectroscopy,
XPS) and quantum chemical (Hartree−Fock, HF) calcu lations.29 However, Al/epoxy polymers have been rarely explored using theoretical approaches. Recent work on Cu/ poly epoxy (ref 20) has combined the surface science techniques and density functional theory (DFT) calculations to reveal the interfacial bond formation. This combined approach is further extended for the Al/poly epoxy interface while addressing the open questions implied from above discussion. The present study highlights two primary objectives: (i) to understand the local interactions of Al atom(s) with the model epoxy substrate within DFT formalism, accounting for electronic effects; (ii) to expand on the current knowledge of controlled metallization of epoxy based 3D cross linked polymers,30−32 through theoretical insights.
In this work, we analyze experimentally a buried interface of Al/poly epoxy through ex situ XPS under ultrahigh vacuum (UHV) and atomic force microscopy (AFM) under ambient conditions. Interaction of one Al atom with representative epoxy models is then rendered to identify adsorption sites. We propose a simulated atom by atom deposition on the considered epoxy model systems, constraining to a few adsorbed atoms as we are limited by the size of the model systems. The present study elaborates on metallization energetics to understand experimental XPS results on the buried Al/poly epoxy interface. Further, the charge transfer at the model interface is elucidated. A suitable molecular model is determined through a comparative experimental/theoretical XPS analysis, which is then helpful in revealing interactions at the Al/poly epoxy interface. The discussion section attempts to address some open questions risen in previous works18,20 and to illustrate the electronic structure of model epoxy validated by experimental XPS.
2. METHODOLOGY
2.1. Experimental Details. 2.1.1. Preparation of Poly-Epoxy Layer. In an Ar glovebox, the stoichiometric quantities (2:1) of epoxy resin, diglycidylether of bisphenol A (DGEBA), and curing agent, ethylene diamine (EDA), were slowly mixed in a nonreactive flask to prepare poly epoxy. Then, the clear viscous liquid was placed on the Si wafer to form a thick layer and then left for 24 h for slow polymerization at room temperature. A sufficient thick layer (>300 μm) is required to avoid polymer/Si interphase formation.33−36A couple of hours of postcuring was performed to ensure the depletion of amine from the mixture above the glass transition (140 °C) temperature. This complete procedure is detailed in refs18,36 and is effective in limiting defects at the surface and in the bulk of the polymer film. The thickness of poly epoxy layer measured using profilometer is 657 μm.
2.1.2. Metallization under UHV. Several tests were performed to calibrate Al source deposition parameters such as source current because of the elemental low partial pressure of aluminum. A pure Al (99.999%) thread was placed in a molybdenum crucible. An e beam evaporator (Mantis M EV) was used in a chamber with a base pressure of 3.0 × 10⁻¹⁰ mbar. During deposition (8 min) at room temperature, the base pressure remained in low 10−9mbar for a source current of 29.5 nA (at 39.9 W). Thus, a uniform and pure thinfilm of Al was deposited on the pristine polymer surface.
2.1.3. Ex Situ XPS. XPS experiments under UHV were performed with Thermo Scientific K Alpha apparatus using a monochromated Al Kα (EAl Kα= 1486.6 eV) X ray source. The
pass energy wasfixed at 30 eV with a step size of 0.1 eV for core levels. The spectrometer energy calibration was done using the Au 4f7/2(83.9± 0.1 eV) and Cu 2p3/2(932.8± 0.1 eV) photoelectron lines. Flood gun was used to avoid charging effects at the surface. Ion etching was performed with Ar+ions
(1 keV, 10 μA, raster area of 2 mm2) to remove the surface contamination during the transfer to the XPS apparatus and to reach the buried interface. For the latter, we monitored the recovery of metallic aluminum by analyzing the relative intensities of adjacent aluminum oxide and metal aluminum peaks. The shape of the metallic Al 2p peak is also compared with the reference Al foil. The C 1s peak was also constantly monitored. After 110 s of sputtering and careful evaluation of line as well as survey spectra, we could assume that C 1s and O 1s signals originated from the carbon and oxygen of the poly epoxy, respectively, buried underneath the Alfilm. Therefore, we were able to investigate the interface and evaluate the interfacial bonding throughfine decomposition of C 1s and O 1s peaks. For the peak analysis in the present work, a Shirley background was systematically subtracted. Thermo Avantage V. 4.53 was used forfitting and quantification of XPS data.
2.1.4. Atomic Force Microscopy. AFM measurements were performed on Alfilm deposited on the epoxy polymer under ambient conditions using Bruxer Dimension Icon with ScanAsyst, Dektak XT. Peak force tapping control mode was used with a silicon tip (on nitride lever) of k = 0.4 N/m (Bruxer’s model: ScanAsyst Air). The image scanning rate was 0.99 Hz. Post processing of AFM images was achieved through Gwyddion (version 2.56), a scanning probe microscopy tool.
2.2. Computational Details. A molecular (dimer) model was considered to describe the poly epoxy surface (Figure 1).
It is composed of one monomer of epoxy, DGEBA, and one monomer of amine, EDA, linked to each other by opening of one oxirane to form a hydroxy group and a C−N bond between them. We considered two models to perform our systematic study of the Al/epoxy polymer interface. One is the native dimer (D) model and other is dehydrogenated dimer (DwH) model obtained by removing hydrogen atom belonging to the hydroxy group, highlighted by the dashed red circle inFigure 1. For DFT calculations (adsorption study or XPS simulation), we took into account only the branch of the epoxy monomer which is attached to the EDA monomer, that is representative of the poly epoxy. The other side is not relevant as it contains the unreacted epoxy group.
2.2.1. Al Adsorption Sites. Many sites were considered for the adsorption of one Al atom on the substrate models. A few
Figure 1.Optimized geometry of dimer (D) model. Encircled H atom is removed in the DwH model. Color code for atoms: C = orange, O = red, N = cyan, H = white; this color code is applicable throughout the present work.
of these adsorption sites (Oe; Oh; N) are marked inFigure 1. Various geometries were fully optimized using the Berny algorithm in Gaussian 09.37 The gradient corrected PBE functional38with and without empirical dispersion correction (GD3)39 was used along with basis set 6 31+G*,40,41that is, polarization and diffusion functions in addition to the set. Also, the calculations were performed using PBE D3 in combination with large basis set def2TZVP.42,43A frequency analysis was carried out to characterize the stable geometries as minima which was followed by natural bond orbital (NBO) charge analysis.44We denote model epoxy systems in interaction with a single Al atom as Al/D or Al/DwH models (Section 3).
2.2.2. Simulated Atom by Atom Deposition. Energetically most stable sites were identified for adsorption of a single Al atom on the proposed substrate models and then atom by atom deposition was executed. In this process, after each new addition of the Al atom, we fully optimized the metal/organic structures. This approach is valuable for understanding interaction or bonding mechanism at the interface as proposed in ref20. These DFT calculations were performed at the PBE D3/def2TZVP level of theory, accompanied by additional NBO charge analysis. Models showing interaction of more than one Al atom with epoxy substrates are denoted as Aln/D or Aln/DwH (n = 2−4).
2.2.3. XPS Calculations. Fully optimized geometries obtained using Gaussian 09 were used as input to XPS calculations. These calculations were performed within the framework of ΔKS45−47 using deMon2K code.48 Full reoptimization of molecular structures was again performed using the PBE functional, relativistic basis, and effective core potentials (RECP/SD)49 for all atoms excluding H atoms (DZVP) and GENA2 auxiliary functions.50On the most stable Al/D and Al/DwH geometries, simulation of XPS spectra was performed. It accounts for both initial (neutral) and final (ionized) state of the system that can be described as follows: 1. Single point (SP) energy calculations on the optimized geometry of the nonionized system, to obtain the total energy of the system, by using all electron potential and augmented basis set (AUG CC PVTZ)51for the atom of interest, that is, C* denoted hereafter.
2. Similarly, SP calculations for the ionized system with no electron in theα molecular orbital (MO) of the core− shell of C*.
3. Finally, the binding energy (BE) was calculated using theΔKS theory45−47and mathematically represented by the following equation
E E
BE= neutraltot − ionizedtot (1)
where Eneutraltot and E ionized
tot are the total energy values of neutral
and ionized systems, respectively. The core level chemical shifts (ΔBE) were calculated relative to the lowest BE of the data set. The calculatedΔBE values were used to compose the simulated spectrum, which was then compared with the experimental spectrum.
Additionally, results of calculated BE using the uGTS method as described in52−54 are available in Supporting Information.
3. RESULTS
3.1. XPS Analysis: C 1s Spectra. Normalized exper imental C 1s spectra of the clean epoxy surface (in red) and with Al deposition after 110 s of etching (asfilled area) are
presented inFigure 2. The pristine C 1s peak of the poly epoxy surface consists of three prominent components.20,55A main
peak centered at a BE of 284.6 eV arises from aliphatic C or aromatic C contributions. A high BE shoulder (at 286.3 eV) presents C−O components and a π−π* shake up satellite at 291.2 eV.
In the present work, the simulated C 1s spectrum of the representative dimer model using theΔKS method is shown in Figure S1and the calculated chemical shift values using both ΔKS and uGTS methods are gathered in Table S1. These values are similar to the previously simulated C 1s using pristine epoxy dimer.20Also, the experimental O 1s spectrum (black line) of pristine epoxy surface along with the simulated envelope (gray line) using the ΔKS method is presented in Figure S2.
After Al deposition, differences from C 1s of the pristine surface are marked by the diminishing intensity of the high BE shoulder, disappearance of shake up satellite, and the appearance of amorphous carbonaceous components around low BE (282.5 eV) values. The three effects are observed on several heteroatom (N,O) containing polymer surfaces after metal vapor deposition.24,56,57
On comparing the normalized C 1s spectra of Cu/poly epoxy and Al/poly epoxy buried interfaces (Figure S3), wefind almost similar peak shapes. Only a slight slant broadening of the main C 1s peak at the disappeared high BE shoulder peak value can be spotted in the case of Al/poly epoxy in comparison to the Cu/poly epoxy buried interface. Because Al is known to be more reactive than Cu atoms, it requires more understanding to explain similarities in their behavior at the interface. Earlier works attempted to correlate distinct aspects of the metal−organic interface with known properties of metal or organic atoms.16,58It can be simply condensation energies (Ecoh) of metal (for e.g., EcohAl = 3.420 eV/atom & EcohCu
3.472 eV/atom59) or diffusion behaviors at the interface.24,58 Thus, a possible explanation can be the lower reactivity of Cu being counterbalanced by its diffusivity into the surface to react with more nucleation sites, whereas Al is reactive but does not diffuse into the polymeric surface. This may imply similar C 1s peaks after deposition of the (Cu or Al) metallicfilm up to 10 nm thickness. We also observed attenuation of overall intensity of C 1s peaks in both cases which can either be explained as
Figure 2.C 1s spectra of the clean (red curve) and Al covered (filled area) poly epoxy surface.
long exposure to metal vapor deposition24or to be character istic of cluster growth as suggested in ref 56 for low metal coverage.
We present Al 2p and O 1s spectra, obtained after 110 s of etching of the Al film, in Figures S4 and S5 of Supporting Information. We observe the oxidized Al peak at 74.1 eV and metal like Al peak at 71.1 eV. The shift with respect to a typical metallic Al peak (72.5 eV18) can be attributed to the presence of Al clusters at the initial stage of a metal overlayer growth.29 On probing a buried interface, we obtain a rather sharp oxygen peak centered at 531.5 eV. This position of O 1s is known to correspond to the formation of Al−O−C bonds.56
3.2. XPS and AFM: Al/Poly-Epoxy. In this work, we are analyzing the buried interface which is accessed by sputtering the Al film deposited on poly epoxy. We find that soft sputtering (1 keV, 10μA, 110 s) is appropriate: (i) to remove surface pollution (from exposure to air) and (ii) to obtain a good signal of Al(0) 2p (from Alfilm) and C 1s (from poly epoxy substrate). A good intensity of the C 1s peak points to the fact that Alfilm thickness must be less than or equal to 9.4 nm, that is, three times the inelastic mean free path (IMFP orλ = 3.1 nm60) of Al photoelectrons with a kinetic energy of 1416 eV. Further, characterization of the surface of the Alfilm with AFM provides its morphological aspects and an approximate estimation to its thickness.Figure 3 shows a 500× 500 nm2
AFM image of the Alfilm.
The morphology of the Al film consists of small islands or bright three dimensional blobs with a maximum height roughness, Sz = 15.61 nm, and peak to peak roughness, Sp = 8.97 nm. We also observe some contrasting dark pits that might point to uncovered substrate zones. However, most of the polymeric substrate is covered with the Alfilm along with its native oxide with mean surface roughness, Sa = 2.04 nm. The concomitant aluminum oxide layer is usually found to be 2−4 nm thick under ambient conditions.61The quantification of Al 2p metal and oxide peak intensities of the Alfilm on the poly epoxy sample (after 110 s of etching) gives surface oxide layer thickness, dXPS(nm) = 2.4 nm, as detailed in refs.61,62
Thus, by combining XPS and AFM analyses, an estimation of Alfilm thickness including contribution from the oxide layer present during XPS and then because of additional exposure to air while performing AFM; in this case, it would be 10± 3 nm.
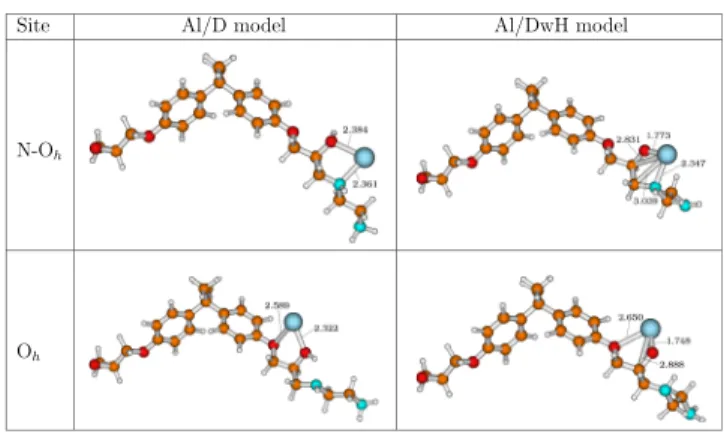
3.3. Metallization Energetics. 3.3.1. One Al Atom on D and DwH Models. To understand adsorption mechanism and metal−organic interactions, we built different metal/molecular structures pertinent to the present study. In Figure 4, fully
optimized Al/D and Al/DwH structures corresponding to the stable sites such as Oh and N Oh (between N and Oh) are illustrated. Optimized bond length values inferior to 3.100 Å are also shown. We have chosen this value as the maximum limit, considering the sum of vdW radii of Al atom and either of the organic atoms (C, O, N), that is, (rvdWAl + rvdWC = 3.54 Å;
rvdWAl + r vdW O = 3.36 Å; r vdW Al + r vdW N = 3.39 Å).63
For D and DwH models, most of the tested initial geometries converged to either of the two configurations, that is, stable sites, Oh and N Oh. Difference in total energy
values of these tested geometries for a particular site of a D or DwH model reaches a maximum value up to 0.010 eV. In the case of the D model, another stable configuration (called as Cph site) is found and is shown in Figure S6. However, the
optimized structure shows a slight deformation of the phenyl ring attached to the Al atom. Similar configuration could not be converged in the case of adsorption of Al on the DwH model at the Cph site. Detailed bond distance analysis with
values (in Å) for all Al/D or DwH models using PBE D3/ (def2TZVP or 6 31+G*) and PBE/6 31+G* functionals is provided in Table S2. The optimized Al−Oh and Al−N
distances for Al/D (site = N Oh) are 2.384 and 2.361 Å, respectively, while Al−Oh and Al−Oe bond lengths for Al/D
(site = Oh) are 2.322 and 2.589 Å, respectively. Here, these bond lengths suggest an ionic−covalent interaction between the Al atom and native dimer model. The sum of covalent radii of these atoms (i.e., rcovAl + rcovC = 1.99 Å; rcovAl + rcovO = 1.88 Å; rcovAl
+ rcovN = 1.95 Å)59,64
is less than 2.000 Å. The optimized Al−Oh bond lengths at N Ohand Ohsites of Al/DwH model are 1.773
and 1.748 Å, respectively. The latter models show short Al−O bond distances which correspond well with values (calc. = 1.70 Å; exp. = 1.76 Å) reported in earlier works.29,65 These bond lengths also indicate covalent bonding between Al and O in the case of Al/DwH models. For Al interaction with Cphenyl,
average Al−Cphenyldistance for the Al/D (site = Cph) model is 2.557 Å and the previously reported value using ab initio HF is 2.06 Å.66 In the case of the Cu/poly epoxy interface,20 avg. Cu−Cphenyl distance was determined to be 1.947 Å. Al
interaction with Cphenyl in the native epoxy dimer has more ionic character rather than pure covalent as also observed in
Figure 3.AFM image (500× 500 nm2) of the Alfilm covering the
poly epoxy substrate.
Figure 4. Optimized metal−organic structures representing inter action of the single Al atom with D and DwH dimer models. Shown bond distance values are in Å at the PBE D3/def2TZVP level of theory. The adsorbed Al atom is depicted as the blue sphere.
the Cu/epoxy study.20Regarding the Al/PET system (ref66), Al−metal interaction with Cphenylwas found to be possible only
for a high metal coverage.
It is important to identify the energetically favorable adsorption sites to comprehend the chemical interactions using Al/D (or DwH) models. Interaction between the Al atom and considered dimer substrate models is defined by the followingeq 2.
Eint=EAl/substratetot −Esubstratetot −E1Alatomtot (2)
where substrate = D or DwH model. EAl/substratetot , E
substrate tot , and E
1 Al atom
tot are the total energies of the
system (one Al atom adsorbed on the substrate D or DwH model), the pristine dimer (D or DwH) model, and an isolated Al atom, respectively.
The adsorption energy (Eads) for Al/D models, with intact hydroxy (−OH) group in their substrate, is same as the interaction energy (Eint) calculated using eq 2. We also considered a scenario in which the native dimer is dehydrogenated (i.e., DwH model) to promote metal adsorption. In such a case, adsorption energy can be determined by considering the dissociation energy of the O− H bond (EdissOH) and the formation energy of the H
2 (Eform H2 )
molecule. Thus, thermodynamically, we can define adsorption energy for the DwH model as
E E E 1E
2
ads int dissOH form H2
= + +
(3)
where Eint is the interaction energy value obtained usingeq 2 for DwH as the substrate model.
In the present work, the bond dissociation energy of the O− H bond is calculated using EdissOH= EDwHtot + E1 H atomtot − EDtot, where
the total energy of the dimer, D model, is subtracted from the sum of the total energies of dehydrogenated, DwH model and single isolated H atom.
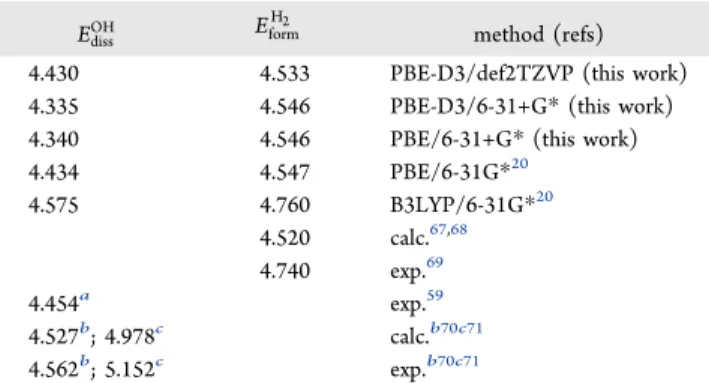
The values of dissociation energy of the O−H bond and formation energy of the H2molecule calculated in this study
and proposed in previous works are gathered inTable 1. In ref
20, these values were calculated using similar molecular structures but different functional and basis sets. The O−H bond dissociation energy in earlier works were reported using CH3O−H or HO−H with ab initio/6 311G(d,p) methods,70,71
and the formation energy of H2was provided using pseudo potentials and GGA methods.67,68The calculated EdissOH(4.430
eV) value (PBE D3/def2TZVP) in this work agrees well with exp. value (4.454 eV).59Although, the O−H bond dissociation energy is sensitive to substituent effects,70 that is, to the molecular system used. In this work, calculatedEformH2 (−4.533
eV) is underestimated compared to the exp. value (−4.740 eV)69but not enough to change thermodynamic conditions.
The values of adsorption energies are presented inTable 2, where all adsorption sites correspond to stable structures for Al adsorption. It is evident from all calculations that there is considerable strengthening in the binding of the aluminum atom on the DwH model compared to the D model. The difference in adsorption energies between the two interface models for the most stable site (N−Oh) is 1.93 eV. In fact, for
energetically less favorable site (Oh), the difference remains approximately same. Clearly, the adsorption of Al is facilitated by the departure of the H atom at the Ohsite, making the Al/
DwH structures the more probable representations from a thermodynamical point of view. For Al/D models, Eint values (as defined ineq 2) corresponding to N−Oh, Cphenyl, and Oh sites are −0.865, −0.727, and −0.584 eV, respectively. Even when considering either the def2TZVP or 6 31+G* basis set with the PBE D3 functional and PBE/6 31+G*, the order of energetic preference remains N Oh > Cphenyl> Oh. Similarly, for the Al/DwH system, calculated Eint values (from eq 2),
using the PBE D3/def2TZVP (or 6 31+G*) basis set, for N Oh and Ohsites are −4.958 (−4.872) and −4.762 (−4.668) eV, respectively. On using PBE/6 31+G* for Al/DwH models, we obtain Eintvalues equal to−4.813 and −4.577 eV at N Oh
and Ohsites, respectively. Comparison between PBE/6 31+G*
and PBE D3/6 31+G* using calculated Eint values highlights
the increase in interaction on considering van der Waal forces (empirical dispersion) at the Al/epoxy interface. There is a conspicuous stronger interaction of the Al atom with the DwH than with the native dimer model. For Al/D models, bond lengths are greater than the sum of covalent radii of atoms in interactions and Eintvalues less than−1.000 eV which suggest
physisorption. However, the Al atom is chemisorbed on the DwH model on taking into account both bond analysis and energetics. Between the two stable sites (N Oh and Oh) identified for a given Al/D or Al/DwH model, an adsorption energy difference (ΔEads) is up to 0.28 eV. It implies a small
energy anisotropy at the Al/epoxy interface when compared to the difference being 0.65 eV for the Cu/epoxy interface20 considering the similar sites.
In Table 2, the NBO charges for the Al atom (QAl) are
shown, using PBE D3/def2TZVP or 6 31+G* and PBE/6 31+G* functionals. We observe a little to no charge transfer at N Ohand Ohsites of Al/D models. However, in particular, the Al atom has a net positive charge +0.66 e at the Cphenylsite
which illustrates its oxidized state. In the case of Al/DwH, Al atoms corresponding to N Ohand Ohsites have +0.71 e and +0.78 e charges, respectively. This is in accordance with less electronegativity of the Al (1.61) atom compared to organic atoms such as O (3.44), N (3.04), and C (2.55); here, bracket values are electronegativity at Pauling scale.59 The previous work on the Al/epoxy polymer interface also suggests Al atoms as the e donor while atoms in its vicinity as the e acceptor.8 Also, for the Al/PET interface (ref29), an average charge of +0.55 e was found on Al atoms, considering various geometries. NBO charge analysis underlines physisorption for Al/D models and chemisorption for Al/DwH models at N Ohand Ohsites.
Table 1. Dissociation Energy (eV) of O−H Bond and Formation energy (eV) of the H2Molecule
EdissOH Eform
H2
method (refs)
4.430 4.533 PBE-D3/def2TZVP (this work)
4.335 4.546 PBE-D3/6-31+G* (this work)
4.340 4.546 PBE/6-31+G* (this work)
4.434 4.547 PBE/6-31G*20 4.575 4.760 B3LYP/6-31G*20 4.520 calc.67,68 4.740 exp.69 4.454a exp.59 4.527b; 4.978c calc.b70c71 4.562b; 5.152c exp.b70c71
aMolecule used: O−H.bMolecule used: CH
3O−H.cMolecule used:
Table 2. Adsorption Energies (in eV) and NBO Charges (in e) on the Al Atom
adsorption site aE
ads bEads cEads aQAl bQAl cQAl
Al/D N Oh 0.865 0.914 0.830 0.08 0.07 0.06
Oh 0.584 0.624 0.519 +0.02 +0.00 +0.00
Cphenyl 0.727 0.675 0.628 +0.66 +0.65 +0.64
Al/DwH N Oh 2.795 2.810 2.746 +0.70 +0.71 +0.71
Oh 2.599 2.605 2.511 +0.79 +0.78 +0.78
aAt the PBE D3/def2TZVP level of theory.bAt the PBE D3/6 31+G* level of theory.cAt the PBE/6 31+G* level of theory.
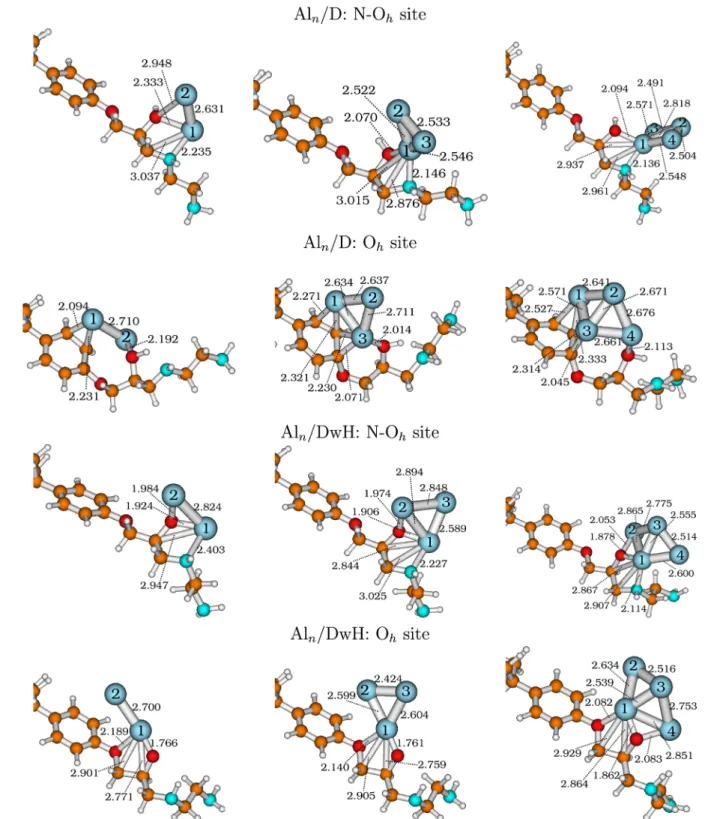
Figure 5.Most stable geometries (fully optimized) of the Alnclusters adsorbed on D and DwH models at their N Ohand Ohsites, respectively.
In the following sections, we present an evolution of metal− organic interaction on increasing the number of Al atoms at the model interface as well as the impact on charge transfer at the interface.
3.3.2. Interaction Energy: Aln/D or DwH Models. We
present inFigure 5the most stable Aln/D or DwH structures (n = 2−4) for both N Ohand Oh sites, fully optimized using
PBE D3/def2TZVP. In Aln clusters, the nearest neighbor
distances as well as their distances with substrate atoms at N Oh and Oh adsorption sites are also depicted in Figure 5. The average distances are 2.705 and 2.728 Å in Al2at N Oh
and Oh sites, respectively, of Aln/substrate models. In
theoretical studies dedicated to Aln clusters (refs72,73), the bond length of Al2dimer is found to be 2.860 Å (exp. value =
2.700 Å74) with a BE of 0.716 eV/atom. For Al3clusters at the N Oh (or at Oh) site, the avg. nearest neighbor distances are
2.534 (2.661) and 2.777 (2.542) Å corresponding to Al3/D and Al3/DwH models, respectively. In our case, Al3clusters are
either nearly isosceles or equilateral triangles, as reported in previous works72,73,75with an avg. nearest neighbor distance of ∼2.61 Å. The stable Al4clusters are usually described as nearly
rhombus or parallelogram72,75with each side equal to (2.520− 2.720) Å. Wefind distorted parallelograms (avg. edge value ∈ {2.529−2.689} Å) for Al4clusters as their geometries are quite
influenced by the presence of the substrate dimer. In this work, we are mainly interested in understanding the metal cluster interaction with polymeric substrates.
There are several possible ways to define interaction energy between the metal cluster Alnand the polymeric substrate (D
and DwH) representations. Ineq 4, Interaction energy (Eint1)
defines interaction of isolated Al atoms (present ensemble) on the substrate, considering Al−Al interaction, but without defining Al atoms as a single entity (or a group).
Eint1 EAl /substratetot Esubstratetot n E1Alatomtot
n
= − − × (4)
whereEAl /substratetot
n is the total energy of the system consisting of
n Al atoms on the dimer (D or DwH) model.
The other definition for interaction energy (Eint2) can be
Eint2 EAl /substratetot EAltot Esubstratetot
n n
= − − (5)
where EAltot
n is total energy of the isolated Alncluster in vacuum
withfixed geometry, obtained when adsorbed on D or DwH model (SP calculation).
Eint2 interaction energy supposes the group of Al atoms as
one entity (or Alncluster), and therefore, it can also be written as Eint2=Eint1− ΔHfAln, where H
f Aln
Δ is entahlpy of formation of Aln species in vacuum. To calculate ΔHfAln, we
consider frozen cluster geometries (imposed by the dimer) in vacuum (Table S4). These two definitions of interaction energy take the total energy (Esubstratetot ) of pristine dimer (D or
DwH) as the reference value.
The formalism of Eint3 is driven by the atom by atom deposition, where each time the reference system (Aln−1/
Figure 6.Interaction energies for simulated atom by atom deposition at the N Ohsite (left) and Ohsite (right), using fully optimized geometries of
substrate) precedes the current system (Aln/substrate). Thus,
it represents evolution of interaction energy at the Al/epoxy interface.
Eint3=EAl /substratetotn − EAltotn 1−/substrate−E1Alatomtot (6)
whereEAl /substratetotn and EAltotn 1−/substrateare total energies of n and (n− 1) atoms of aluminum adsorbed on the substrate (D or DwH) model, respectively.
The results of interaction energy calculations are presented inFigure 6 corresponding to both N Oh and Ohsites of the
considered models, that is, Aln/D and Aln/DwH, where n∈ {1−4}. The interfacial interaction between Al atoms and substrate models at N Oh and Oh sites of the substrate is evaluated. This provides insights into local chemical inter action of metal with two highly electronegative atoms (O, N), also, known to bond strongly with aluminum. Globally, we observe increase in strength of interaction on adding more Al atoms with respect to one Al atom on the substrate (D or DwH) structures, as indicated by Eint1 (blue open circles) values. It is expected because metal−metal interactions are
strong in comparison to metal−organic exchanges8,16 and favors the stability of the system. This trend is relevant to the two sites, one representing a hetero environment (N Oh) while
the other (Oh) demonstrates interactions with mainly oxygen
atoms. However, Eint1/n values show contrasting behavior between Aln/D and Aln/DwH models. It is evident that adding
more Al atoms on the D model increases the binding strength per atom (Eint1/n), while there is an almost reverse trend for
adsorption on the DwH model. It illustrates that the dehydrogenation process accelerates the interaction mecha nism to a saturation value per atom which decreases upon adding of more atoms. We observe a muchflatter energy (Eint2
red open squares) evolution in terms of size of clusters than the former case. Clearly, the interaction energy at the N Ohsite
for Aln/DwH models is much stronger (Eint2range up to−5.4
eV approx.) than for Aln/D models (Eint2range up to−1.8 eV).
Similarly, at the Ohsite, Eint2values vary up to−4.9 eV approx.
and −1.5 eV approx. for Aln/DwH and Aln/D models,
respectively. Thus, energetically, N Oh still remains the
preferred interaction site for the formation of the Al/epoxy interface. Further, we can infer from Eint2 values that pairing
(or adhesion) between Al atoms as the dimer is favored at both sites of Aln/D and Aln/DwH models. Previous theoretical
works29,66,76 on the Al/polymer interface preferred only Al dimer adsorption on simple polymeric models.On considering atom by atom deposition, the evolution of interaction energy is gauged with respect to a system (Aln−1/substrate; n∈ {2−4}) already in interaction with metal atoms. The Eint3values (green
crosses) show difference in behavior of dimer (D and DwH) models on a gradual coverage by Al atoms. For the Aln/D
system, where n ∈ {2−4}, the interaction increases with respect to the Al/D model, like the presence of one Al atom facilitates further evolution at the interface. The Eint3 values
range up to−2.7 and −1.9 eV approx. at N Ohand Ohsites of Aln/D models. The Al/DwH model illustrates the maximum
interaction as the reactivity at its interface is facilitated by the dehydrogenation. However, further addition of Al atoms reduces the interaction energy (Eint3) to −3.0 and −2.3 eV
approx. at N Ohand Ohsites of Aln/DwH models, respectively. It is in accordance with explanation using Eint1/n values.
It can be deduced from this interaction energy analysis that Aln/DwH models represent a higher interaction of Al atoms
with the epoxy substrate than Aln/D models. However, with
more number of aluminum atoms (>4), the interaction mechanism (Eint1/n and Eint3) represented by Aln/DwH and
Aln/D models might be similar. All interaction energy values are also provided (Table S3) inSupporting Information.
3.3.3. Charge Transfer at the Interface. Our study reveals charge transfer at the Al/polymer interface to be mostly local, restricted to second neighbors of adsorbed Al atoms. The results of charge analysis using the NBO method are presented inFigure 7for fully optimized Aln/substrate models (Figure 5)
at N Oh(upper panel) and Ohsites (lower panel), respectively.
We show inFigure 7(upper left) net charges (Q) on N and O (belonging to hydroxy group) atoms and inFigure 7(upper right) the net total of charges (Qtot) on Al atoms and C atoms
as a function of number of Al atoms at the interface. At the Oh
site of Aln/substrate models, the Q on oxygen atoms
(belonging to hydroxy and ether groups) are depicted in Figure 7 (lower left) and Qtoton Al atoms and C atoms are shown inFigure 7(lower right), with respect to number of Al atoms. The Qtotrepresented for C atoms is obtained by adding
charges onfive carbon atoms (ID: 7, 10, 11, 12, and 13), that is, the ones directly bonded to either of Oe, Oh, or N atoms (Figure 1).
Mostly, charge transfer at the interface illustrated by Aln/
substrate models is aligned with electronegativities of atoms. The Qtot carried by Al atoms is up to 0.65 e for Al
n/DwH
models on an average at the N Ohsite which suggests charge
transfer toward N and Ohatoms. However, in Aln/D models at this site, a slight negative average Qtot(−0.18 e) is noted. NBO charges carried by the Oh atom increase from −0.68 e and
−0.47 e for the pristine D and DwH models, respectively, to −0.73 e and −1.02 e for Al covered dimer models at the N Oh
site. Also, for the N atom, negative charge gain is significant (−0.20 e) in the case of the Aln/DwH system rather than the
Aln/D model. At the N Oh site, C atoms gain on average
charge up to −0.06 e and −0.03 e on aluminum deposition with respect to D and DwH models, respectively.
At the Ohsite of Aln/substrate models, the charge transfer is slightly delocalized. The average Qtot carried by Al atoms is 0.65 e and 0.69 e for Aln/D and Aln/DwH models, respectively.
In Aln/D models, average Q gained by Oh and Oe atoms is
−0.09 e and −0.06 e, respectively. While average Qtotgained by
C atoms is −0.24 e because of the strong interaction of Aln with Cphenyl at the Oh site of Aln/D models. For Aln/DwH
models at this site, average charge gained by Oh, Oe, and N
atoms is −0.56 e, −0.08 e, and −0.10 e, respectively. Also, average Qtot gained by C atoms is −0.04 e for Aln/DwH
models. Globally, previous works on Al/PET,29,66Al/PI,56and Al/polycaprolactone66 elucidate the charge transfer from Al atoms acquiring a positive charge (avg. Qtot∼ 1.00 e) mainly toward oxygen containing groups followed by ester carbons and Cphenyl. Aliphatic carbons usually acquire maximum charge
up to−0.06 e. It is also shown that the negative charge gained by the polymeric substrate atoms leads to a shift toward lower BE values in the XPS spectrum. In this work, charge transfer at the interface represented by Aln/DwH models fairly agrees with previous results on the Al/polymer interface.
3.4. Simulated XPS: Al/Poly-Epoxy Interface. The adsorption studies and the charge analysis indicate high probability of Al adsorption along with dehydrogenation at the surface. Also, among the possible interactions between Al and polymeric surface, the preferred one or the first site to be hosting Al atom(s) at the polymer surface is the Ohsite. We present results of XPS simulations for both favorable and unfavorable possible scenarios pertaining to Al adsorption on substrate (D or DwH) models. Results of BE (or chemical) shifts for C 1s spectra of considered Al/poly epoxy models, Table 3. Calculated BE Shifts UsingΔKS Theory for Models Shown inFigure 8a
N-Ohsite Al/DwH Al2/DwH Ohsite Al/DwH Al2/DwH
functional group ΔBE (eV) ΔBE (eV) functional group ΔBE (eV) ΔBE (eV)
Cph* Cq 0.08 0.00 Cph* Cq 0.00 0.16 Cph 0.04 0.00 Cph 0.00 0.00 Cph 0.07 0.08 Cph 0.06 0.14 Cph 0.12 0.11 Cph 0.07 0.34 Cph 0.19 0.32 Cph 0.26 0.46 CH3 0.41 0.71 CH3 0.27 0.56 CH3 0.42 0.73 CH3 0.27 0.57 Cq 0.86 1.18 Cq 0.75 1.05 Cph* Oe CH2 C(O Al) 1.68 1.84 C*H2 NH 0.91 1.13 C* O Al 2.03 2.66 C(O Al) C* NHC 0.97 1.24
C(O Al) C* NAlHC 2.07 2.60 C* O Al 1.53 1.76
Cph Oe C*H2 C(O Al) 2.08 2.60 Cph* (Oe Al) CH2 C(O Al) 1.74 1.93
C*H2 NAlH 2.19 2.30 Cph (Oe Al) C*H2 C(O Al) 2.06 2.39
aThe quaternary C atom is labeled as C
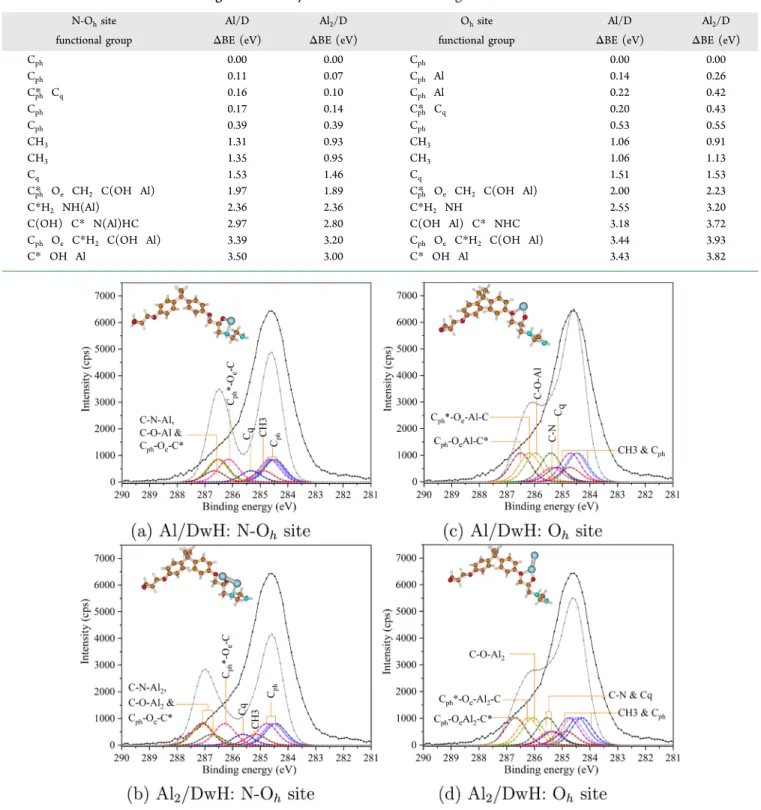
using the ΔKS method, are summarized inTables 3 and 4. These values are then employed to construct simulated C 1s spectra with a fwhm (full width at half maximum) value equal to 0.9 eV and a stoichiometry ratio corresponding to 2DGEBA/1EDA (fixed relative areas). We present the decomposition of experimental C 1s using Al(2)/DwH models
for the N Ohsite inFigure 8a,b and for the Ohsite inFigure
8c,d, respectively. Similarly, simulated C 1s XPS spectra using Al(2)/D models are shown inFigure 9for both N Ohand Oh sites.
In all cases, the black curves exhibit the shape of experimental C 1s of the buried interface observed after 110 s of Ar+ etching. The gray envelopes represent the simulated spectra obtained by summing over all components of chemical shifts calculated for each representative model (seeFigures 8 and9). Experimentally, we examine that a C 1s shoulder peak is present at 286.3 eV for the pristine surface (Figure 2), while on metal adsorption, this shoulder peak disappears. As explained in [refs20,57], the reason is chemical shift toward lower BEs, moving from pristine C−O contributions to the Table 4. Calculated BE Shifts UsingΔKS Theory for Models Shown inFigure 9
N-Ohsite Al/D Al2/D Ohsite Al/D Al2/D
functional group ΔBE (eV) ΔBE (eV) functional group ΔBE (eV) ΔBE (eV)
Cph 0.00 0.00 Cph 0.00 0.00 Cph 0.11 0.07 Cph Al 0.14 0.26 Cph* Cq 0.16 0.10 Cph Al 0.22 0.42 Cph 0.17 0.14 Cph* Cq 0.20 0.43 Cph 0.39 0.39 Cph 0.53 0.55 CH3 1.31 0.93 CH3 1.06 0.91 CH3 1.35 0.95 CH3 1.06 1.13 Cq 1.53 1.46 Cq 1.51 1.53
Cph* Oe CH2 C(OH Al) 1.97 1.89 Cph* Oe CH2 C(OH Al) 2.00 2.23
C*H2 NH(Al) 2.36 2.36 C*H2 NH 2.55 3.20
C(OH) C* N(Al)HC 2.97 2.80 C(OH Al) C* NHC 3.18 3.72
Cph Oe C*H2 C(OH Al) 3.39 3.20 Cph Oe C*H2 C(OH Al) 3.44 3.93
C* OH Al 3.50 3.00 C* OH Al 3.43 3.82
Figure 8.Experimental C 1s spectrum (in black) for the Al/poly epoxy buried interface. XPS simulations usingΔKS theory for (a,c) Al/DwH and (b,d) Al2/DwH models at the N Ohand Ohsites. Simulated spectra are shown in gray. Adsorbed Al atom(s) is depicted as blue sphere(s).
metal adsorbed surface with contribution from C−O−M (M = metal) formations. In the present study, the formation of C− O−Al bonds is also favorable and corresponds well with experiments when their calculatedΔBE is small compared to theΔBE(C−OH) contribution present in the pristine surface (see Table S1). These chemical shifts toward lower BE in (N,O) containing polymers can vary depending on the available reactive sites at the surface, comparative bond strength of reactive functional groups,24,58diffusion tendency of metals,18,57 and nature of charge transfer at the inter face.29,77,78Through XPS analysis inFigures 8and9, we assess the effect of two different chemical environments (N Oh or
Oe−Oh site), changes with respect to metal−metal bonding
and positive influence of dehydrogenation on Al adsorp tion.The simulated C 1s spectra of Al(2)/DwH models
exhibiting Al−N interaction do not correspond well to the experimental C 1s spectrum (Figure 8) because N−H (present in considered dimer models) does not exist in the real cross linked polymer. An increase in high BE shoulder (around 286.3 eV) is depicted by simulations, mainly because C−N contributions from chemisorption of Al(2)at the N Ohsite of the DwH model. A fair correspondence with the experimental spectrum can be drawn using Al(2)/DwH models at the Ohsite.
The calculated values of chemical shifts for C atoms belonging to various functional groups (Table 3) lead to a reasonable decomposition of experimental C 1s spectra. We note a
significant shift of 0.96 and 0.61 eV to low BE values (w.r.t. pristine model) for C−N and C−O contributions, respectively. Al(2)/D models show divergence in chemical shifts for all components for both N Oh and Oe−Oh environments,
removing the distinct presence of a high intensity peak at 284.6 eV (Figure 9). Another observation for the Aln/D system is that for n = 4, convergence in BE shifts is noticeable and C 1s peaks for both considered sites are similar. This is because of the increase in reactivity or charge transfer to carbon atoms via oxygen or nitrogen atoms on increasing the flux of Al atoms. Moreover, we observe a homogenizing effect for Al interaction at N Oh and Oh sites for n(Al) = 4, given the
limited size of our model system (see Figure S7 and Table S13).Overall, Al(2)/DwH models appear as a fair representa
tion of the Al/epoxy interface because the reactivity with metal atoms is promoted by the dehydrogenation process. However, our study indicates that similar results with Aln/D models
might be achievable by increasing n(Al) at the interface. 4. DISCUSSION
4.1. Reactivity Modification at N Site. Comparative XPS analysis point toward metal adsorption at the N Ohsite to be
the least probable during initial stages of metallic layer growth on poly epoxy surfaces. It is expected because the secondary amine (−NH) group present in the representative dimer model does not exist in real epoxy polymers. Also, sp3nitrogen
connected to a hydrogen is more reactive than the one bonded
Figure 9.C 1s spectrum (in black) for the Al/poly epoxy buried interface. XPS simulations usingΔKS theory for (a,c) Al/D and (b,d) Al2/D
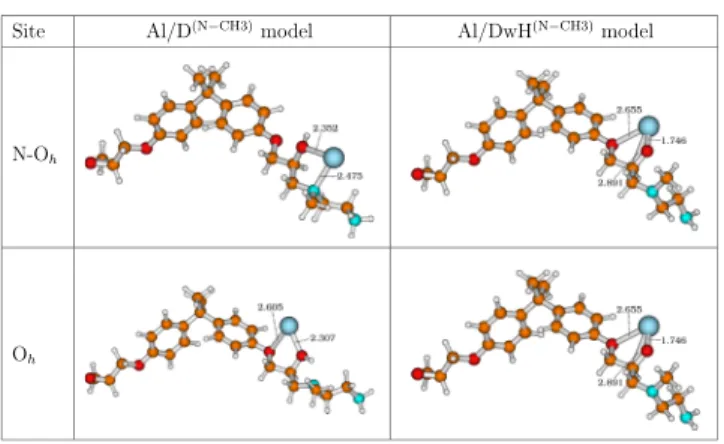
only to carbon atoms. Thus, to verify limitations of the substrate (dimer) models and the validity of our adsorption/ interaction study, we replaced H atom (attached to N) by a −CH3 (methyl) group. In Figure 10, we present these
optimized geometries, namely, Al/D(N−CH3) and Al/
DwH(N−CH3)models showing the adsorption at the two stable
sites.
The results regarding this chemical environment modifica tion at the N site are shown inTable 5. The N Ohsite remains
energetically more favorable than the Oh site for aluminum
adsorption even after the removal of secondary amine. Overall, adsorption energies indicate physisorption on the dimer (D(N−CH3)) model at the O
h site and chemisorption on the
dehydrogenated (DwH(N−CH3)) model for both sites. In the
case of the D(N−CH3) model, because of the presence of H
(−OH group), the impact on reactivity (interaction/ adsorption) stays localized to the N atom. On comparison with Al/D (N Oh site), Al−N bond distance changes from
2.361 to 2.475 Å for the Al/D(N−CH3) model. For other near
neighbors to the Al atom, the distances change up to 0.02 Å irrespective of the site. It can be a reason for no change in adsorption energy at the Ohsite, while |Eads| decreases by 98
meV at the N Oh site compared to Al/D models. Also, no change in charge on the Al atom is observed at the Oh site,
while the charge on the Al atom (+0.43 e) at the N Ohsite notably changes on comparison with Al/D models.
Al/DwH(N−CH3) models also indicate a decrease in
interaction or adsorption, which corresponds well with the N site becoming less reactive on replacing H by the−CH3group. We observe decrease in|Eint| values by 200 meV approx. for
both considered sites. The values of adsorption energies remain same at the N Ohsite, while|Eads| decreases at the Oh
site by 75 meV approx. Also, near neighbor bond distances for adsorbed Al atom on DwH(N−CH3)only change up to 0.018 Å
at maximum with respect to DwH models, independent of the site. For the D(N−CH3) model, E
diss
OH is equal to 4.248 eV. This
value is sensitive to a slight change in molecule geometry and modified by 181 meV with respect to the D model. It can be concluded that removal of secondary amine does not affect the energetic order of adsorption sites. Hence, the representative picture of chemical behavior at the Al/epoxy interface remains the same.
4.2. Linear Versus Cluster Configuration. Combined experimental and theoretical XPS results suggest Al(2)/DwH
models at the Ohsite to be a fair representation of the Al/poly epoxy interface. To further understand how the metallization proceeds in the low coverage regime, we have simulated both linear and cluster type growth scenarios. The linear (1D) configurations for Aln/DwH (n = 3, 4; Ohsite) are shown in Figure 11along with tabulated interaction energies. Energeti
cally, the 1D arrangement of Al atoms (Figure 11) is less favorable than nearly 2D (flat) cluster arrangement (Figure 5) for the Aln/DwH (n = 3, 4; Ohsite) system.
Further in detail, we observe that the interaction per Al atom (|Eint1/n|) decreases up to 260 meV with respect to the cluster
arrangement. Also, |Eint3| values decrease up to 1000 meV
implying that atom by atom deposition is less stable in a linear arrangement compared to 2D/3D arrangement of Al atoms at the interface with epoxies. On comparing|Eint2| values, which
account for the group of Al atoms as one entity, the interaction increases by 590 and 14 meV for the Al trimer and tetramer, respectively, in the Aln/DwH (n = 3, 4; Ohsite) system. It is
because of decrease in ΔHfAln|values of isolated (in vacuum)
linearly arranged Al trimer or tetramer compared to their nearly planar forms. However, the disparity observed in|Eint2|
values could exhibit that at a higherflux of metal deposition, only layer by layer growth fashion could be envisaged on poly epoxy surfaces. In ref18using in situ XPS, for thickness of Al layers up to 2.1 nm on the epoxy resin surface, chemisorption tendency of Al with layer by layer growth is proposed. In contrast, bounded by the size of our model epoxy system, our calculations suggest arrangement of Al atoms in a nearly planar (2D/3D) cluster form at the very initial stage (below 1 nm) of Al/epoxy interface formation.
4.3. Electronic Structure. From the point of view of the electronic structure, usually the charge transfer in metal/ organic interfaces is described as a two fold process. Charge is
Figure 10. Al/D(N−CH3) and Al/DwH(N−CH3) models for Al atom adsorption at N Ohand Ohsites. Bond distances are in Å, PBE D3/
def2TZVP level of theory.
Table 5. Interaction and Adsorption Energies (in eV) and NBO Charges (in e) on the Al Atom for Al/D(N−CH3)and Al/DwH(N−CH3)Models Using PBE D3/def2TZVP Level of Theory
site Eint Eads QAl
Al/D(N−CH3) N-O h 0.767 0.767 +0.43 Oh 0.586 0.586 +0.02 Al/DwH(N−CH3) N-O h 4.776 2.795 +0.72 Oh 4.505 2.524 +0.78
Figure 11.Aln/DwH models for aluminum adsorption at the Ohsite
in open chain like configuration. Bond distances are in Å. Interaction energies are assembled in tabulated form, PBE D3/def2TZVP level of theory.
usually transferred from the occupied MO of the isolated metal system to an unoccupied orbital of the organic system. This process is sometimes followed by a second process, leading to back donation of charge from the organic system to the metal.29,66,76We present inFigure 12density of states (DOS)
of the Al/DwH model at the Ohsite. It highlights the impact of
aluminum adsorption on the electronic structure of the pristine model epoxy system (seeFigure S8). Also, the Al/DwH model (at Ohsite), among all considered model systems, exhibits the best correspondence with experiments which makes it interesting to study from the perspective of electronic structure properties. Here, the DOS spectrum is constructed as a sum of Gaussian functions centered at discrete positions of energy levels (not shown) with fwhm equal to 0.5 eV.79The position of the highest occupied MO (HOMO) level is indicated by the blue curve, and all states below it are occupied states. However, the lowest unoccupied MO (LUMO) level position is represented by red curve and all states above it are unoccupied. On Al adsorption, occupied states appearing in the HOMO− LUMO gap (Eg) present in pristine dimer (Figure S8) leading
to narrowing of its width. The Eg value is 3.83 eV for pristine dimer (D) and it decreases to 3.28 eV for the Al/DwH system (seeTable S14). Increase in intensities of peaks at low energies can be observed after chemisorption of Al atom(s) (Figures S12 and S8, lower panel) on comparison with DOS of the pristine dimer (Figure S8, upper panel). This is a result of filling of LUMO levels of molecular systems, which in turn stabilizes them close to their HOMO levels.
Monitoring the changes of interfacial chemistry before and after metal adsorption in the DOS spectra of highly interacting systems is not trivial as suggested in ref 76 about the aluminum/polythiophene interface. Interestingly, the analysis of the frontier MOs also provides insight into the charge transfer in a metal/organic interface owing to their electronic structure. Localization of LUMO levels of the isolated molecular system is crucial to understand their interaction with occupied levels of the isolated metal system during adsorption. The LUMO of the D model has mainlyπ character and is localized to phenyl rings, while the LUMO of the DwH is primarily localized at the cured part of the epoxy molecule, which is a more realistic chemical representation of poly epoxies (see Figure S8upper panel). Detailed description of HOMO−LUMO isosurface plots of D and DwH models is provided inSupporting Information.
InFigure 12, the isosurface plot of the HOMO− 1 level of Al/DwH (a restricted closed shell) system is localized over the
aluminum atom with large atomic orbital (AO) contributions, that is, Al (s, py, pz, dx2). Other major contributions include
Cphenyl (s, py, pz), Oe (s, py, pz), and Oh(s, px, py, pz). This
strong presence of AO from the Al atom indicates the charge transfer from an occupied level of the Al atom to LUMO levels of the isolated DwH model, which thereby stabilizes as the HOMO− 1 of the Al/DwH sytem. Also, the HOMO level of the Al/DwH sytem is mainly localized over the cured part of model epoxy, that is, Oh, C*−Ohand N atoms. Depopulation of occupied levels of Al atoms on interaction with model epoxy also leads to substantial AO contributions from the Al atom to the LUMO level of the Al/DwH sytem. Also, this level hasπ character localized over the phenyl ring. Localization of HOMO−LUMO isosurfaces further outlines the charge transfer from the aluminum atom to model epoxy in the Al/ DwH system at the Ohsite.
4.4. Consideration of Oxidation in Molecular Models. The experimental XPS study in this work is based on the buried interface accessed by etching the Al/epoxy sample and, hence, removing surface contamination and oxide layer formation. However, the presence of aluminum oxide layer is usually inevitable. Also, air exposed aluminumfilm leads to the possible presence of different surface species such as Al2O3, AlOOH, and Al(OH)3.62,80 To explore an aspect of surface oxidation, we consider simultaneous interaction of Al(OH)3
and Al atom(s) with the DwH dimer model at the Ohsite. The
two stable fully optimized configurations determined in this quest, using PBE D3/def2TZVP level of theory, are shown in Figure 13a: Al−Al(OH)3/DwH and Figure 13b: Al3−
Al(OH)3/DwH. The interaction of these metal−(metal
hydroxide) with the DwH dimer is much stronger than only Al interaction with the polymeric substrate as evidenced by the interaction energy values. In this case, interaction can be described by modified version of eq 5, that is,
Eint=EAltotn−Al(OH) /DwH3 −EAltotn−Al(OH)3− EDwHtot , where n = 1
or 3. The value|Eint| for Al−Al(OH)3/DwH is 9.577 eV, that
is, it exhibits more interaction in comparison to interaction illustrated by its parent model Al/DwH with|Eint| = 4.763 eV. Similarly, Al3−Al(OH)3/DwH with|Eint| = 5.538 eV implies
stronger interaction of Al3−Al(OH)3with the molecular model
as to interaction in its nonoxidized version, that is, Al3/DwH (| Eint| = 4.149 eV). Finally, we perform simulated XPS
calculations usingΔKS theory for O 1s and Al 2p as presented in Figure 13c,d, and e,f, respectively, corresponding to Al− Al(OH)3/DwH and Al3−Al(OH)3/DwH models. Consider ation of oxidation effects as an extension to, so far, the most suitable molecular model: Al/DwH leads to fine decom position of the experimental O 1s spectra. The asterisk (*) in the labels of functional groups marks the atom contributing to the ΔBE value. The O 1s spectrum (Al/poly epoxy) is symmetric with Al−O*H components (from the presence of Al(OH)3) around low BE values (530.8 eV), C−O* Al− Al(OH)3 (from oxygen of the dimer with the simultaneous presence of metal and metal hydroxide) at 531.1 eV and Cph−
Oe*−C and Al−O*(H)−Al(OH)2around 532 eV, respectively.
After coverage of the Cufilm on poly epoxy, the O 1s peak was observed to be rather broad and nonsymmetric.20We are able to simulate the oxide part of the Al 2p peak (Figure 13e) using the Al−Al(OH)3/DwH model. However, only from the Al3−
Al(OH)3/DwH model with the presence of Al atoms (numbered blue spheres) in both neutral and oxidized states (see QAl values in Figure 13f), we could simultaneously
Figure 12.Total DOS of Al/DwH model (a restricted closed shell system) at the Oh site are presented in black. The isosurface
HOMO−LUMO representations plotted at an isovalue of 0.03 e/Å3;
decompose metallic and oxidized parts of the Al 2p peak. Also, the C 1s spectra of the models accounting for surface oxidation are presented inFigure S8. The values of BE shifts calculated for C 1s, O 1s and Al 2p spectra are gathered inTable S15. Globally, consideration of the naturally occurring presence of Al surface hydroxide in the molecular models brings out a fair match with O 1s and Al 2p experimental spectra.
5. CONCLUSIONS
To conclude, using a molecular epoxy model, we perform a detailed study of metallization energetics. It helps to reveal physicochemical interplay at the Al/epoxy interface for very initial stage of metal deposition, limited to atomic scale. Our DFT calculations using all electron potentials indicate
chemisorption of aluminum on the DwH model. On the other hand, interaction energy calculations and charge transfer study delineate the change from physisorption to chemisorp tion on adding more atoms on the dimer (D) model at the Oh
site. A comparative XPS study using the C 1s spectrum of the buried Al/poly epoxy interface clearly points to the Al/DwH model system at the Ohsite to exhibit a fair correspondence
between experiments and quantum chemical calculations. The presence of secondary amine in considered model systems does not affect the adsorption study. We discussed simulated atom by atom metal deposition using D and DwH model epoxy systems. Further, energetics of linear and 2D/3D configurations are compared using the Aln/DwH system at the
Oh site. Our study suggests the presence of nearly planar
Figure 13.Optimized structures showing interactions at the Ohsite between (a) Al−Al(OH)3and DwH dimer (b) Al3−Al(OH)3and DwH dimer
model, using PBE D3/def2TZVP level of theory. Bond distances are in Å. Experimental O 1s (c,d) and Al 2p (e,f) XPS spectra of the Al covered poly epoxy surface (black line) along with simulated spectra (gray line) obtained usingΔKS theory. Simulated XPS spectra in the left panel and right panel represent BEs calculated for molecular models in (a,b), respectively. NBO charges (in e) on Al atoms indexed 1 to 4 are provided in Al 2p (e,f) XPS spectra.
(17) Thran, A.; Kiene, M.; Zaporojtchenko, V.; Faupel, F. Condensation Coefficients of Ag on Polymers. Phys. Rev. Lett. 1999, 82, 1903−1906.
(18) Kanzow, J.; Horn, P. S.; Kirschmann, M.; Zaporojtchenko, V.; Dolgner, K.; Faupel, F.; Wehlack, C.; Possart, W. Formation of a Metal/epoxy Resin Interface. Appl. Surf. Sci. 2005, 239, 227−236.
(19) Capricho, J. C.; Fox, B.; Hameed, N. Multifunctionality in Epoxy Resins. Polym. Rev. 2020, 60, 1−41.
(20) Duguet, T.; Gavrielides, A.; Esvan, J.; Mineva, T.; Lacaze Dufaure, C. DFT Simulation of XPS Reveals Cu/Epoxy Polymer Interfacial Bonding. J. Phys. Chem. C 2019, 123, 30917−30925.
(21) Sandrin, L.; Sacher, E. X Ray Photoelectron Spectroscopy Studies of the Evaporated Aluminum/Corona Treated Polyethylene Terephthalate Interface. Appl. Surf. Sci. 1998, 135, 339−349.
(22) Friedrich, J. F.; Koprinarov, I.; Giebler, R.; Lippitz, A.; Unger, W. E. S. Reactions and Intermediates at the Metal Polymer Interface As Observed by XPS and NEXAFS Spectroscopy. J. Adhes. 1999, 71, 297−321.
(23) Wolany, D.; Fladung, T.; Duda, L.; Lee, J. W.; Gantenfort, T.; Wiedmann, L.; Benninghoven, A. Combined ToF SIMS/XPS Study of Plasma Modification and Metallization of Polyimide. Surf. Interface Anal. 1999, 27, 609−617.
(24) Wagner, A. J.; Wolfe, G. M.; Fairbrother, D. H. Reactivity of Vapor Deposited Metal Atoms with Nitrogen Containing Polymers and Organic Surfaces Studied by in Situ XPS. Appl. Surf. Sci. 2003, 219, 317−328.
(25) Rastomjee, C. S.; Keil, M.; Sotobayashi, H.; Bradshaw, A. M.; Lamont, C. L. A.; Gador, D.; Umbach, E. Aluminium Metallisation of Argon and Oxygen Plasma Modified Polycarbonate Thin Film Surfaces. Appl. Surf. Sci. 1998, 136, 280−297.
(26) Sang, L.; Pemberton, J. E. Penetration and Reaction Depths of Vapor Deposited Ag, Mg, Al, and Ca on Oligothiophene Thin Films. Chem. Mater. 2019, 31, 6908−6917.
(27) Sang, L.; Pemberton, J. E. Chemistry at the Interface ofα Sexithiophene and Vapor Deposited Ag, Al, Mg, and Ca: A Molecular View. J. Phys. Chem. C 2019, 123, 18877−18888.
(28) Walker, A. V.; Tighe, T. B.; Cabarcos, O.; Haynie, B. C.; Allara, D. L.; Winograd, N. Dynamics of Interaction of Magnesium Atoms on Methoxy Terminated Self Assembled Monolayers: An Example of a Reactive Metal with a Low Sticking Probability. J. Phys. Chem. C 2007, 111, 765−772.
(29) Calderone, A.; Lazzaroni, R.; Brédas, J. L.; Le, Q. T.; Pireaux, J. J. The Aluminum/Polyethylene Terephthalate Interface: A Joint Theoretical and Experimental Study. J. Chem. Phys. 1995, 102, 4299− 4307.
(30) Psarellis, G. M.; Aviziotis, I. G.; Duguet, T.; Vahlas, C.; Koronaki, E. D.; Boudouvis, A. G. Investigation of Reaction Mechanisms in the Chemical Vapor Deposition of al from DMEAA. Chem. Eng. Sci. 2018, 177, 464−470.
(31) Aviziotis, I. G.; Duguet, T.; Vahlas, C.; Boudouvis, A. G. Combined Macro/Nanoscale Investigation of the Chemical Vapor Deposition of Fe from Fe(CO)5. Adv. Mater. Interfaces 2017, 4, 1601185.
(32) Aviziotis, I. G.; Cheimarios, N.; Duguet, T.; Vahlas, C.; Boudouvis, A. G. Multiscale Modeling and Experimental Analysis of Chemical Vapor Deposited Aluminum Films: Linking Reactor Operating Conditions with Roughness Evolution. Chem. Eng. Sci. 2016, 155, 449−458.
(33) Aufray, M.; André Roche, A. Epoxy−Amine/Metal Interphases: Influences from Sharp Needle like Crystal Formation. Int. J. Adhes. Adhes. 2007, 27, 387−393.
(34) Aufray, M.; Roche, A. Properties of the Interphase Epoxy Amine/Metal: Influences from the Nature of the Amine and the Metal. Adhesion Current Research and Applications; Wiley, 2005; pp 89−102.
(35) Grunze, M.; Hähner, G.; Wöll, C.; Schrepp, W. Interphase orientation of polyimide on polycrystalline gold, silver and Si(100). Surf. Interface Anal. 1993, 20, 393−401.
(36) Duguet, T.; Bessaguet, C.; Aufray, M.; Esvan, J.; Charvillat, C.; Vahlas, C.; Lacaze Dufaure, C. Toward a Computational and Experimental Model of a Poly Epoxy Surface. Appl. Surf. Sci. 2015, 324, 605−611.
(37) Frisch, M. J.; Trucks, G. W.; Schlegel, H. B.; Scuseria, G. E.; Robb, M. A.; Cheeseman, J. R.; Scalmani, G.; Barone, V.; Petersson, G. A.; Nakatsuji, H.; Li, X.; Caricato, M.; Marenich, A. V.; Bloino, J.; Janesko, B. G.; Gomperts, R.; Mennucci, B.; Hratchian, H. P.; Ortiz, J. V.; Izmaylov, A. F.; Sonnenberg, J. L.; Williams Young, D.; Ding, F.; Lipparini, F.; Egidi, F.; Goings, J.; Peng, B.; Petrone, A.; Henderson, T.; Ranasinghe, D.; Zakrzewski, V. G.; Gao, J.; Rega, N.; Zheng, G.; Liang, W.; Hada, M.; Ehara, M.; Toyota, K.; Fukuda, R.; Hasegawa, J.; Ishida, M.; Nakajima, T.; Honda, Y.; Kitao, O.; Nakai, H.; Vreven, T.; Throssell, K.; Montgomery, J. A., Jr.; Peralta, J. E.; Ogliaro, F.; Bearpark, M. J.; Heyd, J. J.; Brothers, E. N.; Kudin, K. N.; Staroverov, V. N.; Keith, T. A.; Kobayashi, R.; Normand, J.; Raghavachari, K.; Rendell, A. P.; Burant, J. C.; Iyengar, S. S.; Tomasi, J.; Cossi, M.; Millam, J. M.; Klene, M.; Adamo, C.; Cammi, R.; Ochterski, J. W.; Martin, R. L.; Morokuma, K.; Farkas, O.; Foresman, J. B.; Fox, D. J. Gaussian 09, Revision D.01; Gaussian Inc: Wallingford CT, 2013.
(38) Perdew, J. P.; Burke, K.; Ernzerhof, M. Generalized Gradient Approximation Made Simple. Phys. Rev. Lett. 1996, 77, 3865−3868.
(39) Grimme, S.; Antony, J.; Ehrlich, S.; Krieg, H. A Consistent and Accurate Ab Initio Parametrization of Density Functional Dispersion Correction (DFT D) for the 94 Elements H Pu. J. Chem. Phys. 2010, 132, 154104.
(40) Francl, M. M.; Pietro, W. J.; Hehre, W. J.; Binkley, J. S.; Gordon, M. S.; DeFrees, D. J.; Pople, J. A. Self Consistent Molecular Orbital Methods. XXIII. a Polarization Type Basis Set for Second Row Elements. J. Chem. Phys. 1982, 77, 3654−3665.
(41) Frisch, M. J.; Pople, J. A.; Binkley, J. S. Self Consistent Molecular Orbital Methods 25. Supplementary Functions for Gaussian Basis Sets. J. Chem. Phys. 1984, 80, 3265−3269.
(42) Weigend, F.; Ahlrichs, R. Balanced Basis Sets of Split Valence, Triple Zeta Valence and Quadruple Zeta Valence Quality for H to Rn: Design and Assessment of Accuracy. Phys. Chem. Chem. Phys. 2005, 7, 3297−3305.
(43) Weigend, F. Accurate Coulomb Fitting Basis Sets for H to Rn. Phys. Chem. Chem. Phys. 2006, 8, 1057−1065.
(44) Reed, A. E.; Weinstock, R. B.; Weinhold, F. Natural Population Analysis. J. Chem. Phys. 1985, 83, 735−746.
(45) Triguero, L.; Pettersson, L. G. M.; Ågren, H. Calculations of Near Edge X Ray Absorption Spectra of Gas Phase and Chemisorbed Molecules by Means of Density Functional and Transition Potential Theory. Phys. Rev. B: Condens. Matter Mater. Phys. 1998, 58, 8097− 8110.
(46) Triguero, L.; Plashkevych, O.; Pettersson, L. G. M.; Ågren, H. Separate State Vs. Transition State Kohn Sham Calculations of X Ray Photoelectron Binding Energies and Chemical Shifts. J. Electron Spectrosc. Relat. Phenom. 1999, 104, 195−207.
(47) Ljungberg, M. P.; Mortensen, J. J.; Pettersson, L. G. M. An Implementation of Core Level Spectroscopies in a Real Space Projector Augmented Wave Density Functional Theory Code. J. Electron Spectrosc. Relat. Phenom. 2011, 184, 427−439.
(48) Geudtner, G.; Calaminici, P.; Carmona Espíndola, J.; del Campo, J. M.; Domínguez Soria, V. D.; Moreno, R. F.; Gamboa, G. U.; Goursot, A.; Köster, A. M.; Reveles, J. U.; Mineva, T.; Vásquez Pérez, J. M.; Vela, A.; Zúñinga Gutierrez, B.; Salahub, D. R. DeMon2k. Wiley Interdiscip. Rev.: Comput. Mol. Sci. 2012, 2, 548−555. (49) Flores Moreno, R.; Alvarez Mendez, R. J.; Vela, A.; Köster, A. M. Half Numerical Evaluation of Pseudopotential Integrals. J. Comput. Chem. 2006, 27, 1009−1019.
(50) Calaminici, P.; Janetzko, F.; Köster, A. M.; Mejia Olvera, R.; Zuniga Gutierrez, B. Density Functional Theory Optimized Basis Sets for Gradient Corrected Functionals: 3d Transition Metal Systems. J. Chem. Phys. 2007, 126, 044108.
(51) Dunning, T. H. Gaussian Basis Sets for Use in Correlated Molecular Calculations. I. The Atoms Boron through Neon and Hydrogen. J. Chem. Phys. 1989, 90, 1007−1023.