HAL Id: hal-02882372
https://hal.archives-ouvertes.fr/hal-02882372
Submitted on 6 Nov 2020
HAL is a multi-disciplinary open access
archive for the deposit and dissemination of sci-entific research documents, whether they are pub-lished or not. The documents may come from teaching and research institutions in France or abroad, or from public or private research centers.
L’archive ouverte pluridisciplinaire HAL, est destinée au dépôt et à la diffusion de documents scientifiques de niveau recherche, publiés ou non, émanant des établissements d’enseignement et de recherche français ou étrangers, des laboratoires publics ou privés.
Cécile Hilpert, Geneviève Bricheux, Didier Debroas
To cite this version:
Cécile Hilpert, Geneviève Bricheux, Didier Debroas. Reconstruction of plasmids by shotgun sequenc-ing from environmental DNA: which bioinformatic workflow?. Briefsequenc-ings in Bioinformatics, Oxford University Press (OUP), 2020, 2020, pp.1 - 14. �10.1093/bib/bbaa059�. �hal-02882372�
For Peer Review
Reconstruction of plasmids by shotgun sequencing from environmental DNA: which bioinformatic workflow?
Journal: Briefings in Bioinformatics Manuscript ID BIB-19-0348.R3
Manuscript Type: Problem solving protocol Date Submitted by the
Author: n/a
Complete List of Authors: Hilpert, Cécile; Universite Clermont Auvergne, CNRS, LMGE Bricheux, Genevieve; Universite Clermont Auvergne, CNRS, LMGE Debroas, Didier; Universite Clermont Auvergne, CNRS, LMGE; Keywords: plasmidome, high-throughput sequencing, environmental DNA
For Peer Review
Reconstruction of plasmids by shotgun sequencing from environmental DNA: which bioinformatic workflow?
Cécile Hilpert, Geneviève Bricheux, Didier Debroas*
Université Clermont Auvergne, CNRS, Laboratoire Microorganismes : Genome et Environnement, F-63000 CLERMONT-FERRAND, FRANCE
10 *Corresponding author: didier.debroas@uca.fr
- Cécile Hilpert is a graduate student in bioinformatics.
- Geneviève Bricheux is a researcher in molecular ecology at the CNRS.
- Didier Debroas is a Professor at UCA. His research interests are microbial ecology & bioinformatics including metagenome analysis.
2 3 4 5 6 7 8 9 10 11 12 13 14 15 16 17 18 19 20 21 22 23 24 25 26 27 28 29 30 31 32 33 34 35 36 37 38 39 40 41 42 43 44 45 46 47 48 49 50 51 52 53 54 55 56 57 58 59
For Peer Review
AbstractPlasmids play important roles in microbial evolution and also in the spread of antibiotic resistance. 20 Plasmid sequences are extensively studied from clinical isolates but rarely from the environment with a metagenomic approach focused on the plasmid fraction referred to as the plasmidome. A clear challenge in this context is to define a workflow for discriminating plasmids from chromosomal contaminants existing in the plasmidome. For this purpose, we benchmarked existing tools from assembly to detection of the plasmids by reference-free methods (cBar and PlasFlow) and database-guided approaches. Our simulations took into account short-reads alone or combined with moderate long-reads like those actually generated in environmental genomics experiments. This benchmark allowed us to select the best tools for limiting false-positives associated toplasmid prediction tools and a combination of reference-guided methods based on plasmid and bacterial databases.
30 Keywords: plasmidome, high-throughput sequencing, assembly, plasmid prediction.
2 3 4 5 6 7 8 9 10 11 12 13 14 15 16 17 18 19 20 21 22 23 24 25 26 27 28 29 30 31 32 33 34 35 36 37 38 39 40 41 42 43 44 45 46 47 48 49 50 51 52 53 54 55 56 57 58 59
For Peer Review
INTRODUCTIONPlasmids play key roles in evolutionary events in all microbial communities. A large number of plasmid genes allow their survival, flexibility and adaptation to environmental change. Knowledge of their structure and dynamics (i.e. flux) at the individual and community levels is therefore essential. In 2018, there were around 11,000 plasmids sequenced in the NCBI Refseq database (release 86). Most belonged to the Proteobacteria, in particular to the class Gammaproteobacteria. Our knowledge of these mobile genetic elements (MGE) is biased by culture-dependent techniques and sample origin (cultures from clinical samples have been more extensively studied e.g. Escherichia coli or Klebsiella 40 pneumoniae). Plasmids have also attracted attention because they are involved in the dissemination
of antibiotic resistance and xenobiotic-degrading genes. Most potential hosts of plasmids have not been isolated and brought into culture, which has made it difficult to systematically study plasmids in an environmental context.
To circumvent these problems, some studies used culture-independent methods such as transposon-aided capture (TRACA) [1] or high-throughput sequencing from DNA-plasmids. The TRACA approach suffers from certain limitations such as the capture of only small plasmids and the exclusion of linear ones [2]. The second approach seems currently to be the most promising and the resulting data are referred to in this paper as plasmidome. This term has been used with different meanings, for example to define the plasmids isolated from cultivable bacteria after selection in a specific 50 environment by the addition of antibiotics [3]. In this study, in line with the definition of Kav et al. [4], the term has been extended to refer to the entire plasmid DNA of an environmental sample without cultivation or selection of microorganisms. This DNA fraction includes known plasmids from cultivated bacteria and unknown bacteria, as pointed out in the few studies on the topic. Previous research indicated that most plasmids from marine sediment microbial communities were novel and different from those of clinical isolates [5]. Annotations of plasmid contigs from activated sludge sample showed that most belonged to the bacterial kingdom, such as Achromobacter xylosoxidans, for example [6]. The plasmid harbored by this bacterium encodes enzymes required for (halo)aromatic compound degradation or heavy metal resistance determinants. Kav et al. [4] improved the DNA extraction protocol by including digestion of the linear contaminating 60 chromosomal fragments with a plasmid-safe DNase and amplification of circular forms using Φ29 DNA polymerase. Overall, the rumen plasmidome encodes more plasmid-specific functions and virulence factors than were previously detected in the metagenomes. However, whatever the protocol used in plasmidome studies, unavoidable contamination with chromosomal DNA can distort the final data. The “plasmidome” experiments included many contaminants since the plasmid to chromosome 2 3 4 5 6 7 8 9 10 11 12 13 14 15 16 17 18 19 20 21 22 23 24 25 26 27 28 29 30 31 32 33 34 35 36 37 38 39 40 41 42 43 44 45 46 47 48 49 50 51 52 53 54 55 56 57 58 59
For Peer Review
ratios computed varied from 2.83 to 15.73 [7] and the detection of chromosomal contamination remains a challenge. The bioinformatics tools used are therefore a key factor in achieving reliable results. Initial bioinformatics workflows were dedicated to assemblies whose main biases are well-documented. In these studies, assemblies were processed from short reads (454 or illumina). However, long reads, combined or not with short reads (hybrid assembly), now promise to revolutionize plasmid 70 analysis [8]. Previous studies were based on a comparison with plasmids from RefSeq [5] or specific databases such as ARDB [9] and ACLAME [10]. The bioinformatics tools dedicated to plasmid/plasmidome analyses can be divided into three main categories (Table 1). The first is based on the search for marker genes [11–16]. Thus, specific tools like PlasmidFinder [14] and MOB-suite [15] identified the MGEs from specific proteins and replicon sequences. However, such procedures based only on public databases, sometimes restricted to the pathogens, are not able to identify new plasmids and this makes reference-free methods a promising alternative. The second category relies on the search for genomic signatures in the contigs [7, 17]. Thus, cBar [17] and PlasFlow [7], a more recent tool, are based on k-mer frequencies as features to train machine learning models. The first uses SMO-based models while the second is based on deep neural networks with predictions
80 combining different k-mer lengths. The third category is based on the coverage difference or on the specific detection of circular contigs (i.e. “cyclocontig”) in the de Bruijn graph to attempt to reconstruct whole plasmid sequences [18–20].
These tools were partially benchmarked on individual genomes (chromosome + plasmids from one species) [21,22] but never from complex communities (metagenomes/plasmidomes). In the present paper we propose a benchmark of a subset of methods by focusing preferentially on those dedicated to metagenomes (Table 1) and responding to the following criteria: i) process from an assembly ii) detection of linear and circular plasmids iii) use of a command line for dealing with big data iv) scalability. An assembly is able to predict genes and, for instance, antibiotic resistance genes harbored by plasmids with more reliability than directly from reads [23]. Scalability is essential for tuning 90 workflows with new tools such as assemblers. Within these specifications, we have not included tools requiring manual curations [16] or processes from reads alone [11] and we only used the best assembler already benchmarked. The main aim was to select the combination of the best methods after identifying the main limitations of the computational tools in plasmidome analyses.
2 3 4 5 6 7 8 9 10 11 12 13 14 15 16 17 18 19 20 21 22 23 24 25 26 27 28 29 30 31 32 33 34 35 36 37 38 39 40 41 42 43 44 45 46 47 48 49 50 51 52 53 54 55 56 57 58 59
For Peer Review
MATERIALS AND METHODSDatabases
To simulate plasmidome sequencing, we used reference sequences from plasmids and sequences from 100 chromosome databases to simulate contamination. Accessions of plasmids and chromosomal contaminants were used for building. We used 1828 plasmid sequences and 506 chromosome sequences. To construct the plasmid database, all the plasmid sequences from RefSeq (release 86) [24] were used, and one sequence per species referenced as complete was retained. The “contaminant database” (i.e. bacteria and archaea) used in the simulations was built from chromosome sequences from RefSeq: 1 genome per species was retained and 500 were randomly selected (Figures 1 and 2 supplementary materials). These mock communities do not necessarily have to reflect the taxonomic composition of many real-world samples.
Sequencing simulation
110
Short-read and long-read sequencing were simulated with Grinder v0.5.4 [25]. For short-read sequencing, 150 bp paired-end reads with an insert size of 350 bp were generated, and for long-read sequencing 6,000 bp single-end reads were produced. To simulate contamination events, contaminant reads were generated from chromosomal sequences and added to the plasmid reads. For example, a contamination named “20%” corresponded to an addition of 20% of the plasmid reads as chromosomal sequences. Several sequencing coverages were simulated: 1X, 2X, 5X, 10X and 20X for short-reads, and 0.5X, 1X and 5X for long-reads, associated with several contamination rates (0%, 5%, 10% and 20%). The greatest coverages correspond to 25,228,218 short-reads (20X) and 157,677 long-reads (5X). The abundances of the plasmids and contaminants follow a power law. The grinder 120 parameters for the short-read simulations were -rd 150 -id 350 -fq 1 -ql 30 10 and-rd 6000 -fq 1 -ql
30 10, respectively.
Assembly
Short-reads were assembled with Megahit v1.0.5, with parameter “–12” to give interleaved fastq paired-end file [26], SPAdes and MetaSPAdes (v3.9.0), with parameter “–12” to give interleaved fastq paired-end file, and only -assembler parameter “-meta” was used to launch MetaSPAdes [27]. Hybrid assemblies were tested with HybridSPAdes v3.9.0 using the same parameters as SPAdes with 2 3 4 5 6 7 8 9 10 11 12 13 14 15 16 17 18 19 20 21 22 23 24 25 26 27 28 29 30 31 32 33 34 35 36 37 38 39 40 41 42 43 44 45 46 47 48 49 50 51 52 53 54 55 56 57 58 59
For Peer Review
“–PacBio” to launch hybrid assembly [28], Unicycler v0.4.4 [29], and a sequential assembly of short read assemblies (Megahit, MetaSPAdes and SPAdes) and long reads with CAP3 [30]. A more 130 stringent procedure of this assembly was also performed with the following parameters: 95 for -p percent identity and 60 for -o overlap length. After assemblies, only contigs over 1 kbp were kept for further analysis.
Plasmid prediction by reference-free tools
Plasmid prediction or decontamination was performed in two experiments using Megahit and MetaSPAdes short-read assemblies, defined as the best tools after the first benchmark (see results). Several methods for separate plasmid contigs and contaminant contigs were assessed. Two tools designed for this purpose, PlasFlow [7] and cBar [17], were first tested. PlasFlow was tested with 140 different probability thresholds from 10 to 90%, with steps of 10. A combination of cBar and PlasFlow tools was tested. In the first step, cBar was used for identifying plasmids, and the sequences classified as chromosomes were checked by PlasFlow with various thresholds (70, 80 and 90%). The plasmid fraction was then defined as the sum of the plasmids detected by the two tools.
Plasmid prediction from specific markers
The aim was to look for known plasmid markers among the contigs, a method that corresponds to a reference-based approach. When a plasmid marker was found, the contig was then classified as a plasmid whatever the results given by the predictive tools described above. The markers used were 150 those from the MOB-suite tool [15], which contains replicase DNA, origin of transfer (oriT) DNA, mobilization proteins and mate-pair formation proteins. For proteins, the search was performed with blastp v2.2.31+ [31] with an e-value at 1e-6 against contig predicted genes translated to proteins with Prodigal vV2.6.3 [32]. For DNA sequences, the search was performed with blastn against the contigs. The same treatment parameters as those of plasmidFinder were applied. A plasmid marker was found in a contig or predicted genes when the sequence had at least 80% identity and along at least 80% of its length (90 and 90% for oriT DNA).
Detection of the chromosome contaminants
2 3 4 5 6 7 8 9 10 11 12 13 14 15 16 17 18 19 20 21 22 23 24 25 26 27 28 29 30 31 32 33 34 35 36 37 38 39 40 41 42 43 44 45 46 47 48 49 50 51 52 53 54 55 56 57 58 59
For Peer Review
160 Chromosome detection (i.e. contamination) was performed by aligning the contigs against a database with minimap2 v2.14-r883 [33] with the following parameters: -x asm5 (stringent parameter) and -N corresponding to the number of sequences in the database used. Sequences were considered to originate from chromosomes if they mapped with at least 80 % of coverage. The database of the chromosomes was RefSeq prokaryotic chromosomes, the same used for selecting contaminant genomes in the database construction (see Database paragraph). The contigs were aligned against this database and contaminant genomes were discarded. The results of the mapping made it possible to discriminate between chromosomes and plasmids. To assess the effect of the database composition and the reliability of mapping to identify contaminants the genomes were binned from their 16S rRNA identity. Clustering was processed with vsearch [34] (--usearch_global option) using contaminant 170 SSU as seed and deleting chromosomes from the prokaryotic database according to 99, 97, 95 and 90%
thresholds. For the real plasmidome analysis, another step was added based on the detection of the phylogenetic markers harbored by chromosomes [35].
Plasmidome analysis
The best bioinformatic workflow determined from the mock communities was used to analyze plasmidomes from hospital biofilm and a waste water treatment plant (WWTP).
Biofilm formed on glass slides in the sewer of the Gabriel Montpied teaching hospital (Clermont-180 Ferrand, France) was scratched with a razor blade and sonicated for 5 min in saline medium with
0.1% Na-pyrophosphate to disrupt the biofilm. Four liters of inlet water from the wastewater treatment plant were concentrated by centrifugation for 30 min at 8000 RPM at 4°C. Bacteria were re-suspended in DNA/RNA shield ™ (Zymo Research) to preserve the samples before extraction. Plasmid DNA was extracted by a modified alkaline lysis method [36]. DNA extraction was optimized to enrich fractions with plasmid DNA while conserving large plasmids. This is why we avoided vortex throughout the procedure, cut the tips of the pipettes and reduced the number of steps and pipetting of the fraction. Bacteria were centrifuged for 10 min at 8000g in Eppendorf tubes. The cells were then re-suspended in 200 µL ice-cold resuspension buffer [(50 mM glucose/10 mM EDTA/10 mM Tris-Cl, pH 8.0) + 5 µL RNAse A/T + fresh lysozyme 4mg/ml, proteinase K 20 µg/ml] with a 190 mini-potter and incubated 1h at 37°C. Bacterial cells were lysed with 400 µL of freshly made lysis solution (0.2 M NaOH/1% SDS) and the tubes mixed by gentle inversion. The tubes were incubated for 5 min at RT then neutralized by the addition of 300 µL of 7.5 M ammonium acetate followed quickly by 300 µl of chloroform, mixed by gentle inversion of the tube four or five times and then 2 3 4 5 6 7 8 9 10 11 12 13 14 15 16 17 18 19 20 21 22 23 24 25 26 27 28 29 30 31 32 33 34 35 36 37 38 39 40 41 42 43 44 45 46 47 48 49 50 51 52 53 54 55 56 57 58 59
For Peer Review
chilled on ice for 10 min. After centrifugation at 4°C, 12 000 rpm for 10 min, the samples were cleaned up from residual proteins by a step of phenol: chloroform/ isoamyl alcohol (25:24:1) extraction and DNA were precipitated with isopropanol (0.7 vol.). After two washes with ethanol 70, the DNA was re-suspended in 100 µl of TE buffer then transferred to 200 µL of precipitation solution in a fresh tube (30% polyethylene glycol 8000/1.5 M NaCl), mixed by inversion and chilled on ice overnight to clean the DNA before centrifugation and resuspension in 5 mM Tris buffer.
200 After DNA fragmentation and adapter ligation, the DNA was size selected and amplified. The DNA was then sequenced by GATC Biotech using an Illumina platform (2 x 150 bp paired-end). The reads were deposited with the accession number PRJEB29943.
The reads were assembled with Megahit according to the simulations and PlasFlow was used at 70 % threshold. The presence of chromosomal sequences was checked by (i) alignment against the prokaryotic RefSeq database with minimap2 according to the method described above, (ii) detection of rRNA sequences with blastn v2.2.31+ against SILVA rRNA markers (SSU and LSU, version 132). rRNA was considered as present if it mapped on at least 1200 bp with an identity of 97%. To take into account the rRNA genes at the beginning or end of the contigs, the alignment must be at least 300 bp long with a cut-off of 97%. and (iii) detection of phylogenetic markers included in 210 chromosomes from micro-organisms. The search was conducted with hmmsearch v3.2.1 against HMM profile of bacteria and archaea phylogenetic markers [35] with an e-value of 1e-5. The presence of plasmids was checked by three methods: (i) search for plasmid markers (ii) detection of circular contigs and (iii) alignment against RefSeq plasmid database using minimap2 with the option -x asm5 (stringent parameter) and a coverage of at least 80 %.
Assessments of assembly and plasmid detection
Assembly was assessed with MetaQuast v5.0.0 [37]. Some traditional assembly parameters were measured (N50 and longest contigs) and some were defined as follows.
- Misassembled contigs: misassembled contigs represent contigs (bp) that can be chimeric (different 220 parts of one contig map different plasmids), inverted (maps in two directions on the same plasmid) or relocalized (the left and right parts of the contig map the same plasmid with a gap or an overlap over 1 kbp)
- Reference coverage: the reference coverage was the percentage of bases in the reference sequences (plasmids used to simulate sequencing) covered by correct contigs (misassembled contigs were discarded). 2 3 4 5 6 7 8 9 10 11 12 13 14 15 16 17 18 19 20 21 22 23 24 25 26 27 28 29 30 31 32 33 34 35 36 37 38 39 40 41 42 43 44 45 46 47 48 49 50 51 52 53 54 55 56 57 58 59
For Peer Review
- Complete plasmids: a plasmid was defined as “complete” when at least 90% of its length was covered by only one contig.
- Contaminated contigs: contigs that did not map with any reference plasmid and mapped against reference contaminants.
230
To assess the reliability of the plasmid prediction, the simulated contigs of a known origin (i.e. plasmid or non-plasmid origin) and predicted affectation were compared. On the basis of this comparison, we defined true positive, true negative, false positive and false negative contigs.
- True positives (TP): contigs (bp) classified as plasmids that are actual plasmids
- True negatives (TN): contigs (bp) classified as chromosomes that are actual chromosomes - False positives (FP): contigs (bp) classified as plasmids but which are actually chromosomes - False negatives (FN): contigs (bp) classified as chromosomes but which are actually plasmids. Using these parameters, we computed the following metrics.
- Recall: TP / (TP + FN). Plasmids correctly predicted among all the plasmids. Reflects how many 240 real plasmids were correctly predicted.
- Precision: TP / (TP + FP). Plasmids predicted correctly among all contigs predicted as plasmids. Reflects how many predicted plasmids were real plasmids.
- Accuracy: (TP+TN)/(TP+FP+FN+TN)
- F1-score: 2*(Recall * Precision) / (Recall + Precision)
A diagram combining the main bioinformatics tools used for producing contigs and sorting out plasmids from contaminants is presented in Figure 3 supplementary materials. All the scripts related
250 to the simulations presented in this paper can be found in a repository at the following address: https://github.com/meb-team/PlasSuite. Briefly, this repository includes scripts involved in the database building, assembly, decontamination by reference-free tools and aligning against public databases (PlasSimul). The final workflow for detecting plasmids by the best methods described in this paper is PlasPredict. It can be associated with other workflows for i) predicting genes and processing a first functional annotation (PlasAnnot) ii) a taxonomic annotation of the predicted contigs (PlasTaxo) and iii) building gene tables (all predicted genes and more specifically antibiotic resistance genes) by mapping reads against clustered genes (PlasAbund).
2 3 4 5 6 7 8 9 10 11 12 13 14 15 16 17 18 19 20 21 22 23 24 25 26 27 28 29 30 31 32 33 34 35 36 37 38 39 40 41 42 43 44 45 46 47 48 49 50 51 52 53 54 55 56 57 58 59
For Peer Review
RESULTS260 Short read assemblies
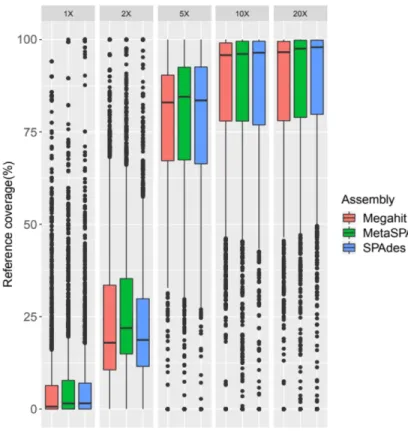
Megahit, SPAdes and MetaSPAdes were first used with several sequencing coverages. To assess assembly quality, we focused on N50, the longest contig, reference coverage and misassembled contigs (Table 2). The N50 parameter increased with sequencing depth, from an average of 1,410 bp for 1X to an average of 69,369 bp for 20X. For the lowest sequencing depth (1X and 2X), N50 was closely similar between the different assemblers. For the highest sequencing depth (10X and 20X), Megahit had the worst N50 and SPAdes or MetaSPAdes the best (82,150 bp for MetaSPAdes with 20X depth) (Table 2a). The same conclusions can be drawn from the longest contig parameter with the best results being obtained from the SPAdes tools, around 1,777 kbp for 20X (Table 2a). The reference coverage increased with the sequencing depth and reached a plateau from 10X (Table 2, 270 Figure 1). The misassembled contig rate decreased from sequencing depth of 1X to 10X with Megahit,
from 7.1% for 1X to 0.82% for 10X. The results from SPAdes had the highest misassembly rates for low depths? (1X and 2X), up to 34.66% for 1X. With the same depth, MetaSPAdes obtained 2.9% of misassembled contigs with 2X (Table 2a).
Hybrid assemblies
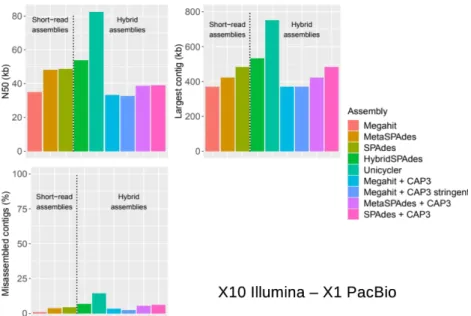
Hybrid assemblies were tested from a short-read sequencing depth of 10X, which corresponded to the optimal value for the reference coverage parameter (Figure 1) and a long-read sequencing depth from 0.5X to 5X. Overall, the long-read sequencing depth of 1X did not significantly improve the assembly results compared to those with short reads (Table 2b). For example, N50 was similar to the 280 best read assembly, 82,519 bp for Unicycler and 82,150 bp for MetaSPAdes with 20X
short-read depth. The best N50 and longest contig parameters were obtained with the Unicycler assembler, with 148,453 bp and 1,848,068 bp for the highest long-read sequencing depth (5X).
However, these best values can be unfortunately associated with a high rate of misassembled contigs (12.49 to 20.89%) and a low coverage (72.10%). Taking into account the reliability of the assembly, the best results were obtained with the combination of Megahit and CAP3 (2.41%-6.18%), which outperformed HybriSPAdes (4.90 to 8.30%). In contrast, these assemblies did not improve those obtained with the short-read simulation. For example, the CAP3 approach gave a lower N50 than that associated with short-read assemblies, 33,227 bp for Megahit + CAP3 vs 35,107 bp for Megahit with the same short-read depth of 10X (Figure 1, Table 2b). The largest contig obtained with the CAP3 290 approach (369,321 bp) was closely similar to those associated with short-read assemblies (369,321 to 482,749 bp). The longest contigs from short-read assemblies were not improved by CAP3 hybrid 2 3 4 5 6 7 8 9 10 11 12 13 14 15 16 17 18 19 20 21 22 23 24 25 26 27 28 29 30 31 32 33 34 35 36 37 38 39 40 41 42 43 44 45 46 47 48 49 50 51 52 53 54 55 56 57 58 59
For Peer Review
assembly (Figure 2, Table 2b) and even with more stringent parameters for overlapping with CAP3 (98% identity on at least 60 bp) the misassembled contig rate of 2.41 % was still higher than that with Megahit used alone (Figure 2, Table 2). Finally, because of the computing resources required and as the statistics of assembly were not improved, we did not use this combination. Unicycler was also used only for assembled long reads. Nevertheless, with the coverages (0.5X to 5X) and the read length benchmarked, the results were the worst obtained in our simulations (Table 1 Supplementary materials)
Overall, these simulations showed that the hybrid assemblies improved the length of the contigs but 300 diminished the reliability of the assemblies (i.e. proportions of misassembled contigs).
Assemblies with contamination
An important step in this work was to simulate chromosomal contamination before assembly of the reads (Table 2c). The simulations were restricted to the optimal results obtained from the previous results (10X for the short reads and 1X for the long reads). The contaminant reads introduced into the simulated plasmidomes produced a small proportion of contaminant contigs > 1 kbp. Overall, the main statistics of the assemblies remained close to those obtained without contaminants and varied little with the increase in the reads from bacterial chromosomes. Unicycler produced the longest contigs with again the largest proportion of misassembled contigs whereas the short-read assemblers 310 such as Megahit and MetaSPAdes minimized this proportion.
Plasmid prediction and decontamination from simulated plasmidomes
Various strategies were used to predict plasmids from the plasmidome simulations with bacterial contaminations: cBar, PlasFlow, Recycler, contig alignment against databases and detection of specific plasmid markers, cBar and PlasFlow were used alone or together. To use Recycler, the assembler must generate a file representing the Debruijn graph (FASTG format produced by metaSPAdes) with a specific simulation (see materials and methods). However, while this tool decreased contamination as expected, the coverage of the reference sequences remained extremely low (5.2%). Finally, the detection of the circular contigs after assembly can be an alternative that 320 gives similar results (results not shown).
The best decontaminated assembly (i.e. plasmidome) was defined as an assembly with the lowest contamination rate and the highest reference coverage rate (Figure 3, Table 2 Supplementary materials). For this part of this study, we chose the simulation results with the lowest contig misassemblies and the strongest contaminant reads (i.e. 20%). These contigs corresponded therefore 2 3 4 5 6 7 8 9 10 11 12 13 14 15 16 17 18 19 20 21 22 23 24 25 26 27 28 29 30 31 32 33 34 35 36 37 38 39 40 41 42 43 44 45 46 47 48 49 50 51 52 53 54 55 56 57 58 59
For Peer Review
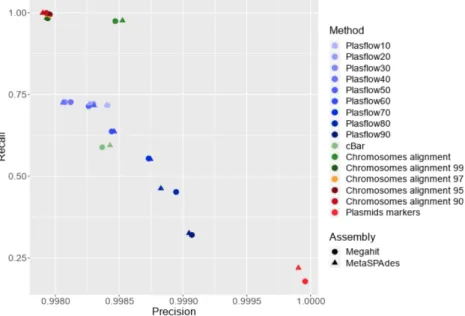
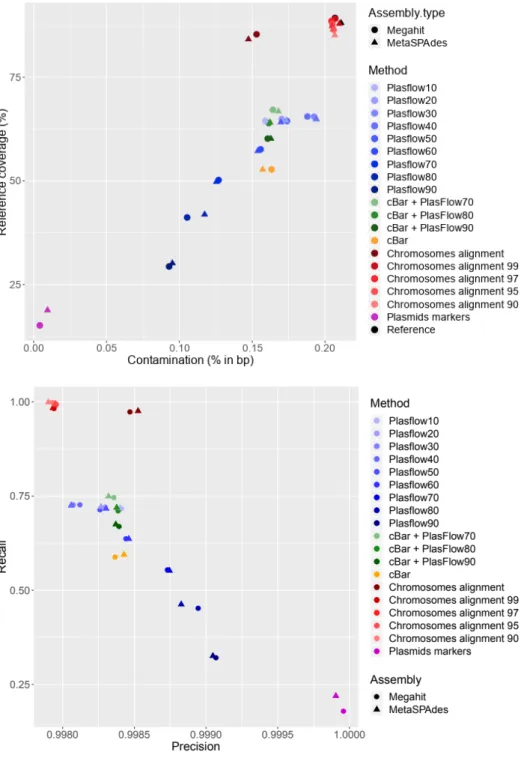
to those produced with Megahit and metaSPAdes (Table 1). The contaminants accounted for up to 0.21% in bp and 2.51% in abundance of the contigs generated. Figures 3 and 4 show roughly three types of results discriminating between contig alignments, plasmid prediction and maker detection. The results did not differ with the assembler used. In Figure 4, the range variation of the recall parameter is greater than precision and the best recall values were obtained for the method based on 330 the chromosome alignment.
The best results, defined as the best compromise between residual contamination and coverage, were therefore obtained with contig alignments against the entire bacteria databases (0.15% contaminated contigs and a reference coverage equal to 84.8%) (Figure 3). However, when the chromosome databases were even slightly distant from the chromosomes present in the assembly (clustering between 99% and 90%), the method was no longer effective because contamination was equal to that of the control.
An opposite result was obtained with the detection of the plasmid marker in the contigs since contamination was close to 0. However, the coverage rate was particularly low because not all contigs contained the markers sought for. Recall and reference coverage rates were low (0.2 and 16.99%, 340 respectively) and many plasmids were not retrieved.
cBar and PlasFlow obtained intermediary results (Figures 3 and 4) compared to the two strategies described above. For cBar, recall and precision were slightly lower than those of PlasFlow60 (mean recall of 0.59 for cBar and 0.64 for PlasFlow). The combination of these two tools did not improve the results (Figure 4 supplementary materials). An increase in the threshold of PlasFlow led to a lower recall (from 0.71 to 0.50) that was reflected by a drop in the contamination rate (from 0.16 % to 0.13%) and the coverage rate (from 64.3 % to 44.8%). Finally, plasmid prediction was better but some plasmids were not detected. There was a gap between the thresholds of 50 and 60%. The contamination rate was too high for the threshold of 50% and lower. For purposes of the plasmidome study, precision is a more important parameter than recall as we prefer to lose true plasmids but to be 350 sure of the correctness of the plasmids we will retain from a true plasmidome. PlasFlow with a
cut-off of 70% seems to be the best compromise between precision, coverage and residual chromosomal contaminants for studying a plasmidome in the environment. The accuracy and the F1-score after Megahit assembly were 0.55 and 0.71 respectively (Table 2 supplementary materials)
To deal with real data, we chose to combine the best bioinformatics methods described above. Our results showed that mapping on public databases is always the simplest and most reliable method for detecting the sequences of interest, at least, in a first step. Contig alignments against microbial 2 3 4 5 6 7 8 9 10 11 12 13 14 15 16 17 18 19 20 21 22 23 24 25 26 27 28 29 30 31 32 33 34 35 36 37 38 39 40 41 42 43 44 45 46 47 48 49 50 51 52 53 54 55 56 57 58 59
For Peer Review
databases can decrease putative contaminations and can also be used as a first approach to remove clearly identified chromosomes. Hence, detection of the phylogenetic markers belonging to bacteria or Archaea can be included in this step. On the real data, looking for plasmid markers missed many 360 plasmids, but it can be used as a first and reliable approach. This method can be combined with mapping against a plasmid database and the detection of circular contigs. From these results, we propose a workflow called PlasPredict, given in Figure 5 and available for downloading with all the simulations at the following address: https://github.com/meb-team/PlasSuite (more details are available in the materials and methods in the section “Plasmidome analysis”).
The analysis using this workflow of the simulated data (Megahit assembly of Illumina reads 10X with 20% of chromosomal contaminants) shows that the taxonomic composition of the true positives was not significantly different from the reference database used (Chi-squared test at the genus level - Figure 5 Supplementary materials). Among GC% and contig length parameters, the less reliable predictions involved the shorter contigs (< 10 kb) since they represented the greater number of the 370 FN (Figures 6 and 7 Supplementary materials).
What is the proportion of plasmids in a “plasmidome”?
From the WWTP assembly, 6.5 % of contigs were identified as chromosomes with the database-approach (chromosomes and phylogenetic markers) (Table 3). This proportion was not a simple addition of the contaminants since a contig can be detected as a contaminant by more than one method. The detection of plasmid markers, circular sequences and whole plasmid sequences identified 2.16 % of contigs considered to be “true” plasmids corresponding to plasmids referenced in public databases. We also considered circular contigs to be plasmids. From the biofilm assembly, 21.27 % of contigs 380 were identified as chromosomes and 7.02 % of contigs as plasmids. After PlasFlow treatment, 4.9 % of the remaining contigs were defined as chromosomes for WWTP and 9.3 % for biofilm; 5.43 % of the remaining contigs were defined as plasmids from WWTP and 17.07 % from biofilm. PlasFlow decontaminated assemblies (decreased the chromosome rate) and increased the plasmid rate. The circular contigs accounted for a low proportion of the predicted plasmids and using a tool based on the cyclocontig detection such as MetaplasmidSPAdes did not improve significantly the results (Table 3 Supplementary materials). From the data published by Zhang et al. [6], any circular contigs were detected with a sequencing-depth lower than that of this study.
DISCUSSION 2 3 4 5 6 7 8 9 10 11 12 13 14 15 16 17 18 19 20 21 22 23 24 25 26 27 28 29 30 31 32 33 34 35 36 37 38 39 40 41 42 43 44 45 46 47 48 49 50 51 52 53 54 55 56 57 58 59
For Peer Review
390
Analysis of plasmidomes, defined as entire plasmid DNA of an environmental sample is challenging because no laboratory experiment can today separate plasmids from chromosomes perfectly. In addition, bioinformatics approaches are not easily able to separate plasmids from host chromosomes satisfactorily because there are no clear signatures to differentiate these two classes computationally. There are therefore bottlenecks when analyzing metagenomes and plasmidomes at the same time since the assembly process is strongly dependent on sequencing platforms. Illumina processing uses short fragments that are smaller than many repetitive elements in bacterial chromosomes or plasmids and therefore produce a “puzzle of contigs”. In contrast, Pacific Biosciences and Oxford Nanopore Technologies platforms can sequence DNA fragments from 10 kbp to 40 kbp and are less dependent 400 on this repetition. It has been shown that these long reads can improve metagenomic assemblies [38]. However, the extracted DNA quality from metagenomic experiments is not often sufficient to sequence long fragments. With the PacBio RS II system, Suzuki et al. [39] obtained therefore read lengths ranging from 4.4 to 9.8 kb from gut microbiomes. PacBio circular consensus sequencing was able to produce reads that averaged 1,319 bp in length and 99.7% accuracy from a biogas reactor microbiome sample [40]. In our simulation we chose a fragment length equal to 6 kb close to that obtained currently in environmental genomics [39–41]. In addition, because of the cost of long-read technologies, the sequencing process in environmental genomics is still a mix of short and long reads and, in this context, hybrid-assembly is then used. As expected, Unicycler and hybridSPAdes [28] produced the longest contigs. However, whatever the coverage depth, the results were hampered by 410 the high level of contig misassemblies compared to that of short reads. Unlike these assemblers, there are few tools dedicated to hybrid assemblies and none to metagenomes/plasmidomes characterized by a high and uneven diversity. Thus, these tools were only benchmarked with one species and rarely with a microbial community. For our purpose, we considered the level of chimeric contigs as a critical criterion and so the hybrid-assembly was not used for the following simulations. In addition, with the sequencing depth and the long-read length chosen, the assembly of long-reads only did not improve the results. Finally, the development of the hybrid-assembly tools and/or the improvement of the long-read sequencing platform dedicated to the metagenomes are required. Among short-read assemblies, Megahit and metaSPAdes are designed for metagenomes, have been rated as the best assemblers by benchmark studies [26,27] and are considered as flexible and well documented. Contig 420 misassemblies were also detected with these tools but were largely lower than those checked with the hybrid counterpart. Overall, Megahit minimized the misassemblies whatever the mock community built (with or without chromosomal contaminants) or the tool combination used (CAP3). Nevertheless, Megahit had generally the lowest N50 and “longest contig” values, leading to the most 2 3 4 5 6 7 8 9 10 11 12 13 14 15 16 17 18 19 20 21 22 23 24 25 26 27 28 29 30 31 32 33 34 35 36 37 38 39 40 41 42 43 44 45 46 47 48 49 50 51 52 53 54 55 56 57 58 59
For Peer Review
fragmented assemblies. The SPAdes algorithms, also included in the hybrid assemblers used outperformed Megahit for these last statistics but gave slightly more chimeric contigs. A previous benchmark underlined the misassemblies errors made by MetaSPAdes, 50 times more than the most accurate assemblers such as Megahit, and the number of unaligned contigs with the reference community [42]. The recent study of Gupta et al. [43] recommended Megahit based on the best assembly statistic from two water plasmidomes and the few computing resources required. Finally, it 430 is more reasonable to not detect some unresolved/fragmented plasmids (false negatives) than false positives, and simulations from Illumina platforms were kept for studying real plasmidomes. Hybrid assembly must be further improved to be used in the field of metagenomics, and long-read sequencing is still too expensive to reach a depth coverage in relation to the hybrid-assembly tools.
The tools discussed above are not dedicated to plasmid assembly. Some methods are based on the detection of circular contigs within DeBruijn graphs, named cyclocontig by Antipov et al. [20]. These tools did not respond to all our specifications (i.e. detection of linear plasmids) but they can be included in a workflow to improve the detection of the circular forms. Recycler analyzes any DeBruijn graphs provided by a conventional de novo assembler to detect cyclic sequences (but 440 requires a specific format as input) and can be associated with any tools in a workflow. However, the results obtained were not really different from those given by checking circular contigs after assembly by any tool. In a previous benchmark focused on one species, the authors [21], concluded that a high number of sequences predicted as plasmids originated from the chromosome. In addition, circular phage genomes can also be detected as plasmids [7]. In this study, plasmidSPAdes [18] was not benchmarked because the tool was based on the difference in coverage between plasmids and chromosomes and was dedicated to the assembly of one species. A recent version dedicated to the metagenome could solve this problem but the software was in an early preview version at the time of this work [20]. MetaplasmidSPAdes can be viewed as an option for the SPAdes-suite and can be used for the assembly of short-reads by focusing on the cyclic circular contigs. This detection was also 450 associated with a reference-based approach. The results evidenced a low detection of plasmids in the biofilm or the WWTP compared to our workflow. Finally, the approach based on cyclocontig [18– 20] is strongly dependent on plasmid coverage and on sequencing depth.
Thus, other methods that do not have such limitations are available for identifying plasmid contigs from plasmidomes and/or metagenomic experiments. PlasFlow [7] can detect circular and linear forms from environmental samples. According to its developers, this recent tool slightly outperformed cBar [17], with an outdated training dataset, on the basis of our criteria. Combined use of the two tools did not significantly improve plasmid detection and PlasFlow including a more recent 2 3 4 5 6 7 8 9 10 11 12 13 14 15 16 17 18 19 20 21 22 23 24 25 26 27 28 29 30 31 32 33 34 35 36 37 38 39 40 41 42 43 44 45 46 47 48 49 50 51 52 53 54 55 56 57 58 59
For Peer Review
training dataset was selected for dealing with real data. Although the public database gives a biased view of microbial genomes, including plasmids, in the environment our results show that these data 460 can be used successfully to conserve at least the well-known plasmids and remove some contaminants.
Predictive tools based on genomic signatures led to obviously contaminated plasmids being kept, as evidenced by the presence of phylogenetic markers (rRNA or proteins), and some plasmids were removed despite the presence of specific plasmid markers. This step, implemented in some software, is strongly linked to the database. The PLACNET web-based tool [16] requires manual pruning in Cytoscape software, a step that is incompatible with an automatic procedure. In our workflow, we propose an extended database of PlasmidFinder [14] dedicated to Enterobacteriaceae genomes with MOB-suite [15]. One example of the database effect (i.e. paucity) was the detection of contaminants by chromosome alignments with different clustering thresholds. With the total database (without the genomes used for generating contaminations), the cleaning effect was remarkable but became 470 unreliable as soon as the closest genomes (clustering threshold of 99%) were removed. This procedure is likely unreliable for studying most environments with the exception of well-documented ecosystems such as the human gut. According to the authors of MOB-suite [15], these kinds of tools do not perform well on novel plasmids. The databases constructed from protein markers suffer from the same bias since few of the markers are studied directly by a metabarcoding approach (i.e. specifically amplified and high-throughput sequenced) and consequently such databases are also strongly dependent on genome sequencing. In contrast, rRNA databases (SSU and LSU) do not have such limitations but these short sequences (around 1.5 kbp) are not always in the fragmented contaminated chromosomes.
Our survey of bioinformatics tools confirms some findings from the study of Arredondo-Alonso [21] 480 such as the general performance of cBar and Recycler. Finally, not any solution alone to be effective and their combination limits the presence of false positives in the sorted plasmid fraction. All the thresholds used in our workflow, called PlasPredict, were adjusted to minimize this major criterion. Briefly, a reference approach was used in parallel with a method based on the genomic signature (PlasFlow) to optimize the predicted plasmids. With this pipeline, we predicted plasmid contents of around 25 and 33%. Using the data of Zhang et al. [6] we improved the plasmid-chromosome ratio (in bp) from 2.12 in a previous study [7] to 8.57.
Few studies have investigated plasmid reconstruction in the environment. The present survey could provide some reasons why. Specific tools are developed mainly to assemble plasmids from individual genomes, and the use of long reads, which can give a solution to the treatment of the repeated 490 sequences, is hampered by the overall low performances of hybrid assemblers in a metagenomic 2 3 4 5 6 7 8 9 10 11 12 13 14 15 16 17 18 19 20 21 22 23 24 25 26 27 28 29 30 31 32 33 34 35 36 37 38 39 40 41 42 43 44 45 46 47 48 49 50 51 52 53 54 55 56 57 58 59
For Peer Review
context. A better understanding of gene flow in ecosystems and between biomes, mediated by plasmids, will be achieved by the development of specific tools together with improved plasmid DNA extraction.
Funding
This study was supported by the EC2CO funding from the CNRS-INEE 2 3 4 5 6 7 8 9 10 11 12 13 14 15 16 17 18 19 20 21 22 23 24 25 26 27 28 29 30 31 32 33 34 35 36 37 38 39 40 41 42 43 44 45 46 47 48 49 50 51 52 53 54 55 56 57 58 59
For Peer Review
Key points A plasmidome approach associating DNA plasmid extraction and appropriate bioinformatics
500 tools is the best method to study the dissemination of antibiotic resistance or xenobiotic-degrading genes in biomes.
Hybrid assemblies did not outperform short-read assemblies and generated the largest proportion of chimeric sequences from shot-gun simulations.
Reference approaches for detecting plasmids gave the greatest precision but also the worst recall. These methods are ineffective for analyzing data from environments.
The combined use of dedicated predicting tools did not increase plasmid prediction. PlasFlow software seemed to be the best compromise for minimizing false positives and maximizing plasmid coverage. 2 3 4 5 6 7 8 9 10 11 12 13 14 15 16 17 18 19 20 21 22 23 24 25 26 27 28 29 30 31 32 33 34 35 36 37 38 39 40 41 42 43 44 45 46 47 48 49 50 51 52 53 54 55 56 57 58 59
For Peer Review
510 Legends
Table 1: Main software dedicated to the analysis of the plasmids from genome or metagenome contents. In this paper the following tools were benchmarked at various steps: cBar, PlasFlow, Recycler and metaplasmidSPAdes.
Table 2: Main assembly statistics for the simulated plasmidomes. Total and misassembled lengths represent the sum length (bp) of all contigs above 1,000 bp. % Misassembled contigs represent the percentage of these contigs in assembly: misassembled length over total length. Reference coverage expressed in percentage is the number of bases in the reference database used for sequencing simulation covered by correct contigs (excluding misassembled contigs). The second reference 520 coverage computed included all contigs (correct and misassembled contigs). Complete plasmids correspond to plasmids covered by only one contig covered by more than 90 % of its length. Contaminated contigs in percentage is the length of chromosome contigs over total length. Worst values are shown in shades of red and the best in shades of blue (a, b and c).
Table 3: Plasmids and chromosome sequences detected in both plasmidomes. Raw assembly corresponds to contigs in bp with a minimal length of 1,000 bp. Referenced contaminants (%) are the percentage of contigs aligned against the prokaryotic chromosome database. rRNA (%) is the percentage of contigs that contain such sequences (SSU/LSU). Protein markers (%) are the percentage of contigs that contain such markers from bacteria or Archaea. Chromosomes (%) correspond to the percentage of contigs mapped against referenced prokaryotic chromosomes, rRNA and/or protein marker databases. Referenced plasmids (%) are the proportion of contigs aligned against the plasmid sequence database. Circular (%) are the circular contigs detected from the raw assemblies and plasmid markers are the percentage of contigs that contain a plasmid marker. Plasmids are the plasmids identified as “true” plasmids among the “plasmidome” inferred from the columns: referenced plasmids (%), circular (%) and plasmid markers. Predicted plasmids are the final results corresponding to the balance between the learning method and the reference based methods.
Figure 1: Reference coverage for short-read assemblies with sequencing coverage between 1X and 20X
Figure 2: N50, largest contigs and misassembled contigs for assembly with short-read sequencing depth of 10X alone or in combination with long-read sequencing depth of 1X
2 3 4 5 6 7 8 9 10 11 12 13 14 15 16 17 18 19 20 21 22 23 24 25 26 27 28 29 30 31 32 33 34 35 36 37 38 39 40 41 42 43 44 45 46 47 48 49 50 51 52 53 54 55 56 57 58 59
For Peer Review
Figure 3: Plasmid reference coverages and contamination for Megahit and MetaSPAdes assemblies with various strategies for discriminating plasmids from chromosomes: cBar, PlasFlow, contig alignment against databases and detection of specific plasmid markers. PlasFlow10 to PlasFlow90 represents the detected plasmid sequences with PlasFlow with a threshold varying from 10 % to 90 %. Chromosome alignment corresponds to the detection of the microbial (bacteria/Archaea) sequences (i.e. contaminants) excluded therefore from the final results. The microbial databases were clustered 530 at various cut-offs to simulate a distance between the reference database and the environments studied.
Plasmid markers correspond to the plasmid sequences detected by alignment against plasmid markers. Reference is the reference assembly without decontamination. The best decontaminated assembly (i.e. plasmidome) is an assembly with the lowest contamination rate and the highest reference coverage rate.
Figure 4: Precision and recall for Megahit and MetaSPAdes assembly after all decontamination methods given in Figure 3. The best decontaminated assembly is an assembly with the highest recall and precision.
Figure 5: Workflow PlasPredict used for reconstructing plasmids from environmental DNA. In a first 540 step (1), the database-guided and training (PlasFlow) approaches are used in parallel. The plasmid can be detected by similarity search (2) of specific markers and/or reference-free approach (3). The chromosomal contaminants are excluded from the final results (4). “+” means that contigs are identified as plasmids and added to the predicted plasmids pool whereas “-” means that the contig is considered as chromosomal contaminant and then removed from the final results.
2 3 4 5 6 7 8 9 10 11 12 13 14 15 16 17 18 19 20 21 22 23 24 25 26 27 28 29 30 31 32 33 34 35 36 37 38 39 40 41 42 43 44 45 46 47 48 49 50 51 52 53 54 55 56 57 58 59
For Peer Review
References1. Jones BV, Marchesi JR. Transposon-aided capture (TRACA) of plasmids resident in the human gut mobile metagenome. Nat. Methods 2007; 4:55–61
2. Dib JR, Wagenknecht M, Farías ME, et al. Strategies and approaches in plasmidome studies— uncovering plasmid diversity disregarding of linear elements? Front. Microbiol. 2015; 463 3. Szczepanowski R, Bekel T, Goesmann A, et al. Insight into the plasmid metagenome of
wastewater treatment plant bacteria showing reduced susceptibility to antimicrobial drugs analysed by the 454-pyrosequencing technology. J. Biotechnol. 2008; 136:54–64
4. Kav AB, Sasson G, Jami E, et al. Insights into the bovine rumen plasmidome. PNAS 2012; 109:5452–5457
5. Ma Y, Paulsen IT, Palenik B. Analysis of two marine metagenomes reveals the diversity of plasmids in oceanic environments. Environmental Microbiology 2012; 14:453–466
6. Zhang T, Zhang X-X, Ye L. Plasmid Metagenome Reveals High Levels of Antibiotic Resistance Genes and Mobile Genetic Elements in Activated Sludge. PLoS ONE 2011; 6:e26041
7. Krawczyk PS, Lipinski L, Dziembowski A. PlasFlow: predicting plasmid sequences in metagenomic data using genome signatures. Nucleic Acids Res 2018; 46:e35
8. Conlan S, Park M, Deming C, et al. Plasmid Dynamics in KPC-Positive Klebsiella pneumoniae during Long-Term Patient Colonization. mBio 2016; 7:e00742-16
9. Liu B, Pop M. ARDB--Antibiotic Resistance Genes Database. Nucleic Acids Res. 2009; 37:D443-447
10. Leplae R, Lima-Mendez G, Toussaint A. ACLAME: a CLAssification of Mobile genetic Elements, update 2010. Nucleic Acids Res. 2010; 38:D57-61
11. Roosaare M, Puustusmaa M, Möls M, et al. PlasmidSeeker: identification of known plasmids from bacterial whole genome sequencing reads. PeerJ 2018; 6:e4588
12. Arredondo-Alonso S, Rogers MRC, Braat JC, et al. mlplasmids: a user-friendly tool to predict plasmid- and chromosome-derived sequences for single species. Microbial Genomics 2019; 15 13. Müller R, Chauve C. HyAsP, a greedy tool for plasmids identification. Bioinformatics 2019; 35:4436–4439
14. Carattoli A, Zankari E, García-Fernández A, et al. In Silico Detection and Typing of Plasmids using PlasmidFinder and Plasmid Multilocus Sequence Typing. Antimicrob Agents Chemother 2014; 58:3895–3903
15. Robertson J, Nash JHE. MOB-suite: software tools for clustering, reconstruction and typing of plasmids from draft assemblies. Microbial Genomics 2018; 4:
2 3 4 5 6 7 8 9 10 11 12 13 14 15 16 17 18 19 20 21 22 23 24 25 26 27 28 29 30 31 32 33 34 35 36 37 38 39 40 41 42 43 44 45 46 47 48 49 50 51 52 53 54 55 56 57 58 59
For Peer Review
16. Vielva L, de Toro M, Lanza VF, et al. PLACNETw: a web-based tool for plasmid reconstruction from bacterial genomes. Bioinformatics 2017; 33:3796–3798
17. Zhou F, Xu Y. cBar: a computer program to distinguish plasmid-derived from chromosome-derived sequence fragments in metagenomics data. Bioinformatics 2010; 26:2051–2052
18. Antipov D, Hartwick N, Shen M, et al. plasmidSPAdes: assembling plasmids from whole genome sequencing data. Bioinformatics 2016; 32:3380–3387
19. Rozov R, Brown Kav A, Bogumil D, et al. Recycler: an algorithm for detecting plasmids from de novo assembly graphs. Bioinformatics 2017; 33:475–482
20. Antipov D, Raiko M, Lapidus A, et al. Plasmid detection and assembly in genomic and metagenomic data sets. Genome Res. 2019; 29:961–968
21. Arredondo-Alonso S, Willems RJ, van Schaik W, et al. On the (im)possibility of reconstructing plasmids from whole-genome short-read sequencing data. Microb Genom 2017; 3:
22. Laczny CC, Galata V, Plum A, et al. Assessing the heterogeneity of in silico plasmid
predictions based on whole-genome-sequenced clinical isolates. Brief Bioinform 2019; 20:857–865 23. Debroas D, Siguret C. Viruses as key reservoirs of antibiotic resistance genes in the
environment. ISME J 2019; 1–12
24. O’Leary NA, Wright MW, Brister JR, et al. Reference sequence (RefSeq) database at NCBI: current status, taxonomic expansion, and functional annotation. Nucleic Acids Res. 2016; 44:D733-745
25. Angly FE, Willner D, Rohwer F, et al. Grinder: a versatile amplicon and shotgun sequence simulator. Nucl. Acids Res. 2012; 40:e94–e94
26. Li D, Liu C-M, Luo R, et al. MEGAHIT: an ultra-fast single-node solution for large and
complex metagenomics assembly via succinct de Bruijn graph. Bioinformatics 2015; 31:1674–1676 27. Nurk S, Meleshko D, Korobeynikov A, et al. metaSPAdes: a new versatile metagenomic assembler. Genome Research 2017; 27:824–834
28. Antipov D, Korobeynikov A, McLean JS, et al. hybridSPAdes: an algorithm for hybrid assembly of short and long reads. Bioinformatics 2016; 32:1009–1015
29. Wick RR, Judd LM, Gorrie CL, et al. Unicycler: Resolving bacterial genome assemblies from short and long sequencing reads. PLoS Comput Biol 2017; 13:
30. Huang X, Madan A. CAP3: A DNA sequence assembly program. Genome Res. 1999; 9:868– 877
31. Camacho C, Coulouris G, Avagyan V, et al. BLAST+: architecture and applications. BMC Bioinformatics 2009; 10:421 2 3 4 5 6 7 8 9 10 11 12 13 14 15 16 17 18 19 20 21 22 23 24 25 26 27 28 29 30 31 32 33 34 35 36 37 38 39 40 41 42 43 44 45 46 47 48 49 50 51 52 53 54 55 56 57 58 59
For Peer Review
32. Hyatt D, Chen G-L, LoCascio PF, et al. Prodigal: prokaryotic gene recognition and translation initiation site identification. BMC Bioinformatics 2010; 11:119
33. Li H. Minimap2: pairwise alignment for nucleotide sequences. Bioinformatics 2018; 34:3094– 3100
34. Rognes T, Flouri T, Nichols B, et al. VSEARCH: a versatile open source tool for metagenomics. PeerJ 2016; 4:e2584
35. Wu D, Jospin G, Eisen JA. Systematic Identification of Gene Families for Use as “Markers” for Phylogenetic and Phylogeny-Driven Ecological Studies of Bacteria and Archaea and Their Major Subgroups. PLoS One 2013; 8:
36. Birnboim HC, Doly J. A rapid alkaline extraction procedure for screening recombinant plasmid DNA. Nucleic Acids Res. 1979; 7:1513–1523
37. Mikheenko A, Saveliev V, Gurevich A. MetaQUAST: evaluation of metagenome assemblies. Bioinformatics 2016; 32:1088–1090
38. Tsai Y-C, Conlan S, Deming C, et al. Resolving the Complexity of Human Skin Metagenomes Using Single-Molecule Sequencing. mBio 2016; 7:e01948-15
39. Suzuki Y, Nishijima S, Furuta Y, et al. Long-read metagenomic exploration of extrachromosomal mobile genetic elements in the human gut. Microbiome 2019; 7:119 40. Frank JA, Pan Y, Tooming-Klunderud A, et al. Improved metagenome assemblies and taxonomic binning using long-read circular consensus sequence data. Scientific Reports 2016; 6:25373
41. Warwick-Dugdale J, Solonenko N, Moore K, et al. Long-read viral metagenomics captures abundant and microdiverse viral populations and their niche-defining genomic islands. PeerJ 2019; 7:e6800
42. Forouzan E, Shariati P, Mousavi Maleki MS, et al. Practical evaluation of 11 de novo assemblers in metagenome assembly. Journal of Microbiological Methods 2018; 151:99–105 43. Gupta SK, Raza S, Unno T. Comparison of de-novo assembly tools for plasmid metagenome analysis. Genes Genom 2019; 41:1077–1083
2 3 4 5 6 7 8 9 10 11 12 13 14 15 16 17 18 19 20 21 22 23 24 25 26 27 28 29 30 31 32 33 34 35 36 37 38 39 40 41 42 43 44 45 46 47 48 49 50 51 52 53 54 55 56 57 58 59
For Peer Review
Figure 1: Reference coverage for short-read assemblies with sequencing coverage between 1X and 20X 209x297mm (600 x 600 DPI) 2 3 4 5 6 7 8 9 10 11 12 13 14 15 16 17 18 19 20 21 22 23 24 25 26 27 28 29 30 31 32 33 34 35 36 37 38 39 40 41 42 43 44 45 46 47 48 49 50 51 52 53 54 55
For Peer Review
Figure 2: N50, largest contigs and misassembled contigs for assembly with short-reads sequencing depth of 10X alone or in combination with long-reads sequencing depth of 1X
209x297mm (600 x 600 DPI) 2 3 4 5 6 7 8 9 10 11 12 13 14 15 16 17 18 19 20 21 22 23 24 25 26 27 28 29 30 31 32 33 34 35 36 37 38 39 40 41 42 43 44 45 46 47 48 49 50 51 52 53 54 55
For Peer Review
Figure 3: Plasmid reference coverages and contamination for Megahit and MetaSPAdes assemblies with various strategies for discriminating plasmids from chromosomes: cBar, PlasFlow, contig alignment against
databases and detection of specific plasmid markers. PlasFlow10 to PlasFlow90 represents the detected plasmid sequences with PlasFlow with a threshold varying from 10 % to 90 %. Chromosome alignment corresponds to the detection of the microbial (bacteria/Archaea) sequences (i.e. contaminants) excluded
therefore from the final results. The microbial databases were clustered at various cut-offs to simulate a distance between the reference database and the environments studied. Plasmid markers correspond to the
plasmid sequences detected by alignment against plasmid markers. Reference is the reference assembly without decontamination. The best decontaminated assembly (i.e. plasmidome) is an assembly with the
lowest contamination rate and the highest reference coverage rate. 209x297mm (600 x 600 DPI) 2 3 4 5 6 7 8 9 10 11 12 13 14 15 16 17 18 19 20 21 22 23 24 25 26 27 28 29 30 31 32 33 34 35 36 37 38 39 40 41 42 43 44 45 46 47 48 49 50 51 52 53 54 55
For Peer Review
Figure 4: Precision and recall for Megahit and MetaSPAdes assembly after all decontamination methods given in Fig. 3. The best decontaminated assembly is an assembly with the highest recall and precision.
209x297mm (600 x 600 DPI) 2 3 4 5 6 7 8 9 10 11 12 13 14 15 16 17 18 19 20 21 22 23 24 25 26 27 28 29 30 31 32 33 34 35 36 37 38 39 40 41 42 43 44 45 46 47 48 49 50 51 52 53 54 55
For Peer Review
Figure 5: Workflow for reconstructing plasmids from environmental DNA. In a first step (1), the database-guided and training (PlasFlow) approaches are used in parallel. The plasmid can be detected by similarity search (2) of specific markers and/or reference-free approach (3). The chromosomal contaminants are excluded from the final results (4). “+” means that contigs are identified as plasmids and added to the predicted plasmids pool whereas “-” means that the contig is considered as chromosomal contaminant and
then removed from the final results. 209x297mm (600 x 600 DPI) 2 3 4 5 6 7 8 9 10 11 12 13 14 15 16 17 18 19 20 21 22 23 24 25 26 27 28 29 30 31 32 33 34 35 36 37 38 39 40 41 42 43 44 45 46 47 48 49 50 51 52 53 54 55
For Peer Review
Web site Metagenomes* Reference-based Linear and circular plasmids Command line Maindependencies Input References Plasmidseeker https://github.com/bioinfo-ut/PlasmidSeeker N Y Y Y Reads [11]
mlplasmid https://gitlab.com/sirarredondo/mlplasmids N Y Y Y Contigs [12]
HyAsP https://github.com/cchauve/HyAsP N Y Y Y Unicycler Reads [13]
PlasmidFinder https://cge.cbs.dtu.dk/services/PlasmidFinder/ N Y Y N Contigs/reads [14] MOB-suite https://github.com/phac-nml/mob-suite N Y Y Y Blast/Mash Contigs [15] PLACNETw/PLACNET https://castillo.dicom.unican.es/upload/ N Y Y N/Y Blast Reads [16] plasmidSPAdes http://spades.bioinf.spbau.ru/plasmidSPAdes/ N N Y Y SPAdes Reads [18]
cBar http://csbl.bmb.uga.edu/~ffzhou/cBar Y N Y Y Contigs [17]
PlasFlow https://github.com/smaegol/PlasFlow Y N Y Y Contigs [7]
Recycler http://github.com/Shamir-Lab/Recycler Y N N Y Assembly graph [19] metaplasmidSPAdes https://github.com/ablab/spades/releases Y Y N Y SPAdes Reads [20] * « Y » means the tool was benchmarked with metagenomes in the original publication Table 1 http://mc.manuscriptcentral.com/bib 2 3 4 5 6 7 8 9 10 11 12 13 14 15 16 17 18 19 20 21 22 23 24 25 26 27 28 29 30 31 32 33 34 35 36 37 38 39 40 41 42 43 44 45 46 47 48 49 50 51 52 53 54 55
For Peer Review
Assemblycoverage coverage n length (bp) d length (bp) contigs (%) contigs (bp) N50 with correct contigs (%)
coverage with
all contigs (%) complete (%) contigs (%)
a) From short reads simulations
megahit 1X - 0% 7754069 550925 7.10 20235 1440 7.22 7.65 0.00 metaspades 1X - 0% 9180006 445534 4.85 64558 1364 7.79 8.20 0.00 spades 1X - 0% 13834635 4794871 34.66 93999 1426 7.24 10.76 0.52 megahit 2X - 0% 45354852 1723221 3.80 36881 1540 24.99 25.82 0.03 metaspades 2X - 0% 55243004 1624307 2.94 47689 1522 28.43 29.41 0.02 spades 2X - 0% 64391949 17593195 27.32 63759 1590 23.82 33.04 0.02 megahit 5X - 0% 184331120 2068908 1.12 184557 4075 80.97 81.82 0.57 metaspades 5X - 0% 189634492 4169961 2.20 184228 4823 81.69 83.60 0.71 spades 5X - 0% 194159420 8605658 4.43 184789 4899 81.06 84.70 0.64 megahit 10X - 0% 204907565 1672279 0.82 369321 35107 89.32 89.97 4.06 metaspades 10X - 0% 206878234 7172134 3.47 423338 48043 87.98 91.00 6.07 spades 10X - 0% 209308318 9352071 4.47 482749 48638 87.71 91.49 6.69 megahit 20X - 0% 205727370 1970120 0.96 708657 50875 89.49 90.11 9.29 metaspades 20X - 0% 209576906 10149466 4.84 1770377 82150 87.57 91.85 18.03 spades 20X - 0% 210291727 8542764 4.06 1770377 75082 88.40 91.94 17.83
b) From short and long reads simulations
hybridspades 10X 0.5X 0% 209730275 10282930 4.90 536288 50331 86.77 91.16 7.03 unicycler 10X 0.5X 0% 208934694 26100159 12.49 577073 68225 78.62 89.70 8.98 hybridspades 10X 1X 0% 210377746 14367807 6.83 534238 53853 84.79 90.73 8.12 unicycler 10X 1X 0% 209774996 30316910 14.45 752078 82519 77.18 90.00 12.08 Megahit – Cap3 10X 1X 0% 249465543 7866908 3.15 369321 33227 87.70 92.49 4.61 Megahit - Cap3 - Stringent 10X 1X 0% 250142133 6016698 2.41 369321 32832 88.89 92.65 4.59 Metaspades – Cap3 10X 1X 0% 256083981 13965873 5.45 423338 38777 86.30 92.90 6.42 Spades – Cap3 10X 1X 0% 258846343 16001671 6.18 482749 39008 86.47 93.55 7.61 hybridspades 10X 5X 0% 213699173 17741861 8.30 737940 87465 83.71 91.42 13.25 unicycler 10X 5X 0% 211679873 44223580 20.89 1848068 148453 72.10 90.30 27.91
c) From short reads simulations with chromosomal contaminants
hybridspades 10X 1X 5% 210335012 14456376 6.87 534238 53636 84.74 90.70 7.72 0.01 megahit 10X - 5% 204919768 1670453 0.82 369321 35107 89.30 89.95 4.06 0.01 metaspades 10X - 5% 206899547 7186550 3.47 490307 47642 87.97 90.99 6.09 0.01 spades 10X - 5% 209321084 9653329 4.61 423183 48272 87.53 91.42 6.57 0.01 unicycler 10X 1X 5% 209448198 27524025 13.14 752099 86673 78.63 90.34 13.29 0.00 hybridspades 10X 1X 10% 210362788 14176203 6.74 534238 52433 84.92 90.75 7.59 0.07 megahit 10X - 10% 204981148 1581307 0.77 369321 35061 89.35 89.96 4.06 0.04 metaspades 10X - 10% 206970669 7003163 3.38 423338 47486 88.05 91.00 6.07 0.04 spades 10X - 10% 209468807 9473070 4.52 423183 48075 87.59 91.42 6.56 0.07 unicycler 10X 1X 10% 209513583 27536588 13.14 752099 87032 78.64 90.35 13.29 0.03 hybridspades 10X 1X 20% 211094213 13577116 6.43 483641 51623 85.06 90.93 7.26 0.57 megahit 10X - 20% 205323582 1618304 0.79 369321 34921 89.31 89.93 4.10 0.21 metaspades 10X - 20% 207330588 6911208 3.33 490307 46983 88.09 91.00 6.07 0.21 spades 10X - 20% 210561986 9273383 4.40 482749 48199 87.67 91.42 6.56 0.57 unicycler 10X 1X 20% 209671215http://mc.manuscriptcentral.com/bib26008378 12.40 752099 86648 79.38 90.41 13.43 0.13 2 3 4 5 6 7 8 9 10 11 12 13 14 15 16 17 18 19 20 21 22 23 24 25 26 27 28 29 30 31 32 33 34 35 36 37 38 39 40 41 42 43 44 45 46 47 48 49 50 51 52 53 54 55
For Peer Review
http://mc.manuscriptcentral.com/bib 2 3 4 5 6 7 8 9 10 11 12 13 14 15 16 17 18 19 20 21 22 23 24 25 26 27 28 29 30 31 32 33 34 35 36 37 38 39 40 41 42 43 44 45 46 47 48 49 50 51 52 53 54 55For Peer Review
Length (bp) Chromosomes (%) rRNA (%) markers (%) contaminants (%) Plasmids (%) Circular (%) markers (%) Plasmids (%) predicted plasmids (bp) predicted plasmids ( %)Biofilm Raw assembly 8.15E+07 21.27 0.07 4.22 21.27 7.02 1.72 3.05 7.02
After PlasFlow70 2.47E+07 9.33 0.04 0.49 9.33 17.07 3.96 8.35 17.07 2.37E+07 29.10
WWTP Raw assembly 3.89E+08 6.50 0.16 1.25 6.50 2.16 0.47 0.71 2.16
After PlasFlow70 9.93E+07 4.90 0.05 0.35 4.90 5.43 0.94 3.18 5.43 9.68E+07 24.91
WWTP [6] Raw assembly 5017040 3.96 0.23 3.48 0.24 0.32 0.00 0.07 0.25 After PlasFlow70 1739823 2.33 0.21 1.95 0.17 0.30 0.00 0.08 0.23 1704143 33.97 Table 3 http://mc.manuscriptcentral.com/bib 2 3 4 5 6 7 8 9 10 11 12 13 14 15 16 17 18 19 20 21 22 23 24 25 26 27 28 29 30 31 32 33 34 35 36 37 38 39 40 41 42 43 44 45 46 47 48 49 50 51 52 53 54 55
For Peer Review
2 3 4 5 6 7 8 9 10 11 12 13 14 15 16 17 18 19 20 21 22 23 24 25 26 27 28 29 30 31 32 33 34 35 36 37 38 39 40 41 42 43 44 45 46 47 48 49 50 51 52 53 54 55 56 57 58 59For Peer Review
2 3 4 5 6 7 8 9 10 11 12 13 14 15 16 17 18 19 20 21 22 23 24 25 26 27 28 29 30 31 32 33 34 35 36 37 38 39 40 41 42 43 44 45 46 47 48 49 50 51 52 53 54 55 56 57 58 59For Peer Review
Assembly : Megahit, Metaspades Spades Hybrid assembly: HybridSpades, Unicycler Megahit/Spades with Cap3Long read assembly:
Unicycler Contigs Long reads (6 Kb) 0.5X 1X 5X Short reads (150 bp) 1X 2X 10X 20X Plasmids
database Chromosomes database
Table 2, Figures 1 and 2 Table 1 Sup. Mat.
Plasmid prediction:
Recycler / Circular contigs PlasFlow
cBar
Alignments vs plasmid markers Alignments vs chromosomes
Figures 3 and 4 Figures 4 Sup. Mat. Plasmids
Fig 3 supplementary materials : main bioinformatics tools used for producing contigs and sorting 2 3 4 5 6 7 8 9 10 11 12 13 14 15 16 17 18 19 20 21 22 23 24 25 26 27 28 29 30 31 32 33 34 35 36 37 38 39 40 41 42 43 44 45 46 47 48 49 50 51 52 53 54 55 56 57 58 59
For Peer Review
Fig 4 supplementary materials: Plasmid reference coverages and contamination (A) and precision and recall (B) for Megahit and MetaSPAdes assemblies. Various strategies were used for discriminating plasmids from chromosomes: cBar, PlasFlow, contig alignment against databases and detection of specific plasmid markers. PlasFlow10 to PlasFlow90 represents the detected plasmid sequences with PlasFlow with a threshold varying from 10 % to 90 %. cBar+PlasFlow70 to cBar+PlasFlow90 means that these two tools were used together with the thresholds 70 %, 80% and 90 % associated with PlasFlow. Chromosome alignment corresponds to the detection of the microbial (bacteria/Archaea) sequences (i.e. contaminants) excluded therefore from the final results. The microbial databases were clustered at various cut-offs to simulate a distance between the reference database and the environments studied. Plasmid markers correspond to the plasmid sequences detected by alignment against plasmid markers. Reference is the reference assembly without
A B 2 3 4 5 6 7 8 9 10 11 12 13 14 15 16 17 18 19 20 21 22 23 24 25 26 27 28 29 30 31 32 33 34 35 36 37 38 39 40 41 42 43 44 45 46 47 48 49 50 51 52 53 54 55 56 57 58 59
For Peer Review
2 3 4 5 6 7 8 9 10 11 12 13 14 15 16 17 18 19 20 21 22 23 24 25 26 27 28 29 30 31 32 33 34 35 36 37 38 39 40 41 42 43 44 45 46 47 48 49 50 51 52 53 54 55 56 57 58 59For Peer Review
2 3 4 5 6 7 8 9 10 11 12 13 14 15 16 17 18 19 20 21 22 23 24 25 26 27 28 29 30 31 32 33 34 35 36 37 38 39 40 41 42 43 44 45 46 47 48 49 50 51 52 53 54 55 56 57 58 59For Peer Review
2 3 4 5 6 7 8 9 10 11 12 13 14 15 16 17 18 19 20 21 22 23 24 25 26 27 28 29 30 31 32 33 34 35 36 37 38 39 40 41 42 43 44 45 46 47 48 49 50 51 52 53 54 55 56 57 58 59For Peer Review
Assembly Contamination Total length Longest contig N50
unicycler - 0.5X - 225825 48963 21.68 25317 11967 0,70 0 unicycler - 1X - 986299 379673 38.49 43851 12812 0,80 0 unicycler - 5X - 51962192 13860198 26.67 169615 10866 17,69 0,21
Short-reads
coverage Long-reads coverage Misassembled length %Misassembled contigs %Reference coverage %Plasmids complete
Table 1 supplementary materials: Main assembly statistics for the simulated plasmidomes with only long-reads
http://mc.manuscriptcentral.com/bib 2 3 4 5 6 7 8 9 10 11 12 13 14 15 16 17 18 19 20 21 22 23 24 25 26 27 28 29 30 31 32 33 34 35 36 37 38 39 40 41 42 43 44 45 46 47 48 49 50 51 52 53 54 55