HAL Id: inserm-01857833
https://www.hal.inserm.fr/inserm-01857833
Submitted on 17 Aug 2018
HAL is a multi-disciplinary open access
archive for the deposit and dissemination of
sci-entific research documents, whether they are
pub-lished or not. The documents may come from
teaching and research institutions in France or
abroad, or from public or private research centers.
L’archive ouverte pluridisciplinaire HAL, est
destinée au dépôt et à la diffusion de documents
scientifiques de niveau recherche, publiés ou non,
émanant des établissements d’enseignement et de
recherche français ou étrangers, des laboratoires
publics ou privés.
kinase activity
Sanja Brolih, Scott Parks, Valérie Vial, Jérome Durivault, Livio Mostosi,
Jacques Pouysségur, Gilles Pagès, Vincent Picco
To cite this version:
Sanja Brolih, Scott Parks, Valérie Vial, Jérome Durivault, Livio Mostosi, et al.. AKT1 restricts the
invasive capacity of head and neck carcinoma cells harboring a constitutively active PI3 kinase activity.
BMC Cancer, BioMed Central, 2018, 18 (1), pp.249. �10.1186/s12885-018-4169-0�. �inserm-01857833�
R E S E A R C H A R T I C L E
Open Access
AKT1 restricts the invasive capacity of head
and neck carcinoma cells harboring a
constitutively active PI3 kinase activity
Sanja Brolih
1†, Scott K. Parks
1†, Valérie Vial
1, Jérôme Durivault
1, Livio Mostosi
1, Jacques Pouysségur
1,
Gilles Pagès
1,2and Vincent Picco
1*Abstract
Background: In mammals, the AKT/PKB protein kinase family comprises three members (AKT1
–3). PI3-Kinase (PI3K),
a key oncogene involved in a wide variety of cancers, drives AKT activity. Constitutive activation of the PI3K/AKT
pathway has been associated with tumorigenic properties including uncontrolled cell proliferation and survival,
angiogenesis, promotion of cellular motility, invasiveness and metastasis. However, AKT1 activity has also been
recently shown to repress the invasive properties of breast cancer cells in specific contexts.
Methods: This study used both pharmacological and shRNA approaches to inhibit AKT function, microscopy to
characterize the cellular morphology, 3D spheroid models to assess migratory and invasive cellular capacities and a
phenotypic screening approach based on electrical properties of the cells.
Results: Here we demonstrate that the alternative action of AKT1 on invasive properties of breast cancers can be
extended to head and neck carcinomas, which exhibit constitutive activation of the PI3K/AKT pathway. Indeed,
inhibition of AKT1 function by shRNA or a specific pharmacological inhibitor resulted in cellular spreading and an
invasive phenotype. A phenotypic screening approach based on cellular electrical properties corroborated microscopic
observations and provides a foundation for future high-throughput screening studies. This technique further showed
that the inhibition of AKT1 signaling is phenocopied by blocking the mTORC1 pathway with rapamycin.
Conclusion: Our study suggests that the repressive action of PI3K/AKT1 on cellular invasive properties may be a
mechanism common to several cancers. Current and future studies involving AKT inhibitors must therefore consider
this property to prevent metastases and consequently to improve survival.
Keywords: Cancer, Metastasis, AKT/PKB, Head and neck squamous cell carcinoma, Phenotypic screening,
Epithelial-mesenchymal transition, Adhesion, Migration, Invasion
Background
The serine/threonine kinase AKT promotes the
epithelial-mesenchymal transition (EMT), cellular motility and
inva-sion in a wide variety of physiological and pathological
conditions. In developing vertebrate embryos, the EMT
events leading to the formation of mesoderm during
gas-trulation rely on AKT activity and its upstream activator
phosphatidylinositol 3-kinase (PI3K) [
1
–
3
]. AKT activity is
also associated with EMT, migration and invasion in a
di-verse range of tumor cell models [
4
–
6
]. Furthermore,
AKT is a major mediator of cell survival through direct
in-hibition of pro-apoptotic proteins. Based on these
obser-vations, AKT was proposed to be a suitable target for
anticancer therapies and clinical trials using inhibitors of
PI3K or AKT have been performed previously and are
on-going [
7
].
Among the most recent clinically suitable AKT
inhibi-tors, MK-2206, an allosteric inhibitor targeting AKT
iso-forms 1
–3 with an affinity in the nanomolar range, has
undergone phase II clinical trials in several cancer types
[
8
–
11
]. Despite acceptable tolerance and promising
* Correspondence:vpicco@centrescientifique.mc
†Equal contributors
1Centre Scientifique de Monaco, Department of Medical Biology, 8 Quai
Antoine Ier, Monaco, Principality of Monaco
Full list of author information is available at the end of the article
© The Author(s). 2018 Open Access This article is distributed under the terms of the Creative Commons Attribution 4.0 International License (http://creativecommons.org/licenses/by/4.0/), which permits unrestricted use, distribution, and reproduction in any medium, provided you give appropriate credit to the original author(s) and the source, provide a link to the Creative Commons license, and indicate if changes were made. The Creative Commons Public Domain Dedication waiver (http://creativecommons.org/publicdomain/zero/1.0/) applies to the data made available in this article, unless otherwise stated.
Brolihet al. BMC Cancer (2018) 18:249 https://doi.org/10.1186/s12885-018-4169-0
preclinical results, none of the clinical trials have shown
favorable effects for MK-2206 treatment [
8
–
24
].
Inter-estingly, the different AKT isoforms can display
drastic-ally different functions, especidrastic-ally with regards to cell
migration. For example, preclinical data suggested that
AKT2 promotes metastasis in ovarian and breast cancer
cell models [
25
,
26
] while AKT1 was proposed to inhibit
the migration and metastasis of breast cancers [
27
–
30
].
Collectively, these results raise concerns over the clinical
outcomes of pan-AKT inhibitors and indicate the
poten-tial benefits of pursuing isoform-specific inhibitors.
In the present study, we extend recent results showing
that AKT1 restricts the invasive potential of breast tumor
cells [
27
–
30
] to head and neck squamous cell carcinoma
(HNSCC) cells. In these HNSCC model cell lines,
AKT1 inhibition induced a drastic change in the cellular
morphology of the CAL33 oral cancer cell line that is
as-sociated with increased migratory and invasive capacities.
By means of phenotypic screening based on electrical
cel-lular properties, we identified other HNSCC cell lines that
either demonstrated the same phenotype (Detroit562) or
an absence of drug sensitivity (CAL27). We next screened
for other anti-cancer compounds and showed that the
mTORC1 inhibitor rapamycin induces a comparable
modification of the cellular electrical properties and
modi-fication of CAL33 and Detroit562 cell morphology. Our
results therefore extend the concept that AKT1 exerts an
anti-metastatic effect. Finally, our results suggest that
some anti-cancer drugs may induce a pro-metastatic effect
and proposes an efficient in vitro screen to evaluate this
effect. This unexpected detrimental effect of anti-cancer
drugs should be considered with caution and emphasizes
the need for personalized therapies.
Methods
Cell lines, shRNAs and pharmacological inhibitors
All cell lines used in this study were cultured in
Dulbec-co’s Modified Eagle’s Medium (DMEM, Invitrogen)
sup-plemented with 7.5% heat-inactivated fetal calf serum
(FCS) at 37 °C in an atmosphere of 5% CO
2.The three
hu-man head and neck cancer cell lines used in this study,
CAL33, CAL27 and Detroit562 were provided through a
Material Transfer Agreement with the Oncopharmacology
Laboratory, Centre Antoine Lacassagne (Nice, France)
where they had initially been isolated [
31
]. For
knock-down experiments, the cells were infected using a
lenti-viral vector containing non-target control or two
inde-pendent sequences of shRNA targeting the product of the
AKT1 gene (shAKT1.1 5′- GGACAAGGACGGGCACAT
TAA -3′ and shAKT1.2 5′- CTATGGCGCTGAGATTG
TGTC -3′) cloned in pLKO.1 puro, (gift from Bob
Wein-berg, Addgene plasmid #8453) according to the protocol
available at
www.addgene.com
. A total population of cells
was generated by selection with 10
μg/mL puromycin for
10–15 days. MK-2206 (S1078, Selleck Chemicals) AKT
in-hibitor was used at a final concentration of 5
μM.
Rapa-mycin (S1039, Sellek Chemicals) mTORC1 inhibitor was
used at a final concentration of 5
μM. Erlotinib (S7786,
Selleck Chemicals) EGFR inhibitor was used at a final
con-centration of 5
μM.
Phalloidin staining and e-cadherin immunostaining
Cells were grown at low density on glass coverslips or
24-well plates and fixed with PBS-4% paraformaldehyde
(PFA) for 10 min followed by saturation for 30 min in
PBS-3% skim milk-0.1% Triton X-100. Cells were then
stained with phalloidin actin-stain 555 (Euromedex)
ac-cording to the manufacturer’s protocols. In certain
prepa-rations, immunostaining was then performed afterwards
by incubating the cells overnight at 4 °C in the dark in a
1/100 dilution of an e-cadherin antibody (14,472, Cell
Signaling Technology). Cells were then washed 3 times in
PBS, incubated for 2 h at room temperature in the dark in
a 1/500 dilution of an anti-mouse Alexa Fluor 488
conju-gated antibody (4408, Cell Signaling Technology) and
washed 3 times in PBS. The nuclear DNA was
counter-stained with Hoechst 33,342 (4082, Cell Signaling
Tech-nology) according to the manufacturer’s protocols. Cells
grown on coverslips were mounted onto slides with
Pro-long Gold Antifade moutant (Thermo Fischer Scientitifc)
and images were captured using a Leica DMI-4000
micro-scope (Leica Microsystems) equipped with a Zyla 5.5
sCMOS camera (Andor). Measurement of the surface
area of the cell colonies, the cell-cell contact
e-cadherin staining and counting of the nuclei were
performed with ImageJ 1.51j8 software (National Institute
of Health). Graphic representations and statistical analyses
were generated using Prism 5 (Graphpad Software).
Immunoblotting
The following antibodies were used for immunoblotting:
anti-phospho AKT pS473 (Cell Signalling Technology,
Cat. No. 4051S), anti-pan-AKT (Cell Signalling
Technol-ogy, Cat. No. 9272S), anti-AKT1 and AKT2 (sc-5270
and sc-1618 respectively, Santa Cruz Biotechnology)
and anti-GAPDH (Thermo Fischer Scientific, Cat. No.
MA5–15738).
Cell migration and invasion
Four thousand cells were seeded in 20
μL hanging
drops of DMEM supplemented with 7.5% FCS to
ob-tain spheroids. After 7 days, they were transferred in
DMEM-3% FCS supplemented with 1
μg/mL Matrigel
(Corning Inc) and cultured for 8 days. Pictures were
taken with an AMG Evos microscope 40× objective
(Thermo Fisher Scientific Inc) and spheroid surface
areas were measured using ImageJ 1.51j8 software
(National Institute of Health).
Electrical cell impedance measurements
Electrode-containing arrays 8W10E+ (Ibidi, Cat. No.72040)
were equilibrated with 400
μL of DMEM-7.5% FCS for 1 h
on the ECIS Z Theta apparatus (Ibidi). 200
μL of medium
was then removed and replaced by 200
μL of cell
suspen-sion containing 250.000 cells +/− 10 μM MK-2206 (Selleck
Chemicals, Cat. No.S1078), 10
μM Rapamycin (Selleck
Chemicals, Cat. No.S1039) or 10
μM Erlotinib (Selleck
Chemicals, Cat. No.S7786). Electrical properties of the cells
were then measured for 15 h. Raw data were exported from
the ECIS software and used to generate graphical
represen-tations with the Prism software (Additional files
1
,
2
,
3
,
4
,
5
,
6
,
7
,
8
and
9
). Phenotypic differences were determined via
analyses over a 4 h period of the most robust increase in
electrode resistance (measured at 4000 Hz) during the cell
attachment phase (Additional file
9
).
Cell viability and proliferation assays
The viability of CAL33 cells was measured after 48 h of
cell culture +/− 10 μM MK-2206 or 5 μM Rapamycin
with an Adam apparatus (NanoEntek) according to the
manufacturer’s instructions. For proliferation assays,
25,000 cells were seeded in duplicate in 60 mm diameter
dishes in DMEM-7.5% FCS. Twenty-four hours later,
medium was replaced with DMEM-7.5% FCS in the
presence or absence of MK-2206 (5
μM) or Rapamycin
(5
μM). Cells were counted with a Z Series Coulter
(Beckman Coulter Life Sciences) on day 3 and 4.
Statistical methods
Statistical analyses presented in the figures were
per-formed on at least 3 independent replicates. One-way
ANOVA with Bonferroni’s post-test was performed
using GraphPad Prism v5.03 (GraphPad Software) to
de-termine significance of the observed effects.
Results
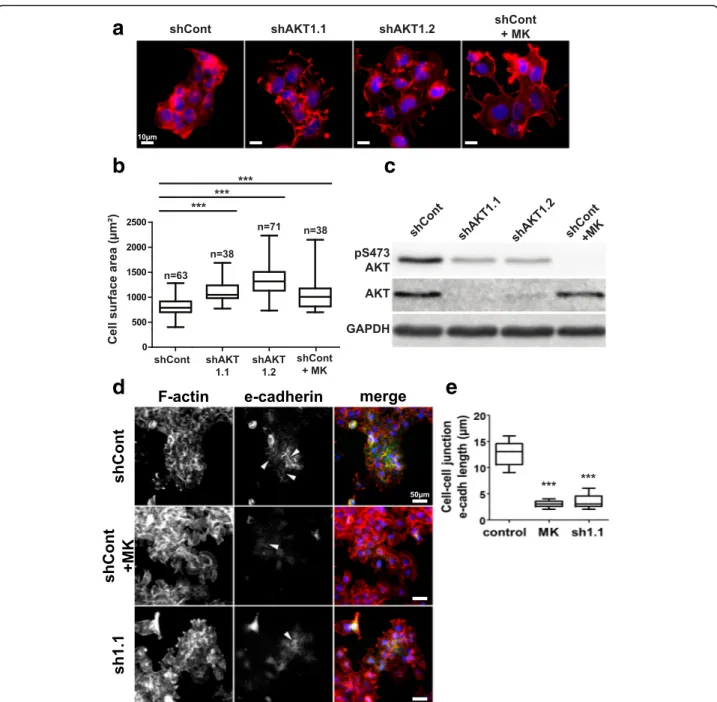
Inhibition of AKT1 induces morphological changes in
CAL33 cells
Inhibition of AKT activity in the PI3K/AKT constitutively
active CAL33 cell line was performed with either
MK-2206, a pharmacological inhibitor that targets AKT
iso-forms 1–3 or with two independent AKT1-specific shRNA
sequences. Both methods of AKT inhibition resulted in
strong alterations of cellular morphology as revealed by
staining of the actin cytoskeleton with Alexa555-coupled
phalloidin (Fig.
1a
). CAL33 cells increased spreading,
formed looser cell-cell contacts and exhibited a
signifi-cantly increased surface area when AKT was inhibited
(Fig.
1b
). Decreased gene expression levels of AKT1 by
two independent shRNA sequences specific to AKT1
strongly reduced both total AKT protein expression and
AKT activity as revealed by reduced phosphorylation at
the S473 site (Fig.
1c
). Similarly, cells treated with the
AKT inhibitor experienced an even stronger reduction of
AKT phosphorylation (Fig.
1c
). Moreover, western blots
performed with antibodies specific to either AKT1 or
AKT2 revealed that AKT1 is the major isoform expressed
in the CAL33 cells (Additional file
10
: Figure S1). The
ob-served morphological changes induced by the inhibition
of AKT in CAL33 cells are typical of a loss of epithelial
phenotype. We observed disruption of the epithelial
marker e-cadherin expression and membrane localization
in these conditions, suggesting the occurrence of an
EMT-like process (Fig.
1d
and
e
and Additional file
11
:
Figure S2). Combined, these results indicate that AKT1
activity is necessary to maintain CAL33 cells epithelial
morphology.
Inhibition of AKT1 increases invasion capacity of CAL33
cells
The increased spreading of the CAL33 cells induced by
AKT1 inhibition suggested that their invasive capacities
may be increased as well under these conditions. We
tested this hypothesis in a 3D spheroid invasion assay in
purified extracellular matrix (Matrigel, Corning).
Inhib-ition of AKT1 via both shRNA and pharmacology
strongly increased cell spreading from the spheroids into
the extracellular matrix after eight days (Fig.
2a
and
b
)
thus suggesting an increased cellular ability to invade
and migrate through a matrix.
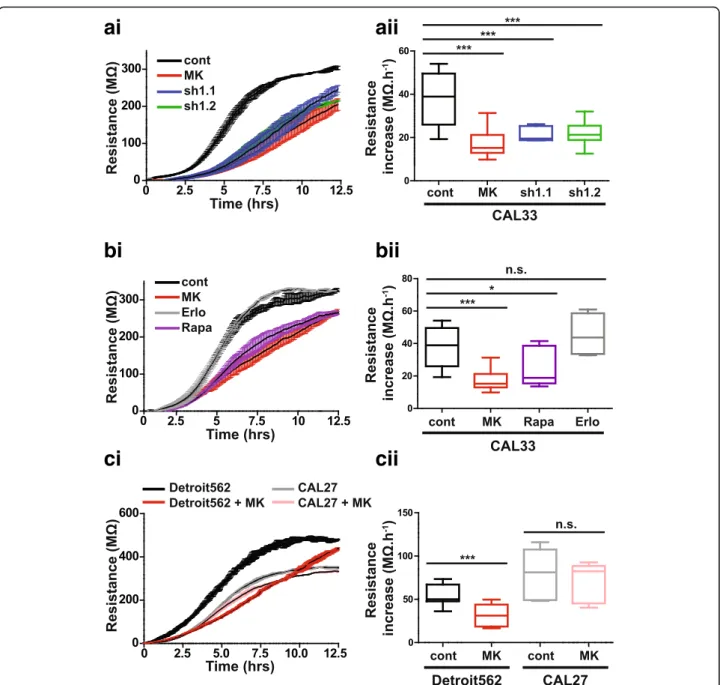
Electrical property-based cell phenotype screening
To further characterize the phenotype induced by AKT1
inhibition, we measured the electrical properties of cells
(impedance, resistance and capacitance) that were
seeded at high density on an electrode [
32
]. Time-course
experiments of CAL33 monolayers revealed that
treat-ment with MK-2206 at the time of spreading or
knock-down of AKT1 significantly decreased the rate of
resistance increase during the cell-adhesion phase (~
4-8 h following cell plating, Fig.
3a
). These changes are not
likely to be due to cell death or proliferative defects as
MK-2206 only slightly reduced cell viability at 48 h and
proliferation rates were not affected by any of the
treat-ments at this time point (Additional file
12
: Figure S3A
and B). We then performed a phenotypic-based
screen-ing for compounds that may induce the same phenotype
as the AKT inhibitor. mTOR is one of the downstream
effectors of AKT [
33
] and the EGF receptor is an
up-stream activator of the PI3K/AKT pathway mutated in
approximately 90% of HNSCC cases [
34
,
35
]. We
there-fore used the classical mTOR targeting drug rapamycin
and the EGFR inhibitor erlotinib in this screening.
Rapa-mycin phenocopied the effect of AKT inhibition while
erlotinib did not alter the electrical properties of the
cells (Fig.
3b
). Although erlotinib is a potent cytotoxic
drug for HNSCC cell lines [
35
,
36
], the absence of an
observed phenotype indicates that this electrical
screen-ing technique can delineate specific differences between
compounds with respect to morphological or cytotoxic
alterations. We next used the same assay to screen
additional HNSCC cell lines based on their response to
AKT inhibition (Fig.
3c
). Treatment of CAL27 cells with
MK-2206 did not induce significant changes in their
electrical properties whereas Detroit562 cells displayed a
a
b
d
e
c
Fig. 1 AKT1 inhibition induces CAL33 cell spreading. a Alexa555-phalloidin (red) staining of the actin cytoskeleton in CAL33 cells expressing a control shRNA (shCont), two independent shRNA sequences targeting AKT1 (shAKT1.1 and shAKT1.2) or control cells treated with the pan-AKT inhibitor MK-2206 (shCont+MK). Nuclear DNA was counterstained with Hoechst 33,342 (blue). b Average cell surface areas were measured by dividing the surface of cell colonies by the number of nuclei in the colonies. c AKT activity and expression levels were evaluated by immunoblot with an anti-phospho-AKT antibody (pS473-AKT) and an anti-pan-AKT antibody. GAPDH was used as a loading control. d Immunostaining of e-cadherin (green) and Alexa555-phalloidin (red) staining of the actin cytoskeleton (F-actin) in CAL33 cells expressing a control shRNA (shCont), an shRNA sequences targeting AKT1 (sh1.1) or control cells treated with the pan-AKT inhibitor MK-2206 (shCont+MK). Nuclear DNA was counterstained with Hoechst 33,342 (blue). White arrows indicate examples of cell-cell junction e-cadherin staining. e Measurements of the mean length of cell-cell junctional e-cadherin per cell. Box-and-whisker plots presented in the figure extend from the 25th to 75th percentiles with whiskers displaying the whole range of the dataset and horizontal bars representing the median. The number of measurements from at least three independent experiments is displayed above each plot; one-way ANOVA with Bonferroni’s post-test: *** p < 0.001 as compared to shCont
phenotypic change comparable to that of the CAL33
cells upon inhibition of AKT (Fig.
3c
, Additional file
11
:
Figure S2 and Additional file
13
: Figure S4). Taken
to-gether, our results demonstrate that the electrical
pheno-type screening of compounds and cell lines allows the
discovery of potential treatment-induced EMT-like
pro-cesses in HNSCC cell lines.
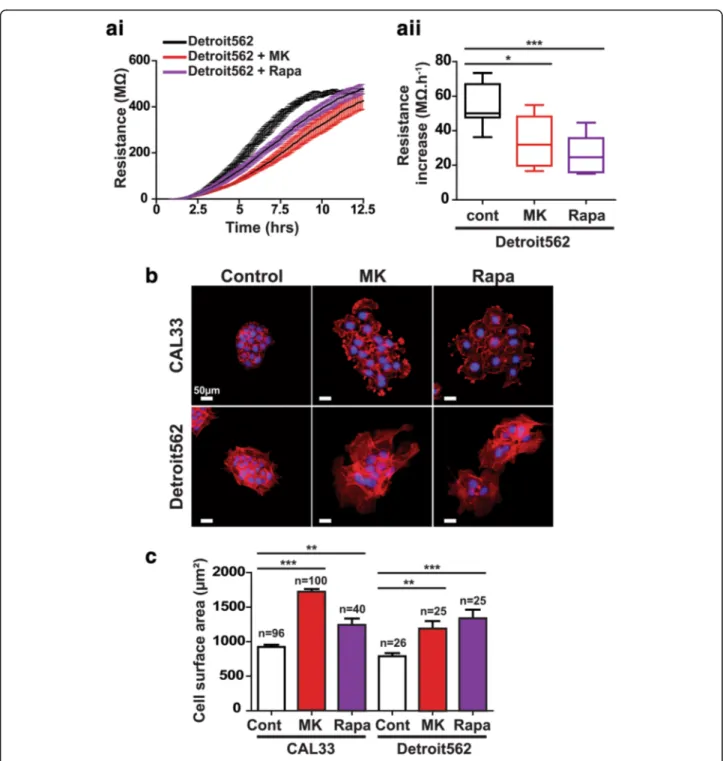
Validation of results obtained via electrical phenotypic
screening
In order to confirm the results described above, we
assessed the ability of rapamycin to induce a phenotypic
change in Detroit562 cells. Electrical resistance increase
was strongly impaired with both the AKT inhibitor
MK-2206 and the mTOR inhibitor rapamycin (Fig.
4a
). This
result is consistent both with the ability of MK-2206 to
in-duce a phenotypic change in Detroit562 cells and the
abil-ity of rapamycin to induce comparable changes in CAL33
cells (Fig.
2b
and
c
). Finally, in order to confirm the
correl-ation between the electrical property modificcorrel-ations and
morphological
alterations,
cells
were
stained
with
Alexa555-coupled phalloidin to observe the actin
cytoskel-eton of both CAL33 and Detroit562 cells treated with
either MK-2206 or rapamycin (Fig.
4b
). Quantitative
valid-ation of our phenotypic screening approach showed that
cell spreading of both cell lines was significantly increased
upon treatment with the two compounds (Fig.
4c
).
Discussion
Although the AKT family comprises three isoforms, most
studies only consider global AKT1–3 activity. However,
recent investigations have now elegantly revealed the
specific effects mediated by AKT1 and AKT2
iso-forms in both the ErbB2-driven and the polyoma
middle T (PyMT)-driven mammary adenocarcinoma
transgenic mouse models [
26
,
27
,
37
]. In these models,
constitutive activation of AKT1 in the mammary
epithe-lium accelerated the onset of tumorigenesis but drastically
decreased the number of metastatic lesions [
27
].
Con-versely, removal of the
akt1 gene strongly delayed the
on-set of tumorigenesis [
37
]. Furthermore, expression of a
constitutive active form of AKT2 had no effect on tumor
onset but strongly increased the occurrence of lung
me-tastases [
26
]. Combined, these results suggest that AKT1
and AKT2 may play opposite roles in the metastatic
process and that differential AKT isoform activities
re-quire further consideration in cancer studies. The
rele-vance of these findings in mouse models have been
recently reported for human breast tumors [
29
,
30
]. Gene
expression datasets obtained from breast cancer cell lines
and clinical samples revealed a strong association between
high
akt1 expression, low expression of mesenchymal
markers and better patient survival. Collectively, these
re-sults strongly suggest that AKT1 activity promotes early
stages of tumorigenesis but restricts the tumor cell
meta-static potential. However, these results have never been
extended to non-breast cancer models. Our study suggests
that AKT1 specific activity is also involved in the
mainten-ance of the epithelial phenotype of HNSCC cells. An
im-portant implication is that AKT1 may also be predictive of
the invasive capacities and aggressiveness of HNSCCs.
Enhanced AKT/mTOR activity is common in oral
carcin-omas [
38
] and alterations of the PI3K/Akt/mTOR
path-way are found in a large majority of HNSCCs [
39
]. As the
consensus from the literature is that these pathways
pro-mote cell survival and metastasis, a great effort has been
placed on pharmacological targeting of the PI3K pathway
in HNSCC [
34
,
40
]. The majority of previous in vitro
stud-ies on HNSCCs have focused on classical readouts such as
association of AKT activity with cell survival and lower
sensitivity to radiotherapy and chemotherapy [
41
–
44
].
Other research has indicated that increased AKT activity
may promote a mesenchymal phenotype [
45
]. However,
none of the previous in vitro (or in vivo) studies on
Fig. 2 AKT1 inhibition increases CAL33 cell migration in a 3D assay. a Spheroids generated with CAL33 cells expressing a control shRNA (shCont), a shRNA sequence targeting AKT1 (shAKT1) or control cells treated with the pan-AKT inhibitor MK-2206 (shCont+MK) were embedded in an extracellular matrix. Pictures of the spheroids were acquired at day 0 and day 8 for analysis. b Spheroid surface area was measured after 8 days. Error bars represent the data mean +/− SEM from at least three independent experiments; one-way ANOVA with Bonferroni’s post-test: *** p < 0.001 as compared to shCont
HNSCCs have considered the influence that specific AKT
isoform expression could have on the outcome of AKT
in-hibition. Here we have observed that in certain subtypes
of HNSCCs, which predominantly express AKT1 in
com-parison to AKT2, AKT1 inhibition leads to a more
inva-sive phenotype. Therefore, it appears that, as has been
recently revealed in an extensive body of work for breast
cancer [
26
,
27
,
29
,
30
], additional cancer types such as
HNSCC may require AKT isoform analysis to predict the
outcome of pan-AKT inhibitors. Despite encouraging
re-sults obtained with mTOR inhibitors [
46
–
48
], most of the
clinical trials involving agents targeting the PI3K/Akt/
mTOR pathway have failed to pass phase II. Consistently,
a phase II clinical trial with the pan-AKT inhibitor
ai
aii
bi
bii
ci
cii
Fig. 3 AKT1 inhibition modifies cellular electrical properties. ai, aii Electrode resistance measured at 4000 Hz for CAL33 cells expressing a control shRNA (cont), two independent shRNA sequences targeting AKT1 (sh1.1 and sh1.2) or control cells treated with a pan-AKT inhibitor (MK) was ob-served for up to 12.5 h (ai). The cell spreading/attachment phase was determined via calculation of the increased electrical resistance during the period of 4-8 h following cell plating (aii). bi, bii Electrode resistance measured at 4000 Hz for CAL33 cells treated with the pan-AKT inhibitor MK-2206 (MK), the mTORC1 inhibitor Rapamycin (Rapa) or the EGF receptor inhibitor Erlotinib (Erlo) was observed for up to 12.5 h (bi). Changes in electrical resistance between 4 and 8 h after cell spreading were then quantified (bii). ci, cii Electrode resistance measured at 4000 Hz for De-troit562 or CAL27 cells +/− MK-2206 (MK) was observed for up to 12.5 h (ci). As above, changes in electrical resistance between 4 and 8 h after cell spreading were then quantified (cii). Each dataset was generated from at least three independent experiments. One-way ANOVA with Bonfer-roni’s post-test: *** p < 0.001, *p < 0.05, n.s.: non-significant as compared to control
MK2206 on recurrent and metastatic HNSCC resulted in
a partial response and was not moved to phase III so far
(ClinicalTrials.gov identifier NCT01349933). A significant
consideration is that treatments targeting the PI3K or all
AKT isoforms may promote the invasive capacities of
can-cer cells in some cases. These counterintuitive results may
explain why PI3K and AKT inhibitors are not included yet
in clinical practices [
49
]. The possibility that some
Fig. 4 Further experiments validating the use of electrical properties screening for uncovering of phenotypic differences. ai, aii Electrode resistance measured at 4000 Hz for Detroit562 cells treated with the pan-AKT inhibitor MK-2206 (MK) or the mTORC1 inhibitor Rapamycin (Rapa) was measured for up to 12.5 h (ai). Combined values for the resistance increase from 4 to 8 h after cell spreading (aii). b Staining of the actin cytoskeleton with Alexa555-phalloidin (red) for CAL33 and Detroit562 cells treated with either MK-2206 (MK) or Rapamycin (Rapa). Nuclear DNA was counterstained with Hoechst 33,342 (blue). c Average cell surface areas were measured by dividing the surface of cell colonies by the num-ber of nuclei in the colonies. The numnum-ber of measurements from at least three independent experiments is displayed above the histograms. Data represent mean +/− SEM, one-way ANOVA with Bonferroni’s post-test: *** p < 0.001, ** p < 0.01, *p < 0.05 as compared to control
targeted therapies may increase the invasive and thus
metastatic potential despite a reduction of the tumor
bur-den should therefore be scrutinized.
We described a screening technique to determine
po-tential pro-metastatic effects of a drug by electrical
properties measurements. This method is mostly used
for established models such as maintenance of
endothe-lial cell-cell junctions or wound healing on confluent cell
monolayers [
50
,
51
]. Components of the electrical
changes observed during the early phase of cell
attach-ment can be more difficult to confidently interpret.
Linking such electrical measurements to a given
bio-logical effect therefore requires complementary
experi-ments. We observed that the increase of electrical
resistance during the attachment phase is lower when
AKT1 is inhibited in some but not all HNSCC cell lines.
Conventional morphology and invasion assays indicated
that these differences in electrical properties correlated
with cell spreading, decreased cell-cell contact and
ac-quisition of an invasive phenotype. We thus envision this
technique becoming a valuable tool for high-throughput
screening of drug-induced metastatic potential.
Alterations in the PI3K/AKT/mTOR pathway occur in
38% of all cancers as demonstrated on nearly 20,000
tumors of diverse origins [
52
]. More specifically in
HNSCCs, pooled results from several databases showed
that the PIK3CA gene, encoding the p110alpha catalytic
subunit of the PI3K, is amplified in approximately 70%
of HNSCC cell lines and 20% of HNSCCs clinical cases
analyzed [
53
]. These results pinpoint the importance of
the PI3K/AKT pathway dysregulation in cancers. The
CAL33 and Detroit562 cell lines that adopted a
mesen-chymal phenotype upon AKT or mTORC1 inhibition
bear a H1047R activating mutation in PIK3CA.
Con-versely, the CAL27 cell line does not bear this mutation
and does not display comparable modifications in the
same experimental conditions. Maintenance of the
epi-thelial phenotype of CAL33 and Detroit562 cells could
rely on the constitutive activity of the PI3K/AKT1 axis
that is absent in CAL27 cells. In this case, the presence
of both AKT1 amplification and constitutive PI3K
activ-ity would be a prognostic marker for pro-metastatic
ef-fects of pan-AKT inhibitors.
Conclusions
In summary, we extended the role of AKT1 specific
ac-tivity in the maintenance of an epithelial phenotype to a
new cancer type. This suggests that the differential role
of AKT isoforms may be widespread in cancer.
Further-more, we have established an electrical screening
proto-col that correlates with metastatic cellular phenotypes.
We believe that our method will be valuable for future
ef-forts involving high-throughput screening of new
pharma-cological compounds and for the detection of potential
deleterious effects of drugs that are currently approved for
clinical use. Finally, future efforts are required to delineate
specific functions of AKT isoforms to avoid unwanted
outcomes from the use of pan-AKT inhibitors or to
de-velop specific AKT2/3 inhibitors.
Additional files
Additional file 1:CAL33-shControl cells treated with Erlotinib, Rapamycin and MK-2206 electrical resistance measurements. Raw output file of the ECIS measurement of resistance in MΩ at a frequency of 4000 Hz. (XLS 432 kb)
Additional file 2:CAL33-shControl cells untreated or treated with Rapamycin and MK-2206 electrical resistance measurements. Raw output file of the ECIS measurement of resistance in MΩ at a frequency of 4000 Hz. (XLS 213 kb)
Additional file 3:CAL33-shControl cells untreated or treated with MK-2206 and CAL33-shAKT1.1 and 1.2 cells electrical resistance measurements. Raw output file of the ECIS measurement of resistance in MΩ at a frequency of 4000 Hz. (XLS 147 kb)
Additional file 4:CAL33-shControl cells untreated or treated with MK-2206 and CAL33-shAKT1.1 and 1.2 cells electrical resistance measurements. Raw output file of the ECIS measurement of resistance in MΩ at a frequency of 4000 Hz. (XLS 220 kb)
Additional file 5:CAL33-shControl cells untreated or treated with MK-2206 and CAL33-shAKT1.1 and 1.2 cells electrical resistance measurements. Raw output file of the ECIS measurement of resistance in MΩ at a frequency of 4000 Hz. (XLS 86 kb)
Additional file 6:Detroit562 and CAL27 cells untreated or treated with MK-2206 electrical resistance measurements. Raw output file of the ECIS measurement of resistance in MΩ at a frequency of 4000 Hz. (XLS 1380 kb) Additional file 7:Detroit562 cells untreated or treated with MK-2206 or Rapamycin electrical resistance measurements. Raw output file of the ECIS measurement of resistance in MΩ at a frequency of 4000 Hz. (XLS 227 kb) Additional file 8:Detroit562 cells untreated or treated with MK-2206 or Rapamycin electrical resistance measurements. Raw output file of the ECIS measurement of resistance in MΩ at a frequency of 4000 Hz. (XLS 213 kb) Additional file 9:Electrical data used to generate the figures. The ECIS measurements of resistance in MΩ at a frequency of 4000 Hz were normalized to the first measurement and plotted in the Graphpad Prism software to generate the traces shown in Figs.3a-cand4a. The quantification data were obtained by measuring the mean resistance increase during the cell attachment phase (from 4 to 8 h after cell spreading). (XLSX 140 kb) Additional file 10:Figure S1. AKT1 and AKT2 isoform expression in CAL33, Detroit562 and CAL27 cells. AKT1 and AKT2 expression levels were evaluated by immunoblot with specific anti-AKT antibody in CAL33 cells expressing a control shRNA (shCont), two independent shRNA sequences targeting AKT1 (sh1.1 and sh1.2) and in Detroit562 and CAL27 cells. GAPDH was used as a loading control. (PDF 26 kb)
Additional file 11:Figure S2 Analysis of e-cadherin expression and localization by immunofluorescence in CAL33 cells. Immunostaining of e-cadherin (green) and Alexa555-phalloidin (red) staining of the actin cytoskeleton (F-actin) in CAL33 cells expressing a control shRNA (shCont), an shRNA sequences targeting AKT1 (sh1.2) or control cells treated with the pan-AKT inhibitor MK-2206 (MK), Rapamycin (Rapa) or Erlotinib (Erlo). Nuclear DNA was counterstained with Hoechst 33,342 (blue). (PDF 1545 kb) Additional file 12:Figure S3 Cell viability and proliferation assays. (A) The viability of CAL33 cells expressing a control shRNA (CAL33), two independent shRNA sequences targeting AKT1 (shAKT1.1 and shAKT1.2) or treated with the pan-AKT inhibitor MK-2206 (MK) or the mTORC1 inhibitor Rapamycin (Rapa) was measured after 48 h. Statistical analysis was performed using one-way ANOVA with Bonferroni’s post-test: *** p < 0.001, n.s.: non-significant. (B) CAL33 cell proliferation assays of the same experimental manipulations as described in part (A). Cell proliferation is represented as a
fold-increase over the starting number of cells and was measured after 3 and 4 days of treatment. (PDF 44 kb)
Additional file 13:Figure S4 Analysis of e-cadherin expression and localization by immunofluorescence in CAL27 and Detroit562 cells. Immunostaining of e-cadherin (green) and Alexa555-phalloidin (red) staining of the actin cytoskeleton (F-actin) in CAL27 and Detroit562 cells treated with the pan-AKT inhibitor MK-2206 (MK), Rapamycin (Rapa) or Erlotinib (Erlo). Nuclear DNA was counterstained with Hoechst 33,342 (blue). (PDF 247 kb)
Abbreviations
DMEM:Dulbecco’s modified Eagle’s medium; ECIS: Electrical impedance cell sensing; EGFR: Epithelial growth factor receptor; EMT: Epithelium-to-mesenchyme transition; FCS: Fetal calf serum; GAPDH: Glyceraldehyde 3-phosphate dehydrogenase; HNSCC: Head and neck squamous cell carcinoma; mTOR: mammalian target of rapamycin; PFA: paraformaldehyde; PI3K: Phosphoinositide 3-kinase; PyMT: Polyoma middle T; shRNA: short hairpin ribonucleic acid
Acknowledgements
The authors are grateful to the Oncopharmacology Lab, Antoine Lacassagne Anticancer Center, Nice, France who isolated and kindly provided the cell lines used in this study. The authors are grateful to the middle school trainees who helped to analyze some of the imaging data.
Funding
This work was funded by the Centre Scientifique de Monaco and the Government of the Principality of Monaco. The funding bodies did not participate in any aspect of the design of the study and collection, analysis, and interpretation of data and in writing the manuscript.
Availability of data and materials
All data generated or analyzed during this study are included in this published article and its Additional files.
Authors’ contributions
SB, SKP, LM and VP performed and analyzed the cell staining and cellular electrical properties experiments; VV performed the immunoblot experiments; JD generated the shRNA cell lines; VP and SKP made the figures and wrote the manuscript; JP and GP edited the manuscript and were the recipients of the funding. All authors read and approved the final manuscript.
Ethics approval and consent to participate
No ethics approval and informed consent were required to use the cell lines used in this study.
Consent for publication Not applicable.
Competing interests
The authors declare that they have no competing interests.
Publisher
’s Note
Springer Nature remains neutral with regard to jurisdictional claims in published maps and institutional affiliations.
Author details
1
Centre Scientifique de Monaco, Department of Medical Biology, 8 Quai Antoine Ier, Monaco, Principality of Monaco.2UCA, Université Côte d’Azur,
Nice-Sophia-Antipolis, Institute for Research on Cancer and Aging of Nice, CNRS-UMR 7284-Inserm U1081, Nice, France.
Received: 4 August 2017 Accepted: 26 February 2018
References
1. Montero JA, Kilian B, Chan J, Bayliss PE, Heisenberg CP. Phosphoinositide 3-kinase is required for process outgrowth and cell polarization of gastrulating mesendodermal cells. Current biology : CB. 2003;13(15):1279–89.
2. Yang X, Chrisman H, Weijer CJ. PDGF signalling controls the migration of mesoderm cells during chick gastrulation by regulating N-cadherin expression. Development. 2008;135(21):3521–30.
3. Yeh CM, Liu YC, Chang CJ, Lai SL, Hsiao CD, Lee SJ. Ptenb mediates gastrulation cell movements via Cdc42/AKT1 in zebrafish. PLoS One. 2011;6(4):e18702. 4. Grille SJ, Bellacosa A, Upson J, Klein-Szanto AJ, van Roy F, Lee-Kwon W,
Donowitz M, Tsichlis PN, Larue L. The protein kinase Akt induces epithelial mesenchymal transition and promotes enhanced motility and invasiveness of squamous cell carcinoma lines. Cancer Res. 2003;63(9):2172–8.
5. Govindarajan B, Sligh JE, Vincent BJ, Li M, Canter JA, Nickoloff BJ, Rodenburg RJ, Smeitink JA, Oberley L, Zhang Y, et al. Overexpression of Akt converts radial growth melanoma to vertical growth melanoma. J Clin Invest. 2007; 117(3):719–29.
6. Tang H, Massi D, Hemmings BA, Mandala M, Hu Z, Wicki A, Xue G. AKT-ions with a TWIST between EMT and MET. Oncotarget. 2016;7(38):62767–77. 7. Liu P, Cheng H, Roberts TM, Zhao JJ. Targeting the phosphoinositide
3-kinase pathway in cancer. Nat Rev Drug Discov. 2009;8(8):627–44. 8. Ramanathan RK, McDonough SL, Kennecke HF, Iqbal S, Baranda JC, Seery
TE, Lim HJ, Hezel AF, Vaccaro GM, Blanke CD. Phase 2 study of MK-2206, an allosteric inhibitor of AKT, as second-line therapy for advanced gastric and gastroesophageal junction cancer: a SWOG cooperative group trial (S1005). Cancer. 2015;121(13):2193–7.
9. Ma BB, Goh BC, Lim WT, Hui EP, Tan EH, Lopes Gde L, Lo KW, Li L, Loong H, Foster NR, et al. Multicenter phase II study of the AKT inhibitor MK-2206 in recurrent or metastatic nasopharyngeal carcinoma from patients in the mayo phase II consortium and the cancer therapeutics research group (MC1079). Investig New Drugs. 2015;33(4):985–91.
10. Ahn DH, Li J, Wei L, Doyle A, Marshall JL, Schaaf LJ, Phelps MA, Villalona-Calero MA, Bekaii-Saab T. Results of an abbreviated phase-II study with the Akt inhibitor MK-2206 in patients with advanced biliary cancer. Sci Rep. 2015;5:12122.
11. Oki Y, Fanale M, Romaguera J, Fayad L, Fowler N, Copeland A, Samaniego F, Kwak LW, Neelapu S, Wang M, et al. Phase II study of an AKT inhibitor MK2206 in patients with relapsed or refractory lymphoma. Br J Haematol. 2015;171(4):463–70.
12. Yap TA, Yan L, Patnaik A, Fearen I, Olmos D, Papadopoulos K, Baird RD, Delgado L, Taylor A, Lupinacci L, et al. First-in-man clinical trial of the oral pan-AKT inhibitor MK-2206 in patients with advanced solid tumors. J Clin Oncol. 2011;29(35):4688–95.
13. Hudis C, Swanton C, Janjigian YY, Lee R, Sutherland S, Lehman R, Chandarlapaty S, Hamilton N, Gajria D, Knowles J, et al. A phase 1 study evaluating the combination of an allosteric AKT inhibitor (MK-2206) and trastuzumab in patients with HER2-positive solid tumors. Breast cancer research : BCR. 2013;15(6):R110.
14. Brana I, Berger R, Golan T, Haluska P, Edenfield J, Fiorica J, Stephenson J, Martin LP, Westin S, Hanjani P, et al. A parallel-arm phase I trial of the humanised anti-IGF-1R antibody dalotuzumab in combination with the AKT inhibitor MK-2206, the mTOR inhibitor ridaforolimus, or the NOTCH inhibitor MK-0752, in patients with advanced solid tumours. Br J Cancer. 2014; 111(10):1932–44.
15. Fouladi M, Perentesis JP, Phillips CL, Leary S, Reid JM, McGovern RM, Ingle AM, Ahern CH, Ames MM, Houghton P, et al. A phase I trial of MK-2206 in children with refractory malignancies: a Children's oncology group study. Pediatr Blood Cancer. 2014;61(7):1246–51.
16. Janku F, Hong DS, Fu S, Piha-Paul SA, Naing A, Falchook GS, Tsimberidou AM, Stepanek VM, Moulder SL, Lee JJ, et al. Assessing PIK3CA and PTEN in early-phase trials with PI3K/AKT/mTOR inhibitors. Cell Rep. 2014;6(2):377–87. 17. Konopleva MY, Walter RB, Faderl SH, Jabbour EJ, Zeng Z, Borthakur G,
Huang X, Kadia TM, Ruvolo PP, Feliu JB, et al. Preclinical and early clinical evaluation of the oral AKT inhibitor, MK-2206, for the treatment of acute myelogenous leukemia. Clin Cancer Res. 2014;20(8):2226–35.
18. Molife LR, Yan L, Vitfell-Rasmussen J, Zernhelt AM, Sullivan DM, Cassier PA, Chen E, Biondo A, Tetteh E, Siu LL, et al. Phase 1 trial of the oral AKT inhibitor MK-2206 plus carboplatin/paclitaxel, docetaxel, or erlotinib in patients with advanced solid tumors. J Hematol Oncol. 2014;7:1. 19. Davies BR, Guan N, Logie A, Crafter C, Hanson L, Jacobs V, James N, Dudley
P, Jacques K, Ladd B, et al. Tumors with AKT1E17K mutations are rational targets for single agent or combination therapy with AKT inhibitors. Mol Cancer Ther. 2015;14(11):2441–51.
20. Do K, Speranza G, Bishop R, Khin S, Rubinstein L, Kinders RJ, Datiles M, Eugeni M, Lam MH, Doyle LA, et al. Biomarker-driven phase 2 study of
2206 and selumetinib (AZD6244, ARRY-142886) in patients with colorectal cancer. Investig New Drugs. 2015;33(3):720–8.
21. Doi T, Tamura K, Tanabe Y, Yonemori K, Yoshino T, Fuse N, Kodaira M, Bando H, Noguchi K, Shimamoto T, et al. Phase 1 pharmacokinetic study of the oral pan-AKT inhibitor MK-2206 in Japanese patients with advanced solid tumors. Cancer Chemother Pharmacol. 2015;76(2):409–16. 22. Gonzalez-Angulo AM, Krop I, Akcakanat A, Chen H, Liu S, Li Y, Culotta KS,
Tarco E, Piha-Paul S, Moulder-Thompson S, et al. SU2C phase Ib study of paclitaxel and MK-2206 in advanced solid tumors and metastatic breast cancer. J Natl Cancer Inst. 2015;107(3)
23. Gupta S, Argiles G, Munster PN, Hollebecque A, Dajani O, Cheng JD, Wang R, Swift A, Tosolini A, Piha-Paul SA. A phase i trial of combined ridaforolimus and mk-2206 in patients with advanced malignancies. Clin Cancer Res. 2015;21(23):5235–44.
24. Chung V, McDonough S, Philip PA, Cardin D, Wang-Gillam A, Hui L, Tejani MA, Seery TE, Dy IA, Al Baghdadi T, et al. Effect of Selumetinib and MK-2206 vs Oxaliplatin and fluorouracil in patients with metastatic pancreatic cancer after prior therapy: SWOG S1115 study randomized clinical trial. JAMA oncology. 2017;3(4):516–22.
25. Arboleda MJ, Lyons JF, Kabbinavar FF, Bray MR, Snow BE, Ayala R, Danino M, Karlan BY, Slamon DJ. Overexpression of AKT2/protein kinase Bbeta leads to up-regulation of beta1 integrins, increased invasion, and metastasis of human breast and ovarian cancer cells. Cancer Res. 2003;63(1):196–206. 26. Dillon RL, Marcotte R, Hennessy BT, Woodgett JR, Mills GB, Muller WJ. Akt1
and akt2 play distinct roles in the initiation and metastatic phases of mammary tumor progression. Cancer Res. 2009;69(12):5057–64.
27. Hutchinson JN, Jin J, Cardiff RD, Woodgett JR, Muller WJ. Activation of Akt-1 (PKB-alpha) can accelerate ErbB-2-mediated mammary tumorigenesis but suppresses tumor invasion. Cancer Res. 2004;64(9):3171–8.
28. Irie HY, Pearline RV, Grueneberg D, Hsia M, Ravichandran P, Kothari N, Natesan S, Brugge JS. Distinct roles of Akt1 and Akt2 in regulating cell migration and epithelial-mesenchymal transition. J Cell Biol. 2005;171(6):1023–34. 29. Li CW, Xia W, Lim SO, Hsu JL, Huo L, Wu Y, Li LY, Lai CC, Chang SS, Hsu YH,
et al. AKT1 inhibits epithelial-to-mesenchymal transition in breast cancer through phosphorylation-dependent Twist1 degradation. Cancer Res. 2016; 76(6):1451–62.
30. Riggio M, Perrone MC, Polo ML, Rodriguez MJ, May M, Abba M, Lanari C, Novaro V. AKT1 and AKT2 isoforms play distinct roles during breast cancer progression through the regulation of specific downstream proteins. Sci Rep. 2017;7:44244.
31. Gioanni J, Fischel JL, Lambert JC, Demard F, Mazeau C, Zanghellini E, Ettore F, Formento P, Chauvel P, Lalanne CM, et al. Two new human tumor cell lines derived from squamous cell carcinomas of the tongue: establishment, characterization and response to cytotoxic treatment. Eur J Cancer Clin Oncol. 1988;24(9):1445–55.
32. Giaever I, Keese CR. A morphological biosensor for mammalian cells. Nature. 1993;366(6455):591–2.
33. Porta C, Paglino C, Mosca A. Targeting PI3K/Akt/mTOR signaling in cancer. Front Oncol. 2014;4:64.
34. Wong KK, Engelman JA, Cantley LC. Targeting the PI3K signaling pathway in cancer. Curr Opin Genet Dev. 2010;20(1):87–90.
35. Barzegar M, Ma S, Zhang C, Chen X, Gu Y, Shang C, Jiang X, Yang J, Nathan CA, Yang S, et al. SKLB188 inhibits the growth of head and neck squamous cell carcinoma by suppressing EGFR signalling. Br J Cancer. 2017;117(8):1154–63. 36. Benhamou Y, Picco V, Raybaud H, Sudaka A, Chamorey E, Brolih S,
Monteverde M, Merlano M, Lo Nigro C, Ambrosetti D, et al. Telomeric repeat-binding factor 2: a marker for survival and anti-EGFR efficacy in oral carcinoma. Oncotarget. 2016;7(28):44236–51.
37. Maroulakou IG, Oemler W, Naber SP, Tsichlis PN. Akt1 ablation inhibits, whereas Akt2 ablation accelerates, the development of mammary adenocarcinomas in mouse mammary tumor virus (MMTV)-ErbB2/neu and MMTV-polyoma middle T transgenic mice. Cancer Res. 2007;67(1):167–77. 38. Martins F, de Sousa SC, Dos Santos E, Woo SB, Gallottini M. PI3K-AKT-mTOR
pathway proteins are differently expressed in oral carcinogenesis. J Oral Pathol Med. 2016;45(10):746–52.
39. Grandis JR HD, El-Naggar AK, and The Cancer Genome Atlas Group Comprehensive genomic characterization of squamous cell carcinoma of the head and neck. TCGA 2nd annual scientific symposium 2012. 40. Simpson DR, Mell LK, Cohen EE. Targeting the PI3K/AKT/mTOR pathway in
squamous cell carcinoma of the head and neck. Oral Oncol. 2015;51(4):291–8.
41. Hehlgans S, Eke I, Cordes N. Targeting FAK radiosensitizes 3-dimensional grown human HNSCC cells through reduced Akt1 and MEK1/2 signaling. Int J Radiat Oncol Biol Phys. 2012;83(5):e669–76.
42. Stegeman H, Span PN, Peeters WJ, Verheijen MM, Grenman R, Meijer TW, Kaanders JH, Bussink J. Interaction between hypoxia, AKT and HIF-1 signaling in HNSCC and NSCLC: implications for future treatment strategies. Future science OA. 2016;2(1):FSO84.
43. Silva-Oliveira RJ, Melendez M, Martinho O, Zanon MF, de Souza Viana L, Carvalho AL, Reis RM. AKT can modulate the in vitro response of HNSCC cells to irreversible EGFR inhibitors. Oncotarget. 2017;8(32):53288–301. 44. Cheng Y, Wang Y, Li J, Chang I, Wang CY. A novel read-through transcript
JMJD7-PLA2G4B regulates head and neck squamous cell carcinoma cell proliferation and survival. Oncotarget. 2017;8(2):1972–82.
45. Chang JW, Jung SN, Kim JH, Shim GA, Park HS, Liu L, Kim JM, Park J, Koo BS. Carboxyl-terminal modulator protein positively acts as an oncogenic driver in head and neck squamous cell carcinoma via regulating Akt
phosphorylation. Sci Rep. 2016;6:28503.
46. Fury MG, Sherman E, Haque S, Korte S, Lisa D, Shen R, Wu N, Pfister D. A phase I study of daily everolimus plus low-dose weekly cisplatin for patients with advanced solid tumors. Cancer Chemother Pharmacol. 2012;69(3):591–8. 47. Fury MG, Lee NY, Sherman E, Ho AL, Rao S, Heguy A, Shen R, Korte S, Lisa D,
Ganly I, et al. A phase 1 study of everolimus + weekly cisplatin + intensity modulated radiation therapy in head-and-neck cancer. Int J Radiat Oncol Biol Phys. 2013;87(3):479–86.
48. Fury MG, Sherman E, Ho AL, Xiao H, Tsai F, Nwankwo O, Sima C, Heguy A, Katabi N, Haque S, et al. A phase 1 study of everolimus plus docetaxel plus cisplatin as induction chemotherapy for patients with locally and/or regionally advanced head and neck cancer. Cancer. 2013;119(10):1823–31. 49. Nitulescu GM, Margina D, Juzenas P, Peng Q, Olaru OT, Saloustros E, Fenga
C, Spandidos D, Libra M, Tsatsakis AM. Akt inhibitors in cancer treatment: the long journey from drug discovery to clinical use (review). Int J Oncol. 2016;48(3):869–85.
50. Gong H, Liu M, Klomp J, Merrill BJ, Rehman J, Malik AB. Method for dual viral vector mediated CRISPR-Cas9 gene disruption in primary human endothelial cells. Sci Rep. 2017;7:42127.
51. Ochoa-Callejero L, Pozo-Rodrigalvarez A, Martinez-Murillo R, Martinez A. Lack of adrenomedullin in mouse endothelial cells results in defective angiogenesis, enhanced vascular permeability, less metastasis, and more brain damage. Sci Rep. 2016;6:33495.
52. Millis SZ, Ikeda S, Reddy S, Gatalica Z, Kurzrock R. Landscape of
Phosphatidylinositol-3-kinase pathway alterations across 19784 diverse solid tumors. JAMA oncology. 2016;2(12):1565–73.
53. Li H, Wawrose JS, Gooding WE, Garraway LA, Lui VW, Peyser ND, Grandis JR. Genomic analysis of head and neck squamous cell carcinoma cell lines and human tumors: a rational approach to preclinical model selection. Molecular cancer research : MCR. 2014;12(4):571–82.
• We accept pre-submission inquiries
• Our selector tool helps you to find the most relevant journal • We provide round the clock customer support
• Convenient online submission • Thorough peer review
• Inclusion in PubMed and all major indexing services • Maximum visibility for your research
Submit your manuscript at www.biomedcentral.com/submit