HAL Id: hal-01441544
https://hal.archives-ouvertes.fr/hal-01441544
Submitted on 10 Sep 2019
HAL is a multi-disciplinary open access
archive for the deposit and dissemination of sci-entific research documents, whether they are pub-lished or not. The documents may come from teaching and research institutions in France or abroad, or from public or private research centers.
L’archive ouverte pluridisciplinaire HAL, est destinée au dépôt et à la diffusion de documents scientifiques de niveau recherche, publiés ou non, émanant des établissements d’enseignement et de recherche français ou étrangers, des laboratoires publics ou privés.
Planar shock wave sliding over a water layer
G. Jourdan, A. Marty, A. Allou, V. Rodriguez,
× Jourdan, × Marty, × Allou,
J.-D. Parisse
To cite this version:
G. Jourdan, A. Marty, A. Allou, V. Rodriguez,× Jourdan, et al.. Planar shock wave sliding over a water layer. Experiments in Fluids, Springer Verlag (Germany), 2016, 57 (8), �10.1007/s00348-016-2217-6�. �hal-01441544�
DOI 10.1007/s00348-016-2217-6
LETTER
Planar shock wave sliding over a water layer
V. Rodriguez1 · G. Jourdan1 · A. Marty1 · A. Allou2 · J.‑D. Parisse1
Received: 24 March 2016 / Accepted: 17 July 2016 / Published online: 21 July 2016 © Springer-Verlag Berlin Heidelberg 2016
induced air blast above it generates disturbances, causing wrenching of the liquid in the form of a cloud of droplets or fine mist if the shock is sufficiently intense. Moreover, in such a case, there is the problem of a refracted shock owing to the difference in the acoustic impedance present at the interface. This type of problem is of great interest in many applications such as oceanography and industrial accidents involving explosions. It is essential to understand the shock hydrodynamics associated with both the shock acceleration and the breakup of the liquid layer. By conducting shock-tube experiments with a planar shock wave moving above a water reservoir, we can obtain a suitable device to explore the physics of gas jets interacting with a liquid. However, relatively few experimental works on the subject have been reported in the literature. Borisov et al. (1965, 1981), and more recently, (Henderson et al. 1990) considered several refraction problems induced in such a situation according to whether the velocity of the incident shock wave is faster or slower than the speed of sound in the water layer. Some studies focused on the mechanism responsible for the insta-bilities at the fluid surface after the passage of the shock wave. As reported by Epstein et al. (2001) and Milton et al. (1991), the Kelvin–Helmholtz mechanism may be respon-sible for the liquid-surface instability and entrainment, and the surface tension and viscosity are the relevant parame-ters for the transition from surface ripples to the wrench-ing of the liquid. More recently, Teodorczyk and Shepherd (2012) investigated the growth rates of surface waves and spray layers behind the shock wave for conditions similar to ours. The common aspect of these studies is the use of only visualization techniques (direct illumination or shad-owgraphy) as a diagnostic approach. With the exception of the recent work of Bitter and Shepherd (2013) who experi-mentally studied detonations and deflagration-to-detonation transitions in horizontal pipes partially filled with water,
Abstract In this work, we conduct experiments to study
the interaction between a horizontal free water layer and a planar shock wave that is sliding over it. Experiments are performed at atmospheric pressure in a shock tube with a square cross section (200 × 200 mm2) for depths of 10, 20,
and 30 mm; a 1500-mm-long water layer; and two inci-dent planar shock waves having Mach numbers of 1.11 and 1.43. We record the pressure histories and high-speed visualizations to study the flow patterns, surface waves, and spray layers behind the shock wave. We observe two different flow patterns with ripples formed at the air–water interface for the weaker shock wave and the dispersion of a droplet mist for the stronger shock wave. From the pressure signals, we extract the delay time between the arrival of the compression wave into water and the shock wave in air at the same location. We show that the delay time evolves with the distance traveled over the water layer, the depth of the water layer, and the Mach number of the shock wave.
1 Introduction
The interaction between a planar shock wave and the liq-uid surface over which it slides induces complex situations from the perspective of either shock-wave refraction or the hydrodynamic instabilities at the air–water interface. When a shock wave propagates along with a layer of liquid, the
* V. Rodriguez
1 CNRS, IUSTI UMR 7343, Aix-Marseille Université,
13013 Marseille, France
2 CEA, DEN, Cadarache, DTN/STCP/LTRS, 13108 Saint Paul
Exp Fluids (2016) 57:125
125 Page 2 of 5
there have been no reports of quantitative variables used to describe the pressure evolution. In the present work, we conduct shock-tube experiments, focusing particularly on the pressure histories recorded both in air and water at the same location for different induced flow patterns obtained for different shock-wave strengths (Mach 1.11 and 1.43) and water-layer depths (10, 20, and 30 mm).
2 Experimental setup
We conducted experiments at the IUSTI Laboratory in a horizontal shock tube (T200) (Houas et al. 2003) spe-cifically equipped with a device to complete the experi-mental chamber of a variable water reservoir of different depths. The T200 shock tube has a total length of 8.0 m and a square inner cross section with 200-mm-long sides. It includes a movable 1.5-m-long high-pressure chamber followed by a fixed 5.0-m-long low-pressure chamber ter-minated by a transparent movable 1.5-m-long experimental chamber. The driver and the driven sections of the shock tube are equipped with caps that are used for the flush-mounted high-frequency water-resistant calibrated PCB pressure transducers (S113A26). They are connected to a multichannel digital oscilloscope (Tektronix DPO4054) through PCN amplifiers (482A22 type). In addition to recording the shock-wave velocity and tracing the pres-sure evolution, it is possible to trigger the diagnostic flow imaging with this setup. We placed two pressure transduc-ers in the driven section at stations C7 and C9, and six
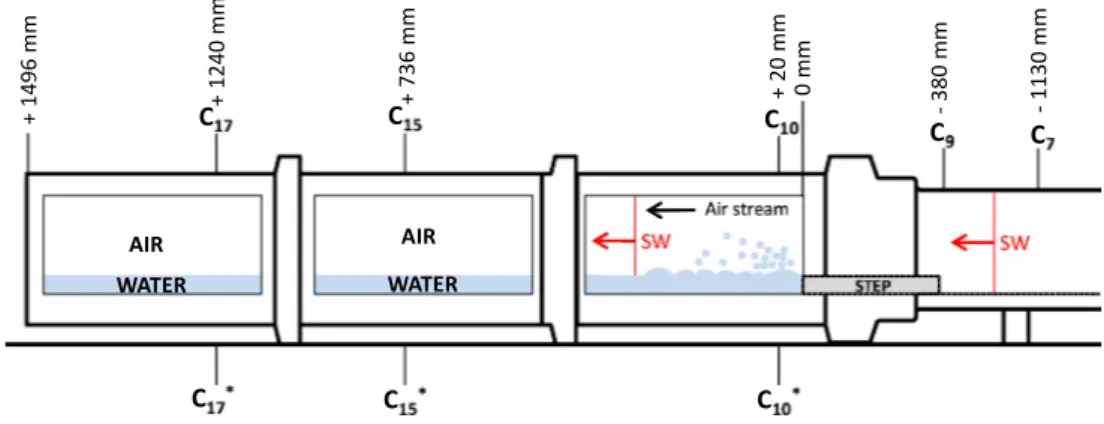
pres-sure transducers were positioned in the test section at sta-tions C10, C∗10, C15, C15∗, C17, and C17∗, as shown in Fig. 1.
We chose this gauge distribution to provide a detailed and accurate pressure map throughout both air and water. Prior to each run, the test section was partially filled with water at 293 K and atmospheric pressure. Image acquisition and
slow-motion analyses were obtained via a Photron Fastcam SA1 at 30,000 fps for a spatial resolution of 1024 × 176 pixels. The depth of the water layer was controlled by steps of different heights (10, 20, and 30 mm). Their length was 500 mm for the experiments conducted with a shock wave having a Mach number of 1.11. For experiments with a stronger shock wave having a higher Mach number (Mach 1.43), we used a shorter step length of 130 mm. We vali-dated these two designs beforehand using a computational fluid dynamics (CFD) code (STAR CCM+) to ensure that the incident shock wave properly re-forms after its interac-tion with the step.
3 Results and discussion
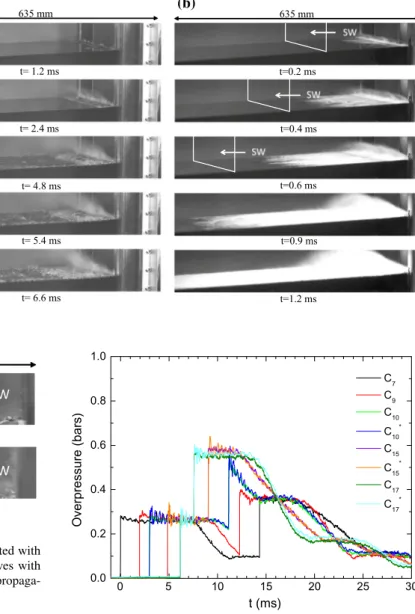
When the shock wave interacts with the water layer, per-turbations are observed in the air–water interface. The air stream generated behind the shock wave entrains the water surface, and droplets are dispersed into the air. Depending on the shock strength, a mist is formed just after the pas-sage of the shock wave. Examples of pictures recorded dur-ing the experiments are shown in Fig. 2. These sequences of isometric views show the interaction of planar shock waves with Mach numbers of 1.11 (a) and 1.43 (b) with a water layer with a depth of 30 mm. It is shown that two different flow patterns result from these experiments, as is clearly highlighted in the magnified images in Fig. 3. Under these conditions, a shock wave with a Mach number of 1.11 induces a pressure of 1.27 bar and an air-stream veloc-ity of 60 m s−1 behind the shock, whereas the shock wave
with a Mach number of 1.43 corresponds to a pressure of 2.22 bar and an air-stream velocity of 220 m s−1, which can
reasonably explain the main differences. In the case of a weak shock wave (Mach 1.11), only ripples are created at the air–water interface, and we verified that the wavelength
Fig. 1 Scheme of the T200 experimental section and principles of
the experiment. The C7 and C9 pressure sensors allow for the determi-nation of the Mach number of the incident shock wave. The C10, C15,
and C17 pressure sensors measure the pressure history in air. The C∗10,
C∗
15, and C17∗ pressure sensors in front of the previous sensors measure the pressure history in water. SW represents the incident shock wave
of these ripples is independent of the water-layer depth (for 10, 20, and 30 mm). Several previous studies have linked these ripples with the Kelvin–Helmholtz instability. In the case of a stronger shock wave (Mach 1.43), the sce-nario differs with the generation of a microscopic droplet mist just behind the incident shock wave, which thickens with time. Thereafter, a single wave formed at the begin-ning of the water layer grows with time and rapidly moves with a velocity of several meters per second. Moreover, a mist of droplets is detached from the crest of the wave. Additionally, spraying can be observed at the liquid inter-face for both Mach numbers and is much more marked for the stronger shock wave. This phenomenon, described in detail by Yarin and Weiss (1995), Yarin (2006), is probably a consequence of the strong drop impact issued from the entrained water layer behind the propagating shock wave, which collides with the water layer even at rest and forms a splash owing to the kinematic discontinuity responsible for crown formation. According to the shock strength, this
mechanism and the Kelvin–Helmholtz instability can be in competition.
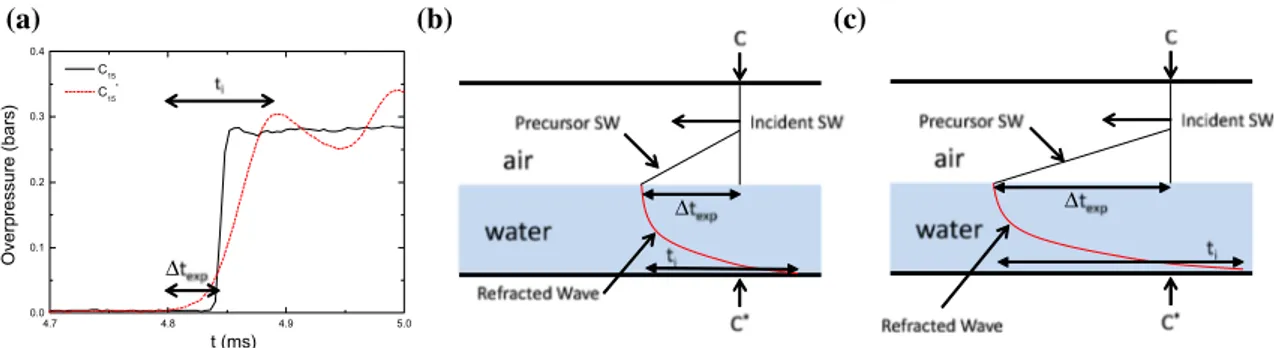
In comparison with previous works, the additional information presented here is mainly related to the pres-sure signals recorded at the same location in air and water. In Fig. 4, we present an example of the pressure histories recorded both in air and water throughout the experimen-tal apparatus. All pressure gauges record a first pressure increase across the incident shock wave, and later, a second one across the shock wave reflected from the end wall of the driven section. As we can see for this time scale, the signals recorded in air and water are merged. In Fig. 5a, we show a magnification of an individual pressure signal recorded both in air and water at the same location, from which the duration of the pressure increase in water ti and
Fig. 2 Sequences of isometric
views showing the interaction between a water layer with a depth of 30 mm and planar shock waves with Mach num-bers of 1.11 (a) and 1.43 (b). SW represents the position of the incident shock wave
635 mm t=0.2 ms t=0.6 ms t=1.2 ms 635 mm t= 4.8 ms t= 6.6 ms (a) (b) t= 1.2 ms t=0.4 ms t= 2.4 ms t=0.9 ms t= 5.4 ms (b) (a) 50 mm
Fig. 3 Magnified images extracted from experiments conducted with
a water layer having a depth of 10 mm driven by shock waves with Mach numbers of 1.11 (a) and 1.43 (b). SW represents the
propaga-tion direcpropaga-tion of the incident shock wave 0 5 10 15 20 25 30
0.0 0.2 0.4 0.6 0.8 1.0 Overpressure (bars) t (ms) C7 C9 C10 C10* C15 C15* C17 C17*
Fig. 4 Pressure signals recorded throughout the experimental
Exp Fluids (2016) 57:125
125 Page 4 of 5
the time shift between the incident shock wave in air and the compression wave in water texp were extracted. We
measured these characteristic times for two shock-wave strengths and three water layers at three locations. All of the results presented in Table 1 show that both ti and texp
increase with the distance traveled by the shock wave along the air–water interface and the depth of the liquid layer and decrease with the Mach number of the shock wave. The refraction of a shock wave sliding over a water layer was first proposed by Borisov et al. (1965) and confirmed by Teodorczyk and Shepherd (2012), as shown in Fig. 5b, c. When the incident shock wave strikes the water surface, a precursor shock is formed in air, and a refracted shock wave is transmitted into the liquid (Borisov et al. 1965). For the present case, the velocity of the shock wave in air is much slower than the speed of sound in water (1500 m s−1 ).
Therefore, the transmitted shock wave in water should be ahead of the shock wave in air. The pressure signals in air
and water in Fig. 5 corroborate the scenario of Borisov et al. We observed that the compression wave in water does not move at the speed of sound in water but at the speed of the shock wave in air. No acoustic wave is recorded in the pressure signals before the arrival of the shock wave in air. This is the propagation of the shock wave in air that drives the propagation of the compression wave into the water at any moment. To equilibrate the pressure at the air–water interface and to ensure the continuity of the pressure at every instant, a compression wave transversely propagates in water above the shock in air and increases the pressure in the water.
4 Conclusion and perspectives
We performed experiments with shock waves having two different strengths sliding over a water layer. The behavior of the air–water interface varies depending on the strength of the shock wave. For a weak shock wave (Mach 1.11), the patterns of the air–water interface exhibit “ripples” with some macroscopic water droplets expelled into the air. For a stronger shock wave (Mach 1.43), the patterns of the air–water interface have the appearance of a mist of micro-scopic droplets, and a single wave is created at the begin-ning of the reservoir. We measured the pressure both in air and water at the same abscissa and at three locations along the experimental chamber of the shock tube. The pressure signals reveal that the propagation of the compression wave in water is driven by the planar shock wave in air at any instant. The delay time between the two waves and the time over which the pressure increases in water depend on the experimental conditions. The scenario proposed by Borisov et al. was corroborated by pressure signals both in air and water.
Table 1 Duration of the pressure increase in water, ti, and the
experi-mental time gap between the shock in air and that in water, texp
Data are presented for two shock waves with different Mach numbers (Msw= 1.11 and 1.43) and three water depths (e = 10, 20, and 30 mm). The values are presented for the three pressure-sensor locations in the order C10−10∗/C15−15∗/C17−17∗ Msw= 1.11 (mm) ti(µs) �texp(µs) e = 10 86/96/127 28/31/38 e = 20 141/286/303 36/105/116 e = 30 321/338/336 84/131/164 Msw= 1.43 (mm) ti(µs) �texp(µs) e = 10 62/79/84 24/39/24 e = 20 111/196/156 21/90/97 e = 30 142/197/215 61/106/100 4.7 4.8 4.9 5.0 0.0 0.1 0.2 0.3 0.4 Overpressure (bars) t (ms) C15 C15 * ∆ ∆ ∆ (a) (b) (c)
Fig. 5 a Pressure signals for comparing the pressure increase behind
the planar incident shock wave in air (black line) and the compres-sion wave in water (red dashed line). texp represents the time gap between the two waves at the same location, and ti represents the duration of the pressure increase in water. b, c Diagrams showing the
scenario proposed by Borisov et al. and used by Teodorczyk at two times for the propagation of an incident shock wave above a water layer in the case where the incident shock wave is slower than the speed of sound in water
Acknowledgments This work is supported by CEA Cadarache under
Contract #4000649074 CJN-001
References
Bitter NP, Shepherd JE (2013) Detonation and transition to deto-nation in partially water-filled pipes. J Press Vessel Technol 135:031203-1
Borisov AA, Kogarko SM, Lyubimov AV (1965) Sliding of detona-tion and shock waves over liquid surfaces. Combust Explos Shock Waves 1:31–38
Borisov AA, Gel’fand BE, Sherpanev SM, Timofeev EI (1981) Mech-anism for mixture formation behind a shock sliding over a fluid surface. Combust Explos Shock Waves 17:86–93
Epstein M, Fauske HK, Kubo S, Nakamura T, Koyama K (2001) Liquid entrainment by an expanding core disruptive accident bubble—a Kelvin–Helmholtz phenomenon. Nucl Eng Des 210:53–77
Henderson LF, Ma J-H, Sakurai A, Takayama K (1990) Refraction of a shock wave at an air–water interface. Fluid Dyn Res 5:337–350 Houas L, Jourdan G, Schwaederlé L, Carrey R, Diaz F (2003) A new
large cross-section shock tube for studies of turbulent mixing induced by interfacial hydrodynamic instability. Shock Waves 13:431–434
Milton BE, Behnia M, Takayama K (1991) Interaction of liquid films with shock induced airflows. In: Proceedings of the 18th interna-tional symposium on shock waves held at Sendai Japan, vol 2, pp 1265–1270
Teodorczyk A, Shepherd JE (2012) Interaction of a shock wave with a water layer, technical report no. FM2012-002, Graduate Aero-nautical Laboratories, California Institute of Technology Yarin AL (2006) Drop impact dynamics: splashing, spreading,
reced-ing, bouncing. Annu Rev Fluid Mech 38:159–192
Yarin AL, Weiss DA (1995) Impact of drops on solid surfaces: self-similar capillary waves, and splashing as a new type of kinematic discontinuity. J Fluid Mech 283:141–173
![[PDF] Cours complet pour apprendre a programmer avec le language PHP | Cours php](data:image/gif;base64,R0lGODlhAQABAIAAAP///wAAACH5BAEAAAAALAAAAAABAAEAAAICRAEAOw==)