HAL Id: hal-01187023
https://hal.archives-ouvertes.fr/hal-01187023
Submitted on 25 Aug 2015
HAL is a multi-disciplinary open access
archive for the deposit and dissemination of
sci-entific research documents, whether they are
pub-lished or not. The documents may come from
teaching and research institutions in France or
abroad, or from public or private research centers.
L’archive ouverte pluridisciplinaire HAL, est
destinée au dépôt et à la diffusion de documents
scientifiques de niveau recherche, publiés ou non,
émanant des établissements d’enseignement et de
recherche français ou étrangers, des laboratoires
publics ou privés.
Weighted-covariance factor fuzzy C-means clustering
Abbas Rammal, Eric Perrin, Valériu Vrabie, Isabelle Bertrand, Brigitte
Chabbert
To cite this version:
Abbas Rammal, Eric Perrin, Valériu Vrabie, Isabelle Bertrand, Brigitte Chabbert.
Weighted-covariance factor fuzzy C-means clustering. The Third International Conference on Technological
Advances in Electrical, Electronics and Computer Engineering (TAEECE 2015), Apr 2015, Beyrouth,
Lebanon. �10.1109/TAEECE.2015.7113616�. �hal-01187023�
Weighted-Covariance Factor Fuzzy C-Means
Clustering
Abbas Rammal, Eric Perrin, Valeriu Vrabie
CReSTIC-Châlons, University of Reims Champagne-Ardenne (URCA), Chaussée du Port, 51000 Châlons-en-Champagne, France [email protected],
[email protected], [email protected]
Isabelle Bertrand, Brigitte Chabbert
UMR 614 FARE, INRA-URCA, 2 Esplanade Roland Garros, BP 224, 51100 Reims, France INRA, UMR Eco&Sols, F-34060, Montpellier, France
[email protected], [email protected]
Abstract— In this paper, we propose a factor weighted fuzzy
c-means clustering algorithm. Based on the inverse of a covariance factor, which assesses the collinearity between the centers and samples, this factor takes also into account the compactness of the samples within clusters. The proposed clustering algorithm allows to classify spherical and non-spherical structural clusters, contrary to classical fuzzy c-means algorithm that is only adapted for spherical structural clusters. Compared with other algorithms designed for non-spherical structural clusters, such as Gustafson-Kessel, Gath-Geva or adaptive Mahalanobis distance-based fuzzy c-means clustering algorithms, the proposed algorithm gives better numerical results on artificial and real well known data sets. Moreover, this algorithm can be used for high dimensional data, contrary to other algorithms that require the computation of determinants of large matrices. Application on Mid-Infrared spectra acquired on maize root and aerial parts of Miscanthus for the classification of vegetal biomass shows that this algorithm can successfully be applied on high dimensional data.
Keywords— Fuzzy C-Means (FCM) clustering; Covariance-based weight; GK-algorithm; GG-algorithm; FCM-M algorithm; FCM-CM algorithm; FCM-SM algorithm; Mid-infrared (MIR) spectra; Classification of vegetal biomass.
I. INTRODUCTION
Clustering algorithms play an important role in data analysis and interpretation. A clustering algorithm groups data into clusters so that the data objects within a cluster have high similarity in comparison to one another, but are dissimilar to those data objects in other clusters. Fuzzy C-Means (FCM) is a very well-known algorithm of clustering which allows a data object to belong to several clusters. This method, developed by Dunn in 1973 [1] and improved by Bezdek in 1981 [2], is frequently used in pattern recognition.
The classical FCM algorithm is based on the Euclidean distance that is adapted for spherical structural clusters. The Mahalanobis Distance (MD) can be used to cover elliptical cases. However, Krishnapuram and Kim [3] pointed out that the MD cannot be used directly in the FCM algorithm as the number of cluster differs from the number of samples in the data set. To clusters data sets with different geometrical shapes, Gustafson-Kessel [4] proposed the GK, which is a FCM algorithm based on the Euclidian distance employing an adaptive norm in the clustering process. However, this algorithm add the constraint of a fuzzy covariance matrix not directly derived from the objective function. The Gath-Geva (GG) algorithm [5], an
extension of GK, takes the size and density of the clusters into account. However, GG uses a Gaussian distance that can only be used for data sets with multivariate normal distributions.
Liu and al. [6] have improved the limitation of GK and GG algorithms by adding a regulating factor of covariance matrix to each class. They modify the classical FCM algorithm by imposing in the objective function a logarithm of the determinant of the inverse covariance matrix. This algorithm based on an adaptive MD was called FCM-M. For improving the stability of the clustering results, they proposed another algorithm, the FCM-CM, by replacing all covariance matrices with the same covariance matrix in the computation of the objective function. They also proposed the FCM-SM algorithm that normalize each feature in the objective function, which implies that covariance matrices become correlation matrices [6]. However, these algorithms cannot be used for high dimensional data, such as spectra, because the estimation of the determinant of large matrices is computationally expensive and numerical solution may become instable.
The aim of this paper is to propose a factor weighted FCM algorithm based on the inverse of the covariance between all samples and the center of a class. The proposed clustering algorithm allows to cover spherical and non-spherical (elliptical) structural clusters. We compare the performances of our algorithm with respect to FCM, GG, GK, FCM-M, FCM-CM, and FCM-SM on a simulated data set and on well-known data sets that are classically used for FCM comparison purposes: real data sets: Iris, WBCD, WDBC, and Wine [7], [8] as well as artificial data sets generated by random generators: DataSet-3-3, DataSet-4-DataSet-3-3, and DataSet-5-2 [9]. We show on real high dimensional Mid-Infrared spectra that our algorithm gives better results as compared to the classical FCM algorithm..
II. FUZZY C-MEANS CLUSTERING (FCM) ALGORITHM
The FCM algorithm (a fuzzy version of the well know K-Means clustering algorithm) introduces the concept of fuzzy set in the class definition: each sample 𝒔𝑖= [𝑠𝑖1. . 𝑠𝑖𝑙 . . 𝑠𝑖𝐿]𝑇 ∈ 𝑹𝐿
belongs to each cluster “j” with a certain membership degree 𝑢𝑖𝑗, a cluster being characterized by its center of
gravity 𝒄𝑗= [𝑐𝑗1. . 𝑐𝑗𝑙 . . 𝑐𝑗𝐿]𝑇 ∈ 𝑹𝐿 . The FCM algorithm
minimizes an objective function based on the Euclidian distance between samples and centers of clusters weighted by the fuzzy memberships [1], [2]
𝐽𝐹𝐶𝑀 = ∑𝑗=1𝐾 ∑𝑁𝑖=1𝑢𝑖𝑗𝑚(𝒔𝑖− 𝒄𝑗)𝑇(𝒔𝑖− 𝒄𝑗), (1)
with N the number of available samples, K the desired number of clusters, and m ∈ [1, ∞ [ a fuzzier usually taken m = 2. It was proved that the following iterative algorithm minimizes the objective function [2].
Step 1) Initialize all memberships 𝑢𝑖𝑗 with random values
ranging between 0 and 1 such they satisfy the constraint: ∑𝐾𝑗=1𝑢𝑖𝑗 = 1, ∀ 𝑖 = 1 … 𝑁 (2)
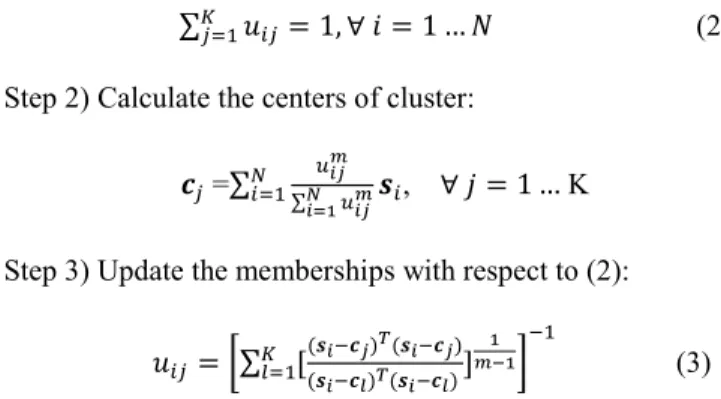
Step 2) Calculate the centers of cluster: 𝒄𝑗 =∑
𝑢𝑖𝑗𝑚 ∑𝑁𝑖=1𝑢𝑖𝑗𝑚 𝑁
𝑖=1 𝒔𝑖, ∀ 𝑗 = 1 … K
Step 3) Update the memberships with respect to (2):
𝑢𝑖𝑗 = [∑ [ (𝒔𝑖−𝒄𝑗)𝑇(𝒔𝑖−𝒄𝑗) (𝒔𝑖−𝒄𝑙)𝑇(𝒔 𝑖−𝒄𝑙) ] 1 𝑚−1 𝐾 𝑙=1 ] −1 (3) Step 4) Repeat steps 2 and 3 until the algorithm converges, i.e. the difference between the current membership matrix and the previous one is below a specified tolerance value, ϵ, or the number of iteration reaches a maximum value.
III. WEIGHTED-COVARIANCE FACTOR FCM ALGORITHM
Although the Mahalanobis Distance (MD) maps all clusters to spheroids of the same size, it unfortunately makes the objective function “flat”. It is well-known that the MD is invariant to linear transformations. But, in the crisp case (the membership are crisp), the objective function is a constant regardless of how the data set is partitioned. If the memberships are fuzzy, the objective function is minimized with respect to 𝑢𝑖𝑗 subject to Eq. (2). Using a Lagrange multiplier, every point
is equally shared by all clusters, which is not an interesting result. Therefore, the MD cannot be used directly in the FCM algorithm as pointed out in [3]. Indeed, we cannot introduce the covariance matrix between samples and centers in equation (1).
For this reason, we introduce a factor weighted fuzzy c-means clustering algorithm based on the covariance information. The proposed factor is given by:
𝛼𝑗= [∑𝑁𝑖=1|𝑐𝑜𝑣(𝒄𝑗, 𝒔𝑖)|] −1
∀ 𝑗 = 1 … K (4) and represents the inverse of the sum of absolute covariance between all samples 𝒔𝑖 and the center 𝒄𝑗 of the cluster “j”. This
factor is a measure of the collinearity. That means that if 𝒔𝑖 are
scaled, the value of 𝛼𝑗 does not change.
The proposed weighted-covariance factor FCM algorithm, that we will call FCM-R algorithm, has the same steps as the FCM algorithm, but the Eq. (3) in step 3 is replaced with the following relation: 𝑢𝑖𝑗 = [∑ [ 𝛼𝑗(𝒔𝑖−𝒄𝑗)𝑇(𝒔𝑖−𝒄𝑗) 𝛼𝑙(𝒔𝑖−𝒄𝑙)𝑇(𝒔 𝑖−𝒄𝑙) ] 1 𝑚−1 𝐾 𝑙=1 ] −1 (5)
IV. ANALYSIS OF THE FCM-R ALGORITHM BEHAVIOR
Firstly, we compare the proposed FCM-R algorithm with FCM, GG, GK, FCM-M, FCM-CM, and FCM-SM algorithms on non-spherical structural clusters.
A data set composed of 200 samples for the class c1 and 700 samples for the class c2 is randomly generated using a
two-dimensional Gaussian distribution. The mean vector and the covariance matrix are m(1) = [3 ; 4] and σ(1) = [σ
1 (1) 0; 0 σ2 (1) ], with σ1 (1) =0.5 and σ2 (1)
= 1 for the first class, and m(2) = [0.5 ; 2]
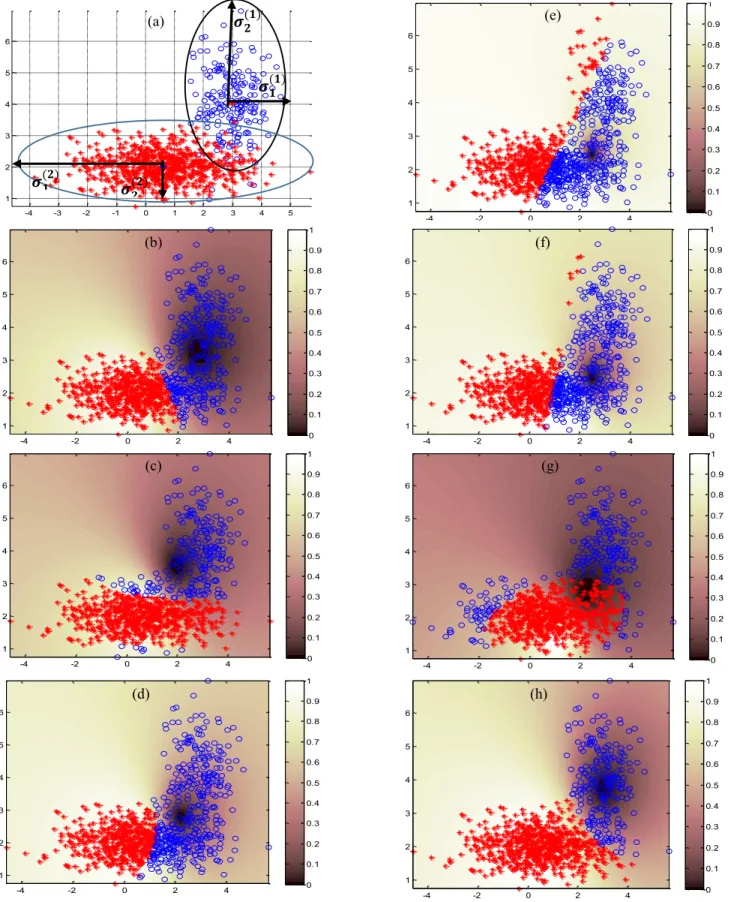
and σ(2) = [σ 1 (2) 0; 0 σ2 (2) ], with σ1 (2) =2 and σ2 (2) = 0.2 for the second class. The generated two-dimensional data set, shown in Figure I(a), has superposed elliptical (non-spherical) structural clusters with unbalanced sizes.
The above mentioned clustering algorithms were applied on this data set. Parameters chosen were: m=2, the number of clusters = 2, and ϵ = 10-6. The results of the classifications are
depicted in Figures I(b) – I(h), the membership 𝑢𝑖2 with respect
to the second class representing the background of each figure. Note that the center of the second class can be identified as the brightest point of the background. For each algorithm, we calculated the well-classification ratio after the defuzzification process, which consists in choosing the class with the highest membership value. The obtained results are presented in table I.
TABLE I. RATIOS OF WELL CLASSIFIED SAMPLES FOR DIFFERENT CLASSIFICATION ALGORITHMS ON THE DATA SET REPRESENTED IN FIGURE 1
Algorithm The classification ratio (%)
FCM 83.1 % GG 92.2% GK 75.1% FCM-M 61.7% FCM-SM 69.9% FCM-M 88.2% FCM-R 96.4%
We deduce that non-spherical structural clusters are better classified by the FCM-R algorithm than the other algorithms
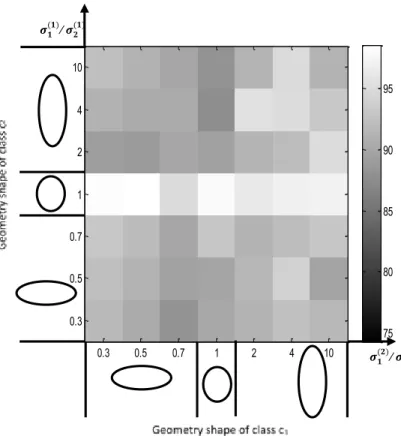
Secondly, to confirm that the proposed FCM-R algorithm can cover both spherical and non-spherical (elliptical) structural clusters, we have studied the performance of the FCM and FCM-R clustering algorithms when the geometry shape of two class in two-dimensional data set varies between the circle, horizontal ellipsoid and vertical ellipsoid.
For this, we have generated several data sets by varying the ratios σ1 (1) / σ2 (1) and σ1 (2) / σ2 (2)
independently for each class c1
and c2. The mean vectors were also changed in order to keep the
same superposition ratio of the two clusters. The sizes of classes were kept unchanged. The classes c1 and c2 vary from horizontal
ellipsoid if σ1(.)/ σ2(.) < 1 to vertical ellipsoid if σ1(.)/ σ2(.) > 1, passing through circle (spherical) forms when σ1
(.)
/ σ2 (.)
= 1. Figures II and III show the well-classification ratios of the FCM and FCM-R clustering algorithms according to the ratios σ1(1)/ σ2 (1) and σ1 (2) / σ2 (2)
, that is, according to the variation of the geometric shape of the clusters. The parameters were chosen the same as for the previous simulation.
-4 -3 -2 -1 0 1 2 3 4 5 1 2 3 4 5 6 -4 -2 0 2 4 1 2 3 4 5 6 0 0.1 0.2 0.3 0.4 0.5 0.6 0.7 0.8 0.9 1 -4 -2 0 2 4 1 2 3 4 5 6 0 0.1 0.2 0.3 0.4 0.5 0.6 0.7 0.8 0.9 1 -4 -2 0 2 4 1 2 3 4 5 6 0 0.1 0.2 0.3 0.4 0.5 0.6 0.7 0.8 0.9 1 -4 -2 0 2 4 1 2 3 4 5 6 0 0.1 0.2 0.3 0.4 0.5 0.6 0.7 0.8 0.9 1 -4 -2 0 2 4 1 2 3 4 5 6 0 0.1 0.2 0.3 0.4 0.5 0.6 0.7 0.8 0.9 1 -4 -2 0 2 4 1 2 3 4 5 6 0 0.1 0.2 0.3 0.4 0.5 0.6 0.7 0.8 0.9 1 -4 -2 0 2 4 1 2 3 4 5 6 0 0.1 0.2 0.3 0.4 0.5 0.6 0.7 0.8 0.9 1
𝝈
𝟏(𝟐)𝝈
𝟏(𝟏)𝝈
𝟐(𝟏)𝝈
𝟐(𝟐) (a) (b) (c) (d) (e) (f) (g) (h)Fig. I. (a) Randomly generated data. “o” represents the 200 samples of the class c1 and “+” the 700 samples of the class c2. (b)-(h): Results of the classification
methods: (b) FCM, (c) GG, (d) GK, (e) FCM-CM, (f) FCM-SM, (g) FCM-M, (h) FCM-R. Identified classes after defuzzification are also denoted with the same “o” and “+” symbols. The background represents the memberships 𝒖𝒊𝟐 with respect to the second class using a sepia tone colorization grayscale colormap.
If the two clusters have spherical shapes, the FCM algorithm gives the best classification percentage. However, for non-spherical shapes, the accuracy of the classification decreases significantly. The FCM-R gives better classification ratios for both spherical and non-spherical structural clusters cases.
V. BENCHMARK ON WELL-KNOWN DATA SETS
We test here the performances of FCM, GK, GG, FCM-M, FCM-CM, FCM-SM, and FCM-R algorithms for three artificial and four real well-known data sets. The artificial data sets are DataSet-3-3, DataSet-4-3, and DataSet-5-2 [9]. These data sets are similar data sets generated by random generators. The real life data sets are Iris, Wisconsin Breast Cancer (WBCD), Wisconsin Diagnostic Breast Cancer (WDBC), and Wine [7], [8]. Information about data sets are shown in table II.
Each classification algorithm was applied 100 times for the real data sets with random initializations. For the artificial data sets, data were generated 100 times and for each realization, all algorithms with random initializations were applied. Parameters chosen were: m=2, the number of clusters = 2, and ϵ = 10-6. Well
classified data are transformed into well-classified ratios which are then weighted over the 100 realizations. Final results are shown in tables III and IV.
TABLE II. INFORMATION ABOUT THE USED DATA SETS
Data set Attributes Classes Sample number
Iris 4 3 150 (50 for each class)
WDBC 30 2 569 (357 for c1, 212 for c2)
WBCD 9 2 583 (444 for c1, 239 for c2)
Wine 13 3 178 (59 for c1, 71 for c2, 48
for c3)
DataSet-3-3 3 3 150 (50 for each class) DataSet-4-3 3 4 400 (100 for each class) DataSet-5-2 2 5 500 (100 for each class)
TABLE III. MEAN RATIOS OF WELL CLASSIFIED SAMPLES OVER 100
CLASSIFICATIONS FOR THE REAL DATA SETS
Algorithm Iris WDBC WBDC Wine
FCM 89.33% 84.53% 94.53% 68.52% GK 90.00% 72.20% 92.37% 60.97% GG 71.73% 80.57% 91.91% 61.04% FCM-M 89.32% 84.50% 73.16% 53.12% FCM-CM 89.33% 84.50% 95.44% 60.19% FCM-SM 89.33% 84.51% 76.32% 59.99% FCM-R 90.00% 88.18% 96.13% 71.32%
The FCM-R gives the best result according to what is presented in table 3. For the Iris data set, the FCM-R algorithm gives 89.99% ( ≈ 90.00%) which is an essential result. Regarding the second, third and fourth real data sets, the FCM-R algorithm gives the highest numbers in three columns (88.18% in WDBC, 96.03% in WBDC and 68.58% in Wine). Concerning the artificial data sets, the FCM-R provides a good achievement since for DataSet-4-3 and DataSet-3-3 the results are the best ones, respectively 100% and 95.34%. Results for the DataSet-5-2 are better using the GK algorithm, however the FCM-R performs well enough. These results indicate that the performances of the proposed FCM-R algorithm are generally better for artificial and real well-known data sets.
0.3 0.5 0.7 1 2 4 10 0.3 0.5 0.7 1 2 4 10 75 80 85 90 95 0.3 0.5 0.7 1 2 4 10 0.3 0.5 0.7 1 2 4 10 75 80 85 90 95 𝝈𝟏(𝟐)/ 𝝈𝟐(𝟐) 𝝈𝟏 (𝟏)/ 𝝈 𝟐 (𝟏)
Fig. II. The result of the FCM according to variation of the geometric shapes of the two clusters.
𝝈𝟏 (𝟐)/ 𝝈
𝟐 (𝟐) 𝝈𝟏(𝟏)/ 𝝈𝟐(𝟏)
Fig. III. The result of the proposed FCM-R algorithm according to variation of the geometric shape of the two clusters.
TABLE IV. MEAN RATIOS OF WELL CLASSIFIED SAMPLES ON ARTIFICIAL DATA GENERATED 100 TIMES
Algorithm DataSet-3-3 DataSet-4-3 DataSet-5-2
FCM 94.66% 100% 92.80% GK 91.33% 99.52% 93.44% GG 70.96% 48.98% 66.12% FCM-M 67.24% 48.19% 59.96% FCM-CM 69.98% 53.84% 59.49% FCM-SM 73.25% 51.55% 60.52% FCM-R 95.34% 100% 88.82%
VI. APPLICATION ON REAL MIR SPECTRA
Infrared spectroscopy allows to analyze plants samples and derived products. The classification of infrared spectra reflects the chemical similarity of plants in a cluster in comparison to one another [10]. We have tested the FCM-R algorithm for the classification of lignocellulosic biomass.
In the first application, 16 samples of maize roots are considered. The samples come from two distinct parental lines (F2 and F292), each of these lines being completed with 4 mutants. For F2 we have “the parent” and 4 mutants, the same for F292. This group of 10 samples was completed by 6 roots of hybrid maize G1 to G6. We have thus 3 classes (F2, F292, and G), the first and second being composed of 5 samples, and the third of 6 samples.
In the second application, 12 samples of basal and apical levels of Miscanthus internodes from two distinct harvests, autumn 2007 and February 2008, are considered. We have thus 2 classes (early and late) each one being composed of 6 samples. Spectra were acquired on raw samples (without any chemical pretreatment method) over the total spectral range of the Mid-Infrared (MIR) 400-4000 cm-1, using the Fourier
transform infrared spectroscopy. The influence of preprocessing of spectra within the classical FCM was studied in [11]. The method of preprocessing used is the baseline removal followed by Standard Normal Variate (SNV). Table V shows the information of acquired spectra.
We note that GK, GG, FCM-M, FCM-CM, and FCM-SM algorithms cannot be used for classification of high dimensional infrared spectra because the determinant calculation of large matrices (1869 x 1869) is computationally expensive and numerical solution may become unstable. Table V1 shows the classification results using the same parameters as previously (m=2, the number of clusters the expected one (see table V), and ϵ = 10-6). The FCM algorithm gives a ratio of well classified samples of 84.13% for the maize roots and 93.20% for the miscanthus internodes, while the proposed FCM-R algorithm gives respectively 84.88% and 98.10%. It turns out that the FCM-R also provides the best classification results.
TABLE V. INFORMATION ABOUT THE MIR SPECTRA RECORDED ON LIGNOCELLULOSIC BIOMASS
Data Sets Attributes Classes Sample number Maize 1869 3 16 (5 for c1, 5 for c2, 6
for c3)
Miscanthus 1869 2 12 (6 for each class)
TABLE VI. RATIOS OF WELL CLASSIFIED LIGNOCELLULOSIC BIOMASS USING HIGH DIMENSIONAL REAL MIR SPECTRA
Algorithm Maize Miscanthus
FCM 84.13% 93.20%
FCM-R 84.88% 98.10%
VII. CONCLUSION
The well-known FCM clustering algorithm based on Euclidean distance can only be used to classify spherical structural clusters. GK and GG algorithms were developed to detect non spherical structural clusters. However, the former needs additional constraints on fuzzy covariance matrix, the later can only be used for the data with multivariate Gaussian distribution. Three FCM clustering algorithms based on the Mahalanobis distance, called FCM-M, FCM-CM, and FCM-SM were proposed. However, the determinant calculation of large matrices for real life applications such as spectra restricts their use.
In this paper we have proposed a weighted-covariance factor FCM algorithm, the FCM-R. The weighting factor is a measure of the collinearity between the center of a class and the samples and takes into account the compactness of samples in the clusters. The proposed FCM-R algorithm is robust, tolerating high dimensional data and unequal size of clusters. It is also able to well classify non-spherical structural clusters.
Numerical examples show that FCM-R actually work generally better than FCM, GK, GG, FCM-M, FCM-CM, and FCM-SM. In addition, FCM-R gives the best performance among these algorithms on real well-known data sets (WDBC, WBDC, Wine, but also Iris) and can be successfully applied on high dimensional data. The results obtained for the classification of Mid-Infrared spectra acquired on lignocellulosic biomass show that the FCM-R algorithm has a better performance than the classical FCM based on the Euclidean distance.
ACKNOWLEDGMENT
The research for this paper was financially supported by the EMERGENCE “SSELVES” Grant of the Champagne-Ardenne Regional Council, France.
REFERENCES
[1] J.C. Dunn, “A fuzzy relative to the ISODATA process and its use in detecting compact, well-separated clusters”, Journal Cybernetics, vol. 3, no. 3, pp. 32-57, 1973.
[2] J. C. Bezdek, “Pattern Recognition with Fuzzy Objective Function Algorithms”, Plenum press, New York, pp. 65-70, 1981.
[3] R. Krishnapuram and J. Kim, “A note on the Gustafson-Kessel and adaptive fuzzy clustering algorithm”, IEEE Transactions on Fuzzy Systems, vol. 7, no. 4, pp. 453-461, August 1999.
[4] D. E. Gustafson and W. C. Kessel, “Fuzzy Clustering with a Fuzzy Covariance Matrix”, Proc. IEEE Conference on Decision and Control, San Diego, CA, USA, vol. 17, pp. 761-766, 1979.
[5] I. Gath and A. B. Geva, “Unsupervised optimal fuzzy clustering”, IEEE Transactions on Pattern Analysis and Machine Intelligence, vol.11, pp.773-781, 1989.
[6] H. Liu, B. Jeng, J. Yih and Y. Yu, “Fuzzy C-Means Algorithm Based on Standard Mahalanobis Distances”, International Symposium on Information Processing, China, pp. 422-427, August 2009.
[7] W. Wang and Y. Zhang, “On fuzzy cluster validity indicies”, Fuzzy Sets and Systems, vol.158, no. 19, pp. 2095-2117, 2007.
[8] C. Blake, E. Keogh and C. J. Merz, “UCI Repository of Machine Learning Databases”, Dept. Inf. Comput. Sci., Univ. California, Irvine, CA, 1998. [9] B. Rezaee, “A cluster validity index for fuzzy clustering”, Fuzzy Sets and
Systems, vol. 161, pp. 3014-3025, 2010.
[10] H. Chen, C. Ferrari, M. Angiuli, J. Yao, C. Raspi and E. Bramanti, “Qualitative and quantitative analysis of wood samples by Fourier transform infrared spectroscopy and multivariate analysis”, Carbohydrate polymers, vol. 82, pp. 772-778, 2010.
[11] A. Rammal, E. Perrin, B. Chabbert, I. Bertrand, G. Mihai and V. Vrabie, “Optimal preprocessing of Mid InfraRed spectra. Application to classification of lignocellulosic biomass: maize roots and miscanthus internodes”, International Conference on Mass Data Analysis of Images and Signals (MDA), New York, July 2013..