Development of Chemical-Free Methods of Fouling
Mitigation for Membrane Processes in Desalination
by
Omar Labban
B.S.M.E., American University in Dubai (2014)
S.M., Massachusetts Institute of Technology (2016)
Submitted to the Department of Mechanical Engineering
in partial fulfillment of the requirements for the degree of
Doctor of Philosophy in Mechanical Engineering
at the
MASSACHUSETTS INSTITUTE OF TECHNOLOGY
May 2020
c
○ Massachusetts Institute of Technology 2020. All rights reserved.
Author . . . .
Department of Mechanical Engineering
May 15, 2020
Certified by . . . .
John H. Lienhard V
Abdul Latif Jameel Professor of Water
Director, Abdul Latif Jameel Water and Food Systems Lab
Director, Rohsenow Kendall Heat Transfer Laboratory
Thesis Supervisor
Accepted by . . . .
Nicolas G. Hadjiconstantinou
Chairman, Committee on Graduate Students
Development of Chemical-Free Methods of Fouling Mitigation
for Membrane Processes in Desalination
by
Omar Labban
Submitted to the Department of Mechanical Engineering on May 15, 2020, in partial fulfillment of the
requirements for the degree of
Doctor of Philosophy in Mechanical Engineering
Abstract
As water scarcity continues to intensify around the globe, the need for more efficient and sustainable desalination technologies has never been more pressing. While mem-brane technology, namely reverse osmosis (RO), currently stands as the most energy efficient desalination technology, it is plagued by fouling undercutting both produc-tivity and permeate quality. To restore performance, desalination plants resort to chemical cleaning, incurring losses in productivity, chemical cost, and membrane re-placement all while raising environmental concerns associated with chemical waste. In this work, we explore alternative chemical-free methods of membrane fouling mit-igation.
First, membrane pretreatment using nanofiltration is investigated as a means of mitigating inorganic fouling in downstream desalination systems. Transport model-ing is employed in fabricatmodel-ing specialized nanofiltration membranes for desalination pretreatment. The Donnan-Steric Pore Model with dielectric exclusion (DSPM-DE) is used to probe for desirable membrane properties, while new membranes are system-atically fabricated in-house using layer-by-layer (LbL) deposition to validate model predictions and to develop a new specialized membrane for this application. The new membrane presents a 30% increase in permeability and a 50% reduction in permeate hardness relative to state-of-the-art NF membranes.
Apart from proactive pretreatment approaches, reactive approaches remain nec-essary in handling already fouled RO membranes. To that end, osmotically-induced cleaning (OIC), whereby a RO membrane effectively undergoes osmotic backwashing, is explored. Specifically, the effectiveness of OIC against organic fouling is examined, underlying mechanisms are elucidated, and potential applicability in the presence of spacers is investigated. While experimental results demonstrate flux recoveries of up to 30%, the method’s effectiveness is shown to be dramatically influenced in the presence of spacers and far from completely eliminating a biofilm or preventing its regrowth once operation is resumed.
Given the practical limitations of OIC, we finally present the development of deformation-induced cleaning (DIC), a novel chemical-free fouling mitigation method
applicable to commercially existing spiral-wound membrane modules. The method employs controlled membrane deformation through pressure modulation, which in-duces shear stresses at the foulant-membrane interface that lead to detachment and removal of the foulants. Experiments on organic fouling by alginate are conducted on a flat-sheet membrane coupon followed by tests on a commercial spiral-wound module. Shutdown durations are shown to be six-fold lower, while flux recover-ies are comparable to those of chemical methods. In-situ visualization is employed alongside bench-scale experiments to elucidate the underlying mechanisms and ulti-mately devise an optimized chemical-free fouling mitigation strategy. Experiments on a commercial spiral-wound module indicate this method will have applicability in industrially-relevant settings. By enabling more frequent cleanings, DIC consider-ably lowers operating expenses while offering a more sustainable and environmentally sound solution to membrane fouling mitigation in desalination.
Thesis Supervisor: John H. Lienhard V Title: Abdul Latif Jameel Professor of Water
Director, Abdul Latif Jameel Water and Food Systems Lab Director, Rohsenow Kendall Heat Transfer Laboratory
Acknowledgments
I want to start by acknowledging my thesis advisor, Professor John H. Lienhard, for being the phenomenal mentor he is and without whom this work would not have been possible. His continuous care and relentless support, even at the bleakest of times, have been instrumental to the success of this research. Professor, the past six years in your group have taught me tremendously, and for that I am very thankful.
Furthermore, I want to acknowledge my thesis committee members, Professors Xuanhe Zhao and Zachary Smith for always pushing me to aim higher and enlight-ening me with their feedback and insights. I am also thankful to my lab mates for making the lab the wonderful work environment it has been over the past six years. Specifically, I want to acknowledge Dr. Yagnaseni Roy for sharing with me the nanofil-tration code used in this thesis and Dr. Emily Tow for getting me started with the fouling work.
In addition to my thesis advisor, committee members, and lab mates, I would be remiss if I do not acknowledge the exceptional collaborators I have had during my time at MIT. First, I want to acknowledge Dr. Liu Chang, Professor Ziggy Chong, and Professor Rong Wang of the Singapore Membrane Technology Center (SMTC) at the Nanyang Technological University (NTU) for a wonderful collaboration that paved the way to the exciting work I have been part of on nanofiltration.
Second, I want to acknowledge Dr. Tianyi Chen, Professor Leslie Norford, and Professor Ahmed Ghoniem for a memorable collaboration that started as a class project in 2.62 (Advanced Energy Conversion) before growing into a fully fledged research effort. The work we authored on HVAC, while not part of this thesis, will certainly remain a memorable and unique part of my experience at MIT.
Third, I want to acknowledge the research team I had the privilege of working with as part of the fouling work presented in this thesis. Dr. Grace Goon and Zi Hao Foo, thank you for a wonderful collaboration that formed one of the most memorable experiences I have had at the institute. To my undergraduate student assistants (UROP’s), Annetoinette Figueroa and Bryan Padilla, I want to say thank you for
your help with the design of the setup and execution of the experiments. To Lara, my third undergraduate assistant, I want to say thank you for contributing to the graphic design of the figures presented in this work. The figures would not look this crisp without your artistic skills.
Apart from research, I want to acknowledge the MechE staff for being a tremen-dous source of support over the past six years. Specifically, I want to acknowledge our academic administrator, Leslie Regan, and lab assistant, Christine Gervais, whose kindness, consideration, and support have been central to the completion of this work. I also want to acknowledge Professor Ghoniem for offering me the opportunity to TA his class, 2.62, coming full circle before graduating.
Moreover, I want to thank MIT for being the exceptional place it has been, of-fering me an unparalleled graduate school experience I shall always remember. It has certainly been a privilege to meet, learn, and work alongside the best and the brightest. I want to thank all sponsors at who have supported this work (CEN-SAM, SMART, and J-WAFS). I also want to thank the Ashdown community and my friends in Cambridge and Dubai for their continuous support over the time of my Ph.D. journey.
Finally, I wish to thank my parents and siblings for their unconditional love and support without which none of this would have come to fruition. For their under-standing of my absence and compassion I shall always be grateful.
Contents
1 Introduction 21
1.1 Global Water Scarcity and the Need for Improved Membrane-based
Desalination . . . 21
1.2 Membrane Fouling: The Achilles’ Heel of Membrane Processes . . . . 22
1.3 Overview of Chemical Cleaning . . . 24
1.4 Chemical-free Membrane Fouling Mitigation . . . 25
1.4.1 Osmotically-induced Cleaning (OIC) . . . 27
1.4.2 Vibration-assisted Membrane Cleaning . . . 30
1.4.3 Nanofiltration Pretreatment for Desalination Pretreatment . . 31
1.5 Thesis Research Objectives . . . 32
1.5.1 Approach . . . 33
2 Relating Transport Modeling to Nanofiltration Membrane Fabrica-tion for DesalinaFabrica-tion Pretreatment 37 2.1 Introduction . . . 37
2.2 Theoretical Background . . . 40
2.2.1 Governing equations of NF . . . 41
2.2.2 Fitting parameters: The limitation of traditional NF modeling 46 2.2.3 Achieving low-pressure separation . . . 47
2.2.4 Pathways to guiding membrane fabrication . . . 48
2.3 Materials and methods . . . 50
2.3.1 Materials and membranes . . . 50
2.3.3 Nanofiltration experiments . . . 53
2.3.4 Membrane Characterization . . . 54
2.4 Results and discussion . . . 56
2.4.1 Target metric and benchmark definitions . . . 56
2.4.2 Modeling results . . . 57
2.4.3 Experiments and validation . . . 64
2.4.4 Takeaways from modeling and experimental results . . . 68
2.4.5 Pathway to a specialized membrane . . . 69
2.5 Conclusions . . . 74
3 Osmotically-Induced Cleaning of Fouled Reverse Osmosis Membranes in Desalination 77 3.1 Introduction . . . 77
3.2 Experimental Methods . . . 81
3.3 Results . . . 83
3.4 Conclusions . . . 86
4 Deformation-induced cleaning of fouled membranes and its applica-bility to spiral-wound modules 89 4.1 Introduction . . . 89
4.2 Experimental methods . . . 91
4.2.1 Cross-flow experiments . . . 91
4.2.2 Feed solution and chemicals . . . 93
4.2.3 Deformation-induced cleaning (DIC) protocol . . . 95
4.2.4 Chemical cleaning protocol . . . 96
4.3 Results and discussion . . . 96
4.3.1 Flat sheet module . . . 97
4.3.2 Foulant-membrane interactions and underlying mechanisms . . 99
4.3.3 Spiral-wound module . . . 103
4.4 Implications . . . 105
4.4.2 Case study: Results and discussion . . . 110
4.5 Conclusions . . . 112
5 Deformation-induced cleaning: Analysis of key factors and condi-tions influencing the effectiveness of fouling mitigation 115 5.1 Introduction . . . 115
5.2 Materials and methods . . . 118
5.2.1 Crossflow experiments . . . 118
5.2.2 Feed solution and chemicals . . . 119
5.2.3 Deformation-induced cleaning protocol . . . 120
5.3 Results and discussions . . . 121
5.3.1 Controlled surface response . . . 121
5.3.2 Important DIC considerations: Pneumatic limitations and pre-serving membrane integrity . . . 123
5.3.3 DIC in the absence of spacers . . . 126
5.3.4 Effect of frequency and cleaning initiation flux . . . 128
5.3.5 DIC in the presence of spacers . . . 131
5.3.6 Effect of feed channel spacing . . . 134
5.3.7 Comparison to osmotically-induced cleaning (OIC) . . . 136
5.4 Conclusions . . . 137
6 Conclusions 141 6.1 Future directions . . . 143
List of Figures
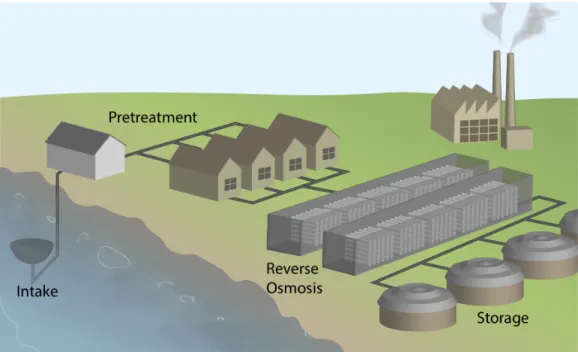
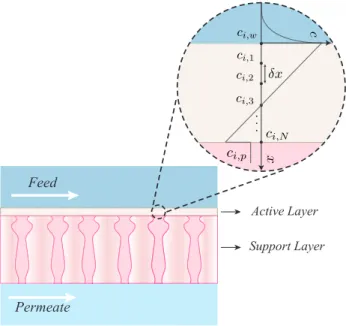
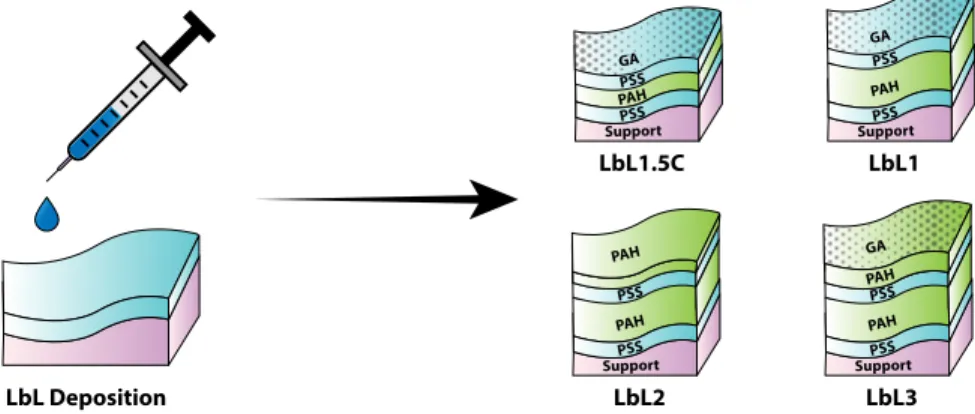
1-1 Layout and operation of a typical desalination plant. . . 26 2-1 Modeling chemical transport through a NF membrane . . . 43 2-2 Permeability-selectivity trade-off encountered in practice. . . 48 2-3 Schematic of the LbL deposition procedure and membranes fabricated
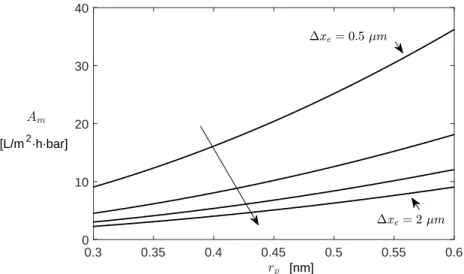
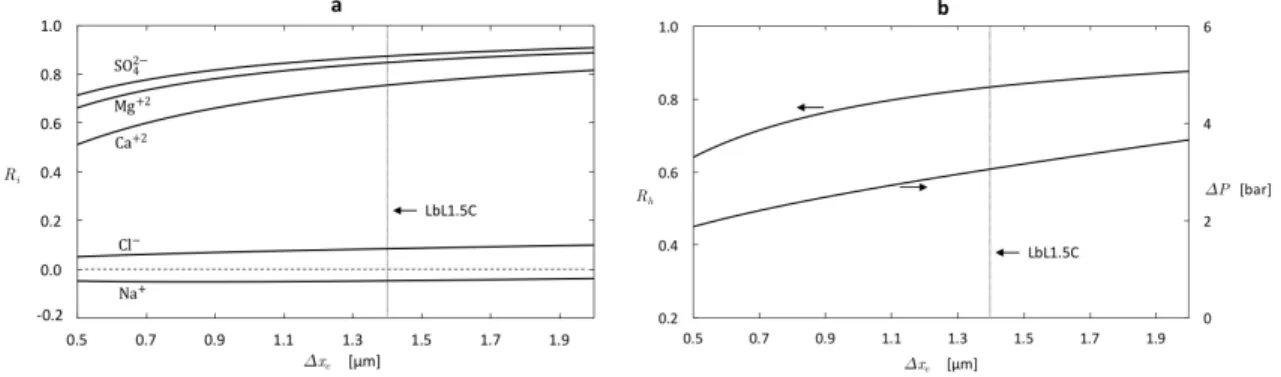
(not to scale). . . 53 2-4 Membrane pure water permeability as a function of structural properties. 58 2-5 Predicted effect of thickness on membrane performance: (a) Ion
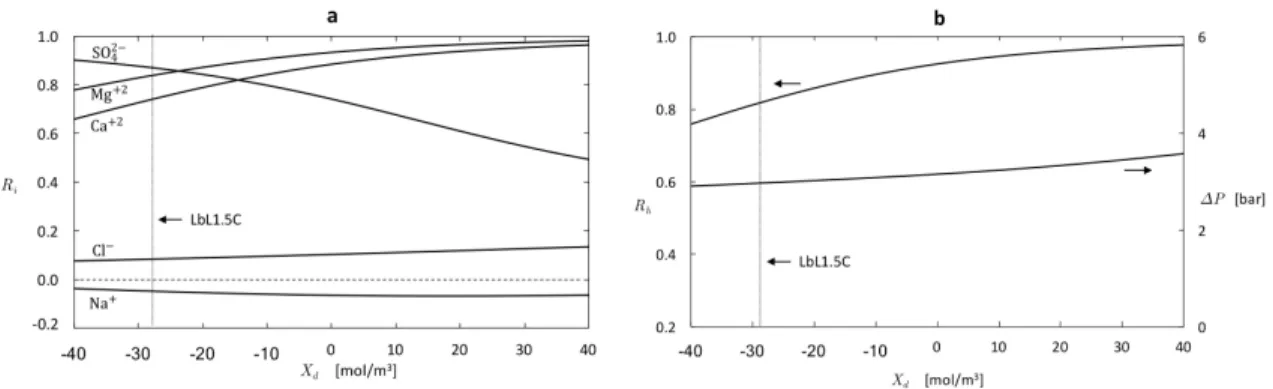
rejec-tion (b) Hardness removal and applied pressure required to maintain a constant permeate flux of 𝐽𝑣* = 1 × 10⁻⁶ m/s = 3.6 L/m2·h. . . . . 59 2-6 Predicted effect of charge density on membrane performance: (a) Ion
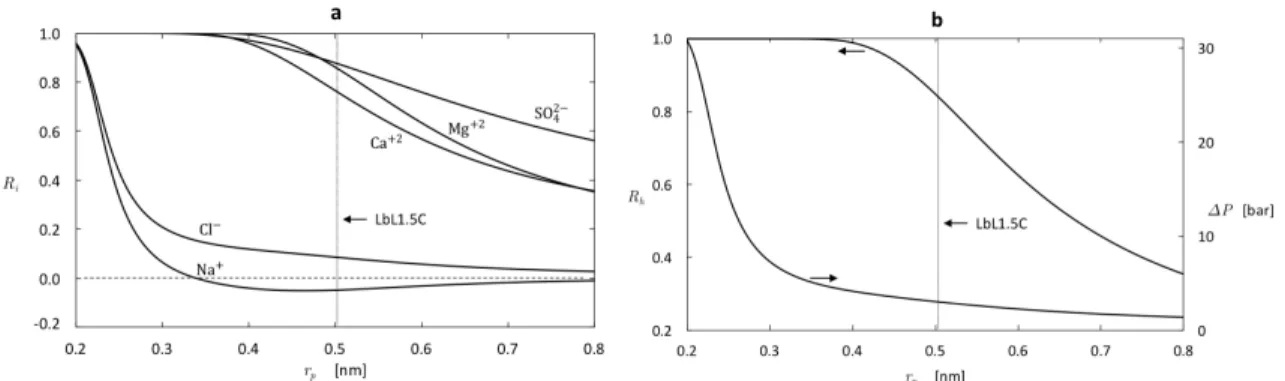
rejection (b) Hardness removal and applied pressure required to main-tain a constant permeate flux of 𝐽𝑣* = 1 × 10⁻⁶ m/s = 3.6 L/m2·h. . . 61 2-7 Predicted effect of pore size on membrane performance: (a) Ion
rejec-tion (b) Hardness removal and applied pressure required to maintain a constant permeate flux of 𝐽𝑣* = 1 × 10⁻⁶ m/s = 3.6 L/m2·h. . . . . 63 2-8 Predicted effect of the pore dielectric constant on membrane
perfor-mance: (a) Ion rejection (b) Hardness removal and applied pressure required to maintain a constant permeate flux of 𝐽𝑣* = 1 × 10⁻⁶ m/s = 3.6 L/m2·h. . . . 64 2-9 Performance test results: Pure water permeability (PWP). . . 66 2-10 Synthetic seawater test results at 4 bar: (a) Permeate flux (b) Hardness
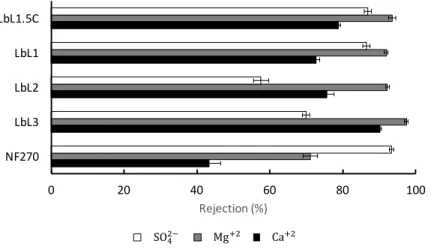
2-11 Synthetic seawater test results at 4 bar: Individual divalent ion rejections. 68
3-1 Schematic illustrating the fouling mechanism employed. . . 78
3-2 Cleaning mechanisms underlying the potential of OIC. . . 79
3-3 Schematic illustrating osmotically-induced cleaning (OIC) for a fouled RO membrane. . . 80
3-4 Schematic diagram of the experimental flat-sheet setup for in-situ foul-ing and cleanfoul-ing visualization. . . 81
3-5 Procedure for real biofilm experiments. . . 83
3-6 Normalized flux fouling and cleaning performance results: (a) spacer-less feed channel under low crossflow cleaning velocities; and (b) com-parison between spacer-less and spacer-filled feed channels under high crossflow cleaning velocities. . . 84
3-7 Video stills of the swelling process with: (a) no spacer and high cross-flow; (b) no spacer and low crosscross-flow; and (c) fine spacer and high crossflow. The dark blue solid represents the foulant that formed on the surface of the membrane. . . 85
3-8 Confocal microscopy images of the membrane surfaces that were rinsed and soaked in (a) DI Water, (b) 3%, (c) 10%, (d) 22% sea salt solution. An image, showing some remnant live bacteria on the surface after soaking the membrane surface in 70% ethanol solution, is added for reference. The percentages at the bottom of the images were derived from counting the pixels that exceed a threshold limit, and indicate how much of the area is covered by bacteria. . . 86
4-1 Potential of deformation-induced cleaning. . . 90
4-2 Schematic diagram of the cross-flow filtration apparatus. . . 93
4-3 Demonstration of deformation-induced cleaning. . . 98
4-4 Illustration of the effect of membrane deformation on the generation of interfacial shear stresses in the membrane-foulant bilayer. . . 100
4-6 Spiral-wound module experiments. . . 104
4-7 Comparison between chemical and deformation-induced cleaning . . . 111
5-1 The concept of deformation-induced cleaning revisited. . . 116
5-2 Measuring the membrane surface response to pressure fluctuations. . 122
5-3 Important considerations surrounding DIC application. . . 124
5-4 DIC performance in the absence of spacers. . . 127
5-5 Effect of signal frequency and cleaning initiation flux on DIC perfor-mance. . . 129
5-6 DIC performance in the presence of spacers. . . 132
5-7 Effect of feed channel spacing on DIC performance. . . 135
List of Tables
1.1 Chemicals employed in CIP as a function of type of foulant type. . . 25
2.1 Chemical structure of polymers employed in LbL deposition. . . 50
2.2 Details regarding the fabrication of the LbL membranes. . . 52
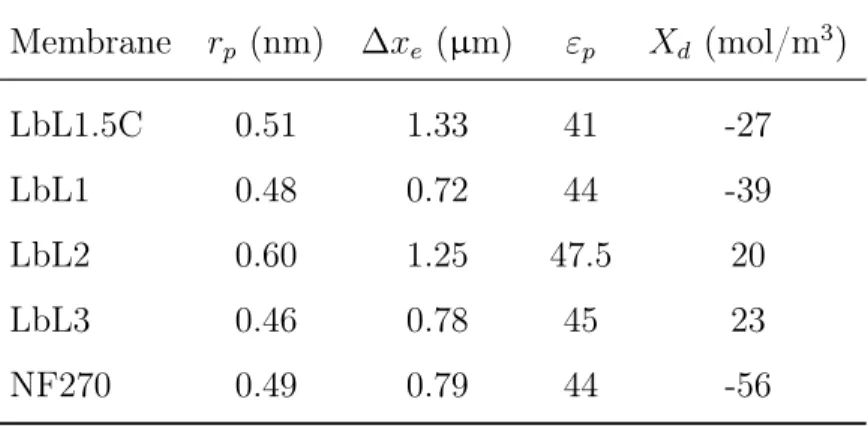
2.3 Synthetic seawater composition and charged solute properties(pH = 6.5). 54 2.4 Summary of model recommendations, taking the LbL1.5C as a bench-mark and synthetic seawater (Table 2.3) as feed water, for enhanced selectivity. . . 63
2.5 Membrane characterization parameters. . . 65
2.6 Summary of LbL fabricated membranes: Composition and properties (relative to the benchmark membrane). . . 70
2.7 LbL3 pure water permeability (PWP) measurements. . . 72
2.8 LbL3 uncharged solute experimental rejection (200 mg/kg). . . 72
2.9 LbL3 single salt experimental rejection (1000 mg/kg NaCl). . . 72
2.10 LbL3 synthetic seawater experimental rejection. . . 73
4.1 Final concentrations adopted for the flat-sheet cross-flow filtration ex-periments. . . 94
4.2 Final concentrations adopted for the spiral-wound cross-flow filtration experiments. . . 95
4.3 Nominal specifications of modeled desalination plant. . . 106
Nomenclature
Roman Symbols
𝐴 Debye–Hückel constant, m3/2/mol1/2 𝐴𝑚 Membrane permeability, L/m2·h·bar 𝐴*𝑚 Membrane active area per module, m2
𝐴𝑘 Membrane porosity
𝐴𝑡 Total membrane active area, m2
𝑐𝑖 Solute concentration of species 𝑖, mol/m3 ̃︀
𝑐𝑖 Solute concentration of species 𝑖, g/m3
𝐶 Cost of cleaning, $/m3
𝑑i Fiber inside diameter, m
𝐷 Membrane degradation rate
𝐷𝑖,𝑝 Diffusion coefficient of species 𝑖 in the pore, m2/s 𝐷𝑖,∞ Diffusion coefficient of species 𝑖 in the bulk, m2/s
𝑒 Elementary charge, 1.60218 × 10⁻¹⁹ C
𝑒* Specific energy consumption, kWh/m3
𝐹 Faraday constant, 96485.3 C/mol
𝐼 Ionic strength, mol/m3
¯
𝐽 Average system flux, LMH
¯
𝐽* Normalized average system flux
¯
𝐽𝑠𝑦𝑠 Target average system flux, 30 LMH 𝐽𝑖 Solute flux for species 𝑖, mol/m2· s 𝐽𝑣 Permeate flux, m3/m2· s
𝑘 Boltzmann constant, 1.38065 × 10⁻²³ J/K 𝑘𝑐,𝑖 Solute mass transfer coefficient of species 𝑖, m/s 𝐾𝑖,𝑐 Convection hindrance factor of species 𝑖
𝐾𝑖,𝑑 Diffusion hindrance factor of species 𝑖
𝐿 Module length, m
𝑀 𝑊𝑖 Molecular weight for species 𝑖, mol/m3
𝑁 Identity of the 𝑁th solute or number of production cycles over the mem-branes’ projected lifetime
𝑁𝐴 Avogadro’s number, 6.02214 × 10²³ mol-1
𝑁𝑚 Number of modules
Pe Péclet number
˙
𝑄 Feed flow rate, m3/hr
˙
𝑄𝑝 Permeate flow rate, m3/hr 𝑄𝑡𝑜𝑡 Total permeate produced, m3 𝑄𝑠ℎ Permeate lost during shutdown, m3 𝑟𝑖 Solute Stokes radius for species 𝑖, m 𝑟𝑝 Effective pore radius, m
𝑅 Universal gas constant, 8.31446 J/mol K
𝑅𝑖 Rejection ratio of species 𝑖
𝑅ℎ Hardness removal Re Reynolds number 𝑅𝑅 Recovery ratio 𝑠 salinity, mg/kg Sc Schmidt number Sh Sherwood number 𝑡 Time, hr
𝑡𝑐 Cleaning time with pump circulation, hr
𝑡𝑠 Spacer thickness, m
𝑇 Temperature, K
𝑉𝑚 Feed channel effective volume (per module), m3
𝑥 Position across membrane active layer, m
𝑋𝑑 Membrane charge density, mol/m3
𝑧𝑖 Ion valency of species 𝑖
Greek Symbols
𝛾𝑖 Activity coefficient of species 𝑖 ∆𝑃 Applied pressure difference, Pa ∆Π Osmotic pressure difference, Pa ∆𝑊𝑖 Born solvation energy barrier, J
∆𝑥 Thickness of membrane active layer, m
𝜀0 Permittivity of vacuum,8.85419 × 10−12 F/m 𝜀𝑏 Relative permittivity/dielectric constant of the bulk 𝜀𝑝 Relative permittivity/dielectric constant of the pore 𝜀𝑟 Relative permittivity/dielectric constant
𝜆𝑖 Ratio of solute Stokes radius to effective pore radius of species 𝑖
𝜇 Solution viscosity, Pa · s
𝜉 Electric potential gradient at the feed/membrane interface, V/m Ξ𝑖 Mass transfer coefficient correction factor for species 𝑖
𝜌 Solution density, kg/m3
𝜑𝑖 Ratio of permeate flux to the uncorrected mass transfer coefficient of species 𝑖
Φ𝑖 Steric partitioning coefficient of species 𝑖 Φ𝐵 Born solvation coefficient
𝜋 Cost factor, $/unit
𝜓 Electric potential, V
𝜏 Shear stress, Pa
Subscripts
𝑏 Bulk solution in the feed
𝑐 critical value
𝑐𝑐 chemical cleaning
𝑒 Effective or energy
𝑓 feed
𝑖 Solute identity or element number in a pressure vessel
lim Limiting rejection
𝐿 pressure loss
𝑚 Membrane
𝑚𝑖𝑛 minimum
𝑜𝑝 total operating time
𝑝 Membrane wall/permeate interface (just outside the membrane pores) 𝑝′ Membrane wall/permeate interface (just inside the membrane pores)
real Real rejection
𝑠ℎ total shutdown time
𝑤 Membrane wall/feed interface (just outside the membrane pores) 𝑤′ Membrane wall/feed interface (just inside the membrane pores)
𝑤 pure water
𝑦 yield condition
Superscripts
Chapter 1
Introduction
1.1
Global Water Scarcity and the Need for Improved
Membrane-based Desalination
At a time when 4 billion people are already facing the fallout of water scarcity [1], water demand is projected to intensify, fueled by a growing world population, climate change ramifications, and the rising standards of living in the developing world [2, 3]. A troubling report by the United Nations [4], for example, placing half the world population under water scarcity by 2050 only sheds some light at the magnitude of the challenge likely to be experienced over the coming decades. In light of the dire picture, the need for technological innovations addressing the problem cannot be overstated.
Despite its relative abundance, only 2.5% of the water on Earth is classified as freshwater. Of these freshwater reserves, only 30% is in a form that may be accessible for human consumption (rivers, lakes, groundwater, and air moisture) [5]. The mag-nitude of the challenge is already underscored by the extent of droughts and water shortages encountered recently in California, Cape Town, and Chennai.
In the Middle East and North Africa (MENA) region, the most water scarce region in the world, 17 countries already fall below the water poverty line defined by the United Nations. The World Bank estimates the challenge is likely to cost the region
6–14% of its GDP by 2050 [6]. For the first time in history, moreover, the global water crisis, now depriving hundreds of millions of people worldwide access to safe drinking water, topped the World Economic Forum’s list of global risks in 2015 as the greatest threat facing mankind over the coming decade [3].
Desalination, the production of freshwater from salty water, offers a more sus-tainable alternative, particularly in regions where other sources of freshwater are not directly accessible, by tapping into nature’s most abundant water resource, the ocean. With two thirds of the world population experiencing severe water scarcity [1], desali-nation has already become a key player in tackling one of the most pressing challenges of the century [7]. In fact, desalination has become indispensable for meeting water needs in the arid Middle East, and has become a major source of freshwater for northern China, Chennai India, Singapore, Spain, and many islands.
At present, reverse osmosis (RO) stands as the most efficient desalination tech-nology [8], providing up to 65% of the worldwide installed capacity [9]. In spite of the considerable progress achieved, further RO adoption has been hindered by high operating costs associated with the high applied pressures (pumping energy), the environmental footprint associated with brine discharge, and the propensity for membrane fouling and scaling.
1.2
Membrane Fouling: The Achilles’ Heel of
Mem-brane Processes
While successful, membranes in desalination are plagued by fouling, often dubbed the “Achilles’ heel of membrane processes”, to which considerable system downtime and lost productivity are attributed. Consequently, further adoption of RO membranes has been hindered, sometimes in favor of less energy efficient technologies that mainly present a higher fouling resistance [10].
Membrane fouling refers to the process through which particles or solutes are deposited on the membrane surface, leading to a lower permeate flux and quality, and
is broadly classified into organic fouling, colloidal fouling, biofouling, and inorganic fouling or scaling. The occurrence of fouling increases the energy consumption of desalination technologies and directly impacts their productivity due to the drop in permeability and system shutdown attributed to the Cleaning In Place (CIP) chemical procedure required afterwards. Chemical cleaning typically involves the introduction of harsh chemicals (HCl/NaOH), biocides (Cl2, NH2Cl), or oxidants (H2O2, NaOCl) to disrupt and remove the foulant layer.
To counteract the effects of RO fouling, membrane cleaning becomes necessary. Membrane cleaning is initiated in response to a set of predefined indicators, includ-ing: (a) 10–15% decrease in the permeate flow rate, (b) 10–15% increase in applied pressure, and (c) 10–15% increase in the concentration of total dissolved solids (TDS) in the permeate stream [5]. The cleaning frequency of RO membranes is determined by the type and quality of the feed stream processed. In desalination, for example, the cleaning frequency ranges from once every month to once every year depending on the quality of the feed water and the degree of pretreatment. The majority of RO membranes in desalination are cleaned every four to six months [5]. On the other hand, membrane cleaning is required at least once a day in the food industry, such as in dairy [11].
With RO membranes not designed to be hydraulically backwashed, plants resort to chemical cleaning despite the numerous drawbacks. Chemical cleaning, for ex-ample, raises environmental concerns associated with chemical waste management and disposal [12]. Furthermore, a system shutdown is inevitable and potentially pro-longed given the lack of a universal cleaning agent targeting the different foulants. The cost of chemicals and resulting membrane degradation make the process all the more undesirable. For these reasons, developing effective chemical-free cleaning and antifouling methods could pave the way for increased RO adoption, ultimately making desalination cheaper, widely accessible, and more sustainable.
1.3
Overview of Chemical Cleaning
Chemical cleaning of fouled RO membranes through a process known as CIP is a well established process representing the current state-of-the-art in this domain. The term Cleaning in Place (CIP) lends itself to the fact that the cleaning is performed while the membrane units remain installed in the pressure vessels. In this process, untreated permeate is used in preparing the necessary cleaning solutions which are subsequently stored in corresponding CIP tanks featuring mixers and heaters if nec-essary [5]. Different types of chemical agents are required depending on the type of fouling encountered.
A summary of the chemicals required as a function of the fouling present has been adapted from Shammas and Wang [13] and is provided in Table 1.1 for ref-erence. In addition to these generic chemicals, more effective proprietary chemical cleaning formulations are offered by RO membrane suppliers based on experimenta-tion and research with their products [5]. More comprehensive reviews of membrane chemical cleaning have been presented by Trägårdh [11], Porcelli and Judd [14], and Vedavyasan [15] to name a few, and the reader is referred there for more details.
Of particular interest is the sequence of events occurring during CIP. The process begins by flushing the RO trains, followed by membrane disinfection and removal of calcium or iron using chemicals such as sodium bisulfide (SBS) [5]. From there, low and high pH cleanings are performed beginning with a high velocity circulation phase to encourage scouring. The circulation phase may be performed at elevated temperature if desired [13].
Following the circulation phase, the cleaning procedure enters a prolonged soak phase to allow for the chemicals to interact with the foulants. Once the soak phase is complete, the cleaning procedure involves another flushing phase focused on elimi-nating all traces of the chemicals introduced. This process is repeated multiple times using different chemical agents until the various forms of fouling present in the system have been targeted [13].
phase to ensure the membrane performs up to specifications. Waste streams generated as part of the CIP process are then handled separately [5]. Combined, the series of activities required as part of CIP are labor intensive and contribute to considerable costs and system shutdowns often lasting hours.
As evident, the CIP process presents considerable limitations impeding the pro-ductivity and profitability of plants in practice while raising safety and environmental concerns. Accordingly, any feasible chemical-free alternative eliminating (or even re-ducing) the reliance on chemicals and associated shutdown time and cost would be highly desirable and set to benefit from a considerable competitive advantage relative to incumbent technology.
Table 1.1: Chemicals employed in CIP as a function of type of foulant type [11, 13, 15]
Type of chemical Foulant type Examples
Acids Inorganic fouling 1. Hydrochloric acid (HCl)
2. Citric acid
Bases Organic fouling 1. Sodium hydroxide (NaOH)
2. Potassium hydroxide (KOH)
Surfactants 1. Organic fouling
2. Inert foulants
Sodium dodecyl sulfate (SDS)
Oxidants & disinfectants
1. Biofouling 2. Organic fouling
1. Hydrogen peroxide (H2O2) 2. Sodium hypochlorite (NaOCl) 3. Chlorine (Cl2)
1.4
Chemical-free Membrane Fouling Mitigation
Figure 1-1 provides an overview of the layout and operation of a typical desalination plant. Feed water is collected through a seawater intake channel. From there, the feed water undergoes pretreatment before being transported to the RO trains. In RO, the salty water is processed to produce freshwater. The permeate undergoes
post-treatment and is stored in dedicated tanks, while the resulting brine is rejected or processed independently in another stage downstream. Post-treatment units are dedicated to disinfection and remineralization of the product water.
For a typical desalination plant, two primary options exist to mitigate fouling. The first involves pretreatment of the feed stream using a combination of processes that include: (a) screening, (b) feed water conditioning with biocides, scale inhibitors, coagulation and flocculation for example, (c) sedimentation, (d) dissolved air flotation, (e) granular media filtration, and (f) membrane pretreatment [5]. Feed pretreatment is a more proactive approach whose objective is to eliminate potential foulants before reaching the RO system to ensure its consistent and effective performance.
Figure 1-1: Layout and operation of a typical desalination plant: To mitigate fouling, a desalination plant employs a combination of pretreatment (proactive fouling mit-igation) and membrane cleaning (reactive fouling mitmit-igation). Both are important elements of an effective fouling mitigation strategy in desalination.
Regardless of its effectiveness, nonetheless, no pretreatment procedure can per-fectly eliminate all foulants. Consequently, RO membranes will eventually experience fouling and require cleaning [16]. Membrane cleaning represents a more reactive ap-proach to the challenge. While existing cleaning technology is primarily chemical in nature, research interest in chemical-free alternatives has been on the rise.
Un-like chemical cleaning, chemical-free methods may be applied continuously without system downtime or chemical waste, and are comparatively cheaper.
Chemical-free or physical cleaning involves the introduction of mechanical forces that disrupt the foulant layer and ultimately facilitate its detachment. Such clean-ing or antifoulclean-ing mechanisms in desalination range from osmotically-induced and vibration-assisted cleaning to membrane pretreatment and scouring methods, such as aeration of the feed flow or addition of solid granular particles [17, 18, 19]. This thesis seeks to investigate the viability of osmotically-induced cleaning (OIC) and deformation-induced cleaning (DIC) as potential chemical-free alternatives to chemi-cal methods. To that end, Sections 1.4.1–1.4.2 aim to provide a more detailed overview of osmotically-induced and vibration-assisted cleaning before transitioning to mem-brane pretreatment in Section 1.4.3.
Despite the extensive literature published on membrane fouling, little is under-stood about the mechanisms underlying foulant layer detachment and membrane cleaning mechanisms [20]. Studies in the literature have primarily been channeled into the application of membrane cleaning and its impact on system productivity. Little has been devoted to developing a more fundamental understanding of the in-teractions at play in cleaning. Such an understanding, however, remains pivotal for chemical-free cleaning to become competitive and widely implemented.
1.4.1
Osmotically-induced Cleaning (OIC)
Osmotically-induced cleaning (OIC) refers to the process through which a membrane is effectively backwashed “osmotically”. In this process, the net driving pressure (NDP) is controlled such that the osmotic pressure difference across the membrane becomes the dominant driving force. Water is thus transported by osmosis from the purer permeate side to the more concentrated feed side, causing the foulant layer to experience a variety of mechanisms that potentially encourage detachment as de-scribed later in Chapter 3.
Liberman and Liberman [21, 22], first coining the term Direct Osmosis cleaning by the High Salinity Solution (DO-HS), proposed such an approach as an
environ-mentally friendly on-line cleaning technique, running at low-cost and not requiring system downtime. In their approach, a highly saline solution is injected periodically into the feed stream, bringing about a flux reversal and effectively inducing permeate backwash across the membranes.
To assess the viability of the approach, pilot studies on two brackish water RO (BWRO) plants were conducted without CIP cleaning [21]. Using direct osmosis cleaning, the authors reported considerable reduction in pressure drop and improved permeate quality, attributing their success to four key effects brought by DO-HS (fouling lifting, fouling sweeping, bio-osmotic shock, and salt dissolve shock). In fouling lifting and sweeping, the induced permeate backwash lifts off the foulants, which are subsequently swept away by the increasing feed flow velocity (associated with the backwash). Through bio-osmotic shock and salt dissolve shock, furthermore, the authors asserted the high conductivity and osmotic pressure of the HS feed could also lead to improved biofouling and scaling resistance.
Building on this work, Qin et al. [23] applied DO-HS to backwashing RO mem-branes on a UF-RO pilot system treating municipal secondary effluent. Aimed at validating earlier hypotheses surrounding the operation of DO-HS and optimizing its performance, the study explored the effect of different operating conditions, such as the feed flow rate and HS injection time, on HS consumption, maximum brine con-ductivity, and maximum membrane backwash. During operation, the concentration of the HS employed varied between100 − 136g/kg, permeate pressure was kept under 6 bars, and an HS injection time of 25s was reported to be optimal.
Similarly, Sagiv and Semiat [24] investigated osmotic backwash on a spiral-wound RO module by lowering the operating pressure below its osmotic counterpart to ini-tiate cleaning. The module was fouled through introducing a supersaturated CaCO3 solution, encouraging salt precipitation. Experiments were run to uncover the effects of different operating conditions on the backwash water transported during cleaning, and a simple model was proposed to simulate the process. In this work, the authors demonstrated the effectiveness of the approach against scaling before hardening of the scale took place.
According to Sagiv and Semiat [24], the osmotic backwash procedure may be divided into two distinct regions: (1) a region characterized by a high flow rate of backwash water sustained by the high osmotic pressure of the concentration polariza-tion (CP) layer, and (2) a region characterized by the diffusion of water and effective dilution of the feed stream away from the CP layer. Despite the anticipated improve-ment at higher salinities, furthermore, a following work by Avraham et al. [25] showed that the volume of backwash water actually improves to a point before deteriorating again at very high salinities. The authors attributed the observation to secondary CP occurring on the permeate side of the membrane at these salinities.
Later work by Liberman [26] presented three methods through which osmotic backwashing can be implemented for membrane cleaning in desalination. The first method, direct osmosis cleaning (DOC), involves raising the permeate pressure to match that of the feed, such that the osmotic pressure difference dictates the direction of water transport (as opposed to direct HS injection). In direct osmosis high salinity (DOHS) cleaning, a high salinity brine, acting now as a draw solution, is introduced on the feed side to encourage osmotic backwashing. The third method, pulse flow forward osmosis (PFRO) cleaning, combines the previous two methods in a cyclical RO process that alternates between dead-end and cross-flow filtration modes.
Recent experiments by Tow et al. [27] demonstrate the mechanism underlying OIC and visually capture the foulant layer detachment and cleaning procedure as they occur in situ. In these experiments, sodium alginate was introduced as a model organic foulant at a concentration of 200 mg/L along with 1 mM calcium chloride to initiate fouling. Having a molar mass of 80,000–120,000 g/mol, sodium alginate is polysaccharide whose polymer chains crosslink in the presence of divalent ions, such as calcium, when undergoing gelation [28]. The result is a hydrogel forming on the membrane surface. Experiments by Tow et al. [27] capture the hydrogel wrinkling as it undergoes swelling before it eventually detaches from the membrane surface.
While such works underscore the promise of OIC, there remains a dearth of in-formation surrounding the mechanisms involved, practical implementation, process optimization, as well as speed and efficacy compared to traditional methods. The
osmotically-induced detachment mechanism, for example, could vary with the adhe-sion level between the membrane and foulant. A deeper understanding of the adheadhe-sion level at play is necessary for implementation and optimization of the cleaning pro-cess. Furthermore, devising a procedure, building on previous observations by Tow et al. [27], to “accelerate the foulant swelling” could allow the method to become more viable. Other areas requiring further investigation include the effect of spacers and efficacy against biofilms in addition to the frequency and duration of cleaning required.
1.4.2
Vibration-assisted Membrane Cleaning
In addition to OIC, recent results reported by Levering et al. [29] and Shivapooja et al. [30, 31] indicate that controlled dynamic stresses resulting from surface deforma-tion can be effective at detaching biofilms. These studies, while promising, did not investigate their applicability to membranes in desalination systems where the flow and operating conditions are different.
The desalination company IDE has similarly claimed “pulsed water strokes”, trig-gering membrane directional movement or shaking, to be effective at detaching foulants [32]. Very little, however, has been disclosed by the company as to how their cleaning approach works or how membrane vibration is triggered. Specifically, the mechanisms at play remain poorly understood as well as the cleaning effectiveness relative to OIC or traditional cleaning.
Other studies in the literature have looked into employing vibration as a potential means of membrane fouling mitigation [33, 34, 35, 36]. In these works, various meth-ods of vibration, ranging from purely mechanical vibration featuring linear/rotational motion [36] to piezoelectrically [34, 37] and magnetically-induced membrane vibration [35, 38], have been reported. Several of these studies, nonetheless, have either limited their scope to commercially existing designs not applicable in desalination, such as VSEP [33, 39, 40], or mechanical means of vibration not practical in a desalination context [36]. Others have solely focused on non-desalination applications or bench-scale experiments with no consideration for large-bench-scale deployment on existing RO
systems at desalination plants [34, 35].
Another interesting development has been the use of vibration coupled with hol-low fiber membrane modules. Work in the literature explored both transverse [41] and vertical modes [42, 43] of fiber vibration, noting the potential of these methods at mitigating fouling. Despite this potential, however, most commercial RO mod-ules, being spiral-wound in configuration, are not set to benefit directly from such developments.
In search of alternatives, other work has investigated the development of spacer vibration as a turbulence promoter for fouling control and mitigation. Specifically, Wu et al. [44] developed spacers, manufactured using 3-D printing in 1-D, 2-D, and 3-D configurations, that are connected to a motor imposing spacer vibration paral-lel to the membrane surface. Their work, followed by the work of Tan et al. [45], demonstrated the feasibility of the approach in principle using microfiltration mem-branes. Nonetheless, applicability to commercial RO membranes, and in particular the spiral-wound configuration, remains to be proven.
Combined, these studies underscore the need for a more careful investigation of chemical-free or physical cleaning to uncover the mechanisms involved and ultimately optimize the process. Experiments should be designed to verify if the observed clean-ing is a result of shear force interactions between the flow and the membrane or dynamic stresses experienced due to membrane vibration, deformation, or possibly resonance. In these experiments, the effects of osmotic backwashing should also be controlled or kept to a minimum. Most importantly, however, experiments should be run to demonstrate applicability to commercial modules, which are primarily spiral-wound modules presenting a very different flow configuration.
1.4.3
Nanofiltration Pretreatment for Desalination
Pretreat-ment
In addition to physical membrane cleaning, membrane pretreatment presents yet an-other chemical-free antifouling strategy to control and mitigate membrane fouling.
By eliminating potential foulants in the feed, membrane pretreatment allows down-stream RO units to recover more permeate, generate less brine, and operate more efficiently. Given its selective rejection for divalent ions, nanofiltration (NF), a tech-nology using membranes with pore sizes on the order of 1 nanometer that are more permeable than conventional RO membranes, has emerged as a viable pretreatment membrane technology to eliminate scaling in downstream RO and lower desalination’s environmental footprint [46, 47, 48].
Nanofiltration can allow lower pressure operation and greater water recovery, re-sulting in less energy consumption and less brine to be discharged, mitigating RO’s impact on the marine environment [49]. Research by Vuong et al. [50, 51], for ex-ample, has demonstrated that a dual stage NF system consumed 20–30% less energy than conventional RO, while other efforts by the Saline Water Conversion Corpora-tion (SWCC) [52, 53] have shown that NF pretreatment to RO can reduce the cost by 30% and increase recovery by up to 60%.
While promising, adoption of NF pretreatment has been impeded by the lack of effective commercial membranes designed for this application. Recent work has demonstrated the potential of novel low-pressure NF hollow fiber membranes, fab-ricated via layer-by-layer (LbL) deposition, in softening seawater, outperforming al-ternative membranes available commercially [54, 55, 56]. Further research, however, is still required in light of the need for a systematic framework that can guide the rational design of new membranes for this application.
1.5
Thesis Research Objectives
This thesis seeks to further the development of chemical-free methods of fouling mit-igation for membrane processes in desalination. The significance of the research is primarily three-fold: (1) to study the fouling process and contribute a more fundamen-tal understanding of the mechanisms underlying foulant detachment; (2) to evaluate the feasibility as well as the merits and limits of various fouling mitigation strategies; and (3) to pave the way for an optimized high-efficiency chemical-free cleaning
strat-egy for RO membranes in desalination.The contributions presented target both areas of fouling mitigation, pretreatment and membrane cleaning.
To that end, an approach to accelerate the development of effective low-pressure nanofiltration (NF) membranes for desalination pretreatment and softening appli-cations is presented. Additionally, the effectiveness of osmotically-induced cleaning (OIC) against organic fouling in reverse osmosis (RO) desalination in the presence of spacers is reexamined to address the conflicting reports in the literature. Motivated by the practical limitations of OIC, the development of deformation-induced cleaning (DIC), a new chemical-free membrane cleaning method, is finally presented.
1.5.1
Approach
Nanofiltration Pretreatment
While NF pretreatment has the potential to improve desalination performance, the lack of commercial membranes targeted for this application, underscored by the rela-tively poor performance of existing membranes, has impeded its adoption in practice. A major obstacle to the development of effective low-pressure NF membranes has been the lack of a systematic framework to guide the rational design of membranes.
In Chapter 2, an approach, through which transport modeling is employed in fab-ricating a specialized membrane with desired physical characteristics, is presented. Specifically, the Donnan-Steric Pore Model with dielectric exclusion (DSPM-DE) is used in probing for membrane properties desirable in desalination pretreatment. Nanofiltration membranes are systematically fabricated using layer-by-layer (LbL) deposition to validate model predictions and develop a new specialized membrane for the application. The new membrane presents a 30% increase in permeability and 50% reduction in hardness relative to state-of-the-art NF membranes.
Osmotically-induced cleaning (OIC)
As no pretreatment stage can completely eliminate all foulants in the feed, membrane fouling remains a central challenge in desalination. To counteract the effects of
foul-ing, desalination plant operators ultimately resort to chemical cleanfoul-ing, which incurs system downtime, risk of membrane damage, and the generation of chemical waste. Driven by these limitations, chemical-free cleaning has emerged as a potential alterna-tive. Recent works have demonstrated the viability of osmotically-induced cleaning (OIC), where a membrane effectively undergoes osmotic backwashing. In light of conflicting reports, however, a deeper analysis and understanding of the underlying mechanisms involved is necessary.
In Chapter 3, the effectiveness of OIC is examined, underlying mechanisms are elu-cidated, and potential applicability in the presence of spacers is investigated. Sodium alginate is adopted as a model organic foulant and commercial RO membranes are operated to emulate fouling conditions in practice. Video footage is presented to document the cleaning procedure and refine our understanding, while important ob-servations are noted.
Experimental results demonstrate effective cleaning (primarily in the absence of spacers), demonstrating a flux recovery of 10-30% depending on experimental con-ditions, while membrane integrity is preserved. To investigate the effect of OIC on biofilms, a real biofilm of Cobetia marina is exposed to solutions of higher salinity. The results indicate that while exposure to higher salinities does impact the biofilm spread and bacterial count, the method is far from completely eliminating the biofilm or preventing its regrowth once operation is resumed.
Deformation-induced cleaning (DIC)
Experimental results in Chapter 3 demonstrate the lower effectiveness of OIC in the presence of spacers, which are integral components of virtually all commercial spiral-wound RO membrane modules. Consequently, Chapters 4–5 seek to present a novel chemical-free membrane cleaning method applicable to commercially existing spiral-wound membrane modules. The method employs controlled membrane deformation through pressure modulation, which induces shear stresses at the foulant-membrane interface that lead to detachment and removal of the foulants.
by alginate are conducted on a flat-sheet membrane coupon followed by tests on a commercial spiral-wound module with feeds of varying fouling propensities. Cleaning durations are approximately six-fold lower, and the experimental results demonstrate flux recoveries and cleaning efficiencies comparable to those of chemical cleaning. The experiments on the spiral-wound module indicate that this method will have applicability in industrially-relevant settings. To elucidate the underlying cleaning mechanisms, in situ visualization techniques are employed for both the flat-sheet and spiral-wound modules. By enabling more frequent cleanings, deformation-induced cleaning (DIC) considerably lowers operating costs while offering a more sustainable and environmentally sound solution to membrane cleaning and antifouling in desali-nation.
Chapter 2
Relating Transport Modeling to
Nanofiltration Membrane Fabrication
for Desalination Pretreatment
This chapter is based on a paper by Labban et al. [57].
2.1
Introduction
Since the twentieth century, advances in membrane technology have been at the forefront of engineering innovations shaping humanity’s standard of living worldwide [58]. From medical applications such as drug delivery and tissue engineering [59] to industrial applications, ranging from gas separation [60] and water purification [61] to humidity harvesting and dehumidification [62], the importance of membranes to achieving chemical separation or moderated chemical transport cannot be overstated. With great progress, however, came greater challenges to achieving high perme-ability without sacrificing selectivity as evident from the Robeson limit encountered in gas separation [63, 64] and the permeability-selectivity trade-off commonly reported in the desalination literature [65, 66, 67]. Ensuring optimal performance necessi-tates developing membranes that are tailored toward a given application. Systematic design of such membranes, however, requires a framework that relates the physical
properties of membranes to their rejection characteristics.
The challenge is epitomized in desalination, where the drive for higher selectiv-ity [66, 68, 69], as well as improved ion selectivselectiv-ity in pretreatment [54], is pivotal in tackling water scarcity, a global crisis among the most pressing of our time [1]. Standing as the most energy efficient desalination technology [70], reverse osmosis (RO) is plagued by inorganic fouling, for example, caused by hardness common to sea water and brackish waters [71].
Nanofiltration (NF) appears to offer a potential solution to hardness-related foul-ing, owing to its selective rejection of divalent ions relative to monovalent ions. In a work geared towards assessing the potential of NF in desalination pretreatment, Kaya et al. [47] experimentally evaluated the performance of different NF-RO con-figurations relative to single-stage RO, demonstrating improved permeate recovery as well as reduced RO scaling once NF was employed. Similarly, Macedonioa et al. [72] quantitatively demonstrated, using energetic and exergetic arguments, that NF pretreatment can lower the energy consumption of desalination. These works, as well as others [73, 74, 75], underscore the potential of NF in desalination pretreatment. In the absence of commercial NF membranes specialized for this application, however, the benefits of NF pretreatment for RO feed water are expected to remain marginal. In search of membranes better suited for the task, Fang et al. [76] pointed out that most commercial NF membranes are fabricated via the interfacial polymerization of piperazine (PIP) and trimesoyl chloride (TMC), leading to a negative surface charge that renders them ineffective at water softening. Setting the stage for a series of developments later in the field, Fang et al. [76] reported instead the fabrication of a novel low-pressure NF membrane by replacing PIP with branched polyethyleneimine (PEI), bringing about a more positive surface charge. The membrane demonstrated a unique softening capacity when operated at low pressure (2 bar), outperforming commercial competitors investigated at the time [76].
The study was followed by another by Liu et al. [77], who reported the fabrication of an alternative low-pressure NF membrane for water softening by semi-dynamic layer-by-layer (LbL) polyelectrolyte deposition. The membrane, fabricated by the
deposition of poly(styrene sulfonate) or ‘PSS’ and poly(allylamine hydrochloride) or ‘PAH’, consistently outperformed that of Fang et al. [76] from a hardness removal standpoint, although suffering in the presence of sulfate in the feed.
In response, Liu et al. [55] later introduced chemical crosslinking by glutaraldehyde (GA), producing a tighter membrane (LbL1.5C) that outperformed the preceding LbL membrane on both permeability and selectivity fronts, rejecting 80-100% of divalent ions with near-zero rejection of sodium ions in the feed. Such iterative efforts, among others [78], show the need for a systematic approach to guide membrane fabrication. The challenge is best summed in the words of a review on membrane fabrication by Laila et al. [79]: despite the existence of extensive knowledge on ‘tailoring’ membrane properties, a deeper understanding linking membrane properties to performance is crucial to the future progress of membrane technology in desalination — and arguably other fields.
With research on the solution-diffusion and pore-flow models dating back to the twentieth century [80, 81, 82], modeling chemical transport across membranes is as well established as the field of membrane technology. For decades, such efforts have primarily been channeled into understanding what mechanisms govern membrane transport [83, 84], predicting membrane performance [85], or designing large-scale membrane systems [86, 87, 56]. Less attention has been devoted to understanding how transport modeling can guide the fabrication of better membranes in light of two main limitations: (1) the lack of a ‘sufficiently detailed’ model relating membrane performance to its properties on the one hand; and (2) the need for an interdisciplinary effort spanning the distinct fields of membrane fabrication and transport modeling on the other hand. The need for a combined approach has become more evident as research heads in the direction of tailoring membranes for specific applications, as evident from other recent publications [67, 88, 89].
By coupling transport modeling to membrane fabrication, the present chapter takes an interdisciplinary approach toward a systematic framework, to our knowledge the first, that addresses this need. Desalination pretreatment by NF is chosen as the application of interest, with the objective of demonstrating the framework in the
context of developing a specialized NF membrane for this application. Building on the preceding literature, the well-established Donnan-Steric Pore Model with dielec-tric exclusion (DSPM-DE), as presented by Geraldes and Alves [85], is adopted along with the LbL polyelectrolyte deposition [90] as our modeling and membrane mod-ification tools of choice. With the LbL1.5C [55] serving as a benchmark, desirable membrane properties are probed by sensitivity analysis and experimentally validated by systematically fabricated membranes. Showing that a specialized membrane can enhance both permeability and ion selectivity, the work culminates in the develop-ment of a superior low-pressure membrane (LbL3) for desalination pretreatdevelop-ment, and demonstrates that transport modeling could systematically be employed to benefit membrane fabrication in the lab.
2.2
Theoretical Background
To relate modeling and fabrication, a ‘sufficiently detailed’ transport model should be adopted as a first step. The Donnan-Steric Pore Model with dielectric exclusion (DSPM-DE), used in nanofiltration and adopted herein, offers a more comprehensive treatment of membranes than other models (such as the Spiegler-Kedem model), characterizing them in terms of different properties, including the pore size, thickness, porosity, charge, and pore dielectric constant. Employing such a model is important as it offers a clearer understanding of the effect varying a fabrication procedure could have on membrane properties and performance later on.
This section begins with a brief overview of the DSPM-DE model and its governing equations. The limitations model calibration have traditionally imposed on modeling are then discussed, along with the exciting prospects that fitting parameters could offer when treated as design parameters to guide membrane fabrication. Thereafter, more formal definitions of ‘specialized performance’ and ‘low-pressure operation’ are laid out. With clear definitions, the section turns to assessing the merits and limits of different approaches to uncovering desirable membrane properties through modeling, and concludes by adopting sensitivity analysis as the approach of choice.
2.2.1
Governing equations of NF
Modeling transport across NF membranes is generally a three-step process that con-siders: solute transport within the active layer, concentration polarization, and solute partitioning at electrochemical equilibrium [54]. Figure 2-1 provides an illustration of a typical NF membrane in operation. Within the active layer, solute transport is gov-erned by the extended Nernst-Planck equation, describing transport due to diffusion, convection, and electromigration [91]:
𝐽𝑖 = −𝐷𝑖,𝑝 𝑑𝑐𝑖 𝑑𝑥 + 𝐾𝑖,𝑐𝑐𝑖𝐽𝑣− 𝑧𝑖𝑐𝑖𝐷𝑖,𝑝𝐹 𝑅𝑇 𝑑𝜓 𝑑𝑥 (2.1) 𝐷𝑖,𝑝 = 𝐾𝑖,𝑑𝐷𝑖,∞ (2.2)
with 𝐽𝑖 being the flux of the 𝑖th solute, 𝐷𝑖,𝑝 and 𝐷𝑖,∞ its diffusion coefficient in the pore and the bulk solution, 𝑐𝑖 its concentration, 𝑧𝑖 its valency, 𝐽𝑣 the permeate flux, and 𝜓 the electric potential. 𝐹 refers to the Faraday constant, 𝑅 to the universal gas constant, and 𝑇 to the temperature. Equation 2.1 indicates that transport occurs by virtue of the porosity of NF membranes, or down a gradient in concentration or electrical potential.
With length scales approaching those of atomic dimensions, solute mobility in the confining pores of NF membranes is restricted, the apparent rates of diffusion and convection are greatly reduced, and solute transport is said to be ‘hindered’ [92]. To account for hindered transport, the hindrance factors for diffusion 𝐾𝑖,𝑑 and convection 𝐾𝑖,𝑐 are introduced as shown in Eqs. 2.1-2.2.
Hindrance factors are calculated in relation to 𝜆𝑖, the ratio of the solute’s Stokes radius to the pore size. Dechadilok and Deen reported the diffusion hindrance factor may be calculated for 𝜆𝑖 ≤ 0.95 according to the relationship [93]:
𝐾𝑖,𝑑 = 1.0 + (9/8)𝜆𝑖ln(𝜆𝑖) − 1.56034𝜆𝑖+ 0.528155𝜆2𝑖 + 1.91521𝜆 3 𝑖 − 2.81903𝜆4 𝑖 + 0.270788𝜆 5 𝑖 − 1.10115𝜆 6 𝑖 − 0.435933𝜆 7 𝑖 (1 − 𝜆𝑖)2 (2.3)
For 𝜆𝑖 > 0.95, on the other hand, Mavrovouniotis and Brenner introduced the rela-tionship [94]: 𝐾𝑖,𝑑 = 0.984 (︂ 1 − 𝜆𝑖 𝜆𝑖 )︂5/2 (2.4) Likewise, the convection hindrance factor is determined from the result reported ear-lier by Ennis et al. [95]:
𝐾𝑖,𝑐 =
1 + 3.867𝜆𝑖− 1.907𝜆2𝑖 − 0.834𝜆3𝑖 1 + 1.867𝜆𝑖 − 0.741𝜆2𝑖
(2.5)
In addition to satisfying the extended Nernst-Planck equation, an electroneutrality condition, accounting for the membrane effective charge 𝑋𝑑, should also be satisfied within the active layer [85]:
𝑋𝑑+ 𝑁 ∑︁
𝑖=1
𝑧𝑖𝑐𝑖 = 0 (2.6)
Two more electroneutrality constraints, given by Eqs. 2.7-2.8, also need to be satisfied at the feed/membrane interface and in the permeate solution [85]:
𝑁 ∑︁ 𝑖=1 𝑧𝑖𝑐𝑖,𝑚 = 0 (2.7) 𝑁 ∑︁ 𝑖=1 𝑧𝑖𝑐𝑖,𝑝 = 0 (2.8)
Apart from modeling transport within the active layer, concentration gradients tend to form across membrane interfaces as feed constituents permeate at differing rates (Fig. 2-1). This phenomenon, commonly referred to as concentration polariza-tion (CP), impacts the permeate flux and quality, and should be considered. Following the model presented by Geraldes and Afonso, the solute flux across the CP layer at the feed/membrane interface can be expressed as the sum of fluxes due to back-diffusion, electromigration, and convection [96]:
𝐽𝑖 = −𝑘∙𝑐,𝑖(𝑐𝑖,𝑤− 𝑐𝑖,𝑏) + 𝐽𝑣𝑐𝑖,𝑤− 𝑧𝑖𝑐𝑖,𝑤𝐷𝑖,∞ 𝐹
Progress Report 4 - Picking up
Omar Labban March 25, 2015
1 Questions Posed Last Presentation
This section aims at summarizing and answering the questions raised during the group pre-sentation on Friday, 16th of January, 2015.
1.1 A Note on Dielectric Exclusion (DE)
1.1.1 Background
The dielectric constant, or relative permittivity, of a material mis defined as the ratio of the material’s permittivity to that of vacuum. Permittivity, on the other hand, is a measure of a material’s ability to polarize in the presence of an electric field. A material with a higher dielectric constant polarizes more in the presence of a field, reducing the field’s overall effectiveness.
m= o
(1)
ci,w (2)
1
Progress Report 4 - Picking up
OmarMarch 25, 2015
1
Questions Posed Last Presentation
ci,N (1)
1
Progress Report 4 - Picking up
Omar March 25, 2015
1 Questions Posed Last Presentation
ci,1 (1)
1
Progress Report 4 - Picking up
Omar March 25, 2015
1 Questions Posed Last Presentation
ci,2 (1)
1
Progress Report 4 - Picking up
Omar March 25, 2015
1
Questions Posed Last Presentation
ci,3 (1)
1
Progress Report 4 - Picking up
Omar March 25, 2015
1
Questions Posed Last Presentation
ci,p (1) 1 Feed Permeate Support Layer Active Layer
P
ro
g
re
ss
R
e
p
o
rt
4
-P
ic
ki
n
g
u
p
Omar M arc h 25 , 20151
Qu
e
st
io
n
s
P
o
se
d
Last
P
re
se
n
tat
io
n
x (1) 1P
ro
g
re
ss
R
e
p
o
rt
4
-P
ic
ki
n
g
u
p
Omar M arc h 25 , 20151
Qu
e
st
io
n
s
P
o
se
d
Last
P
re
se
n
tat
io
n
c (1) 1Progress Report 4 - Picking up
Omar March 25, 2015
1
Questions Posed Last Presentation
δx (1) 1
Progress
Report
4 - Picki
ng up
Omar March 25, 2015 (1) 1Figure 2-1: Modeling chemical transport through a NF membrane: The variables 𝑐𝑖,1 and 𝑐𝑖,𝑁, appearing in the figure, match the variables 𝑐𝑖,𝑤′ and 𝑐𝑖,𝑝′ introduced in this work [97].
Here, the mass transfer coefficient is denoted as 𝑘∙𝑐,𝑖, 𝑐𝑖,𝑏 and 𝑐𝑖,𝑤 are the solute concentration in the bulk solution and at the membrane wall/feed interface (just outside the pores), and 𝜉 refers to the gradient of electric potential at the interface. Calculating the mass transfer coefficient 𝑘𝑐,𝑖∙ requires accounting for the ‘suction-effect’ associated with membrane permeation by introducing a flux-dependent correction factor Ξ as shown [96]:
𝑘𝑐,𝑖∙ = 𝑘𝑐,𝑖Ξ (2.10)
Ξ = 𝜑𝑖+ (1 + 0.26𝜑1.4𝑖 ) −1.7
(2.11) where the coefficient 𝑘𝑐,𝑖 is determined from conventional correlations for the Sher-wood number, and 𝜑𝑖 = 𝐽𝑣/𝑘𝑐,𝑖. Since this work employed hollow fiber membrane coupons in experiments, a Sherwood number correlation derived for fully-developed laminar flow (with developing concentration profile) in a tubular geometry was adopted [98]:
where Sh𝑖 is the solute Sherwood number, Sc𝑖 is its Schmidt number, Re is the flow Reynolds number defined below, and 𝑑i and 𝐿 are the fiber’s inside diameter and length. Sh𝑖 = 𝑘𝑐,𝑖𝑑i 𝐷𝑖,∞ (2.13) Sc𝑖 = 𝜇 𝜌𝐷𝑖,∞ (2.14) Re = 𝜌𝑉 𝑑i 𝜇 (2.15)
This model neglects concentration polarization on the membrane/permeate interface, a reasonable assumption for processes featuring bulk flow through a salt-rejecting membrane [58]. At steady state, the solute flux should also satisfy the conservation equation:
𝐽𝑖 = 𝐽𝑣𝑐𝑖,𝑝 (2.16)
The final step in modeling solute transport involves accounting for the solute partitioning that occurs at electrochemical equilibrium. Setting the electrochemical potential equal across both sides of a membrane interface yields two relationships, which act as boundary conditions at the feed/membrane and membrane/permeate interfaces [85]: 𝛾𝑖,𝑤′𝑐𝑖,𝑤′ (𝛾𝑖,𝑤𝑐𝑖,𝑤) = Φ𝑖Φ𝐵exp (︂ − 𝑧𝑖𝐹 𝑅𝑇∆𝜓𝐷,𝑤 )︂ (2.17) 𝛾𝑖,𝑝′𝑐𝑖,𝑝′ (𝛾𝑖,𝑝𝑐𝑖,𝑝) = Φ𝑖Φ𝐵exp (︂ − 𝑧𝑖𝐹 𝑅𝑇∆𝜓𝐷,𝑝 )︂ (2.18) These relationships describe solute partitioning as it occurs due to sieving (or size) effects, Donnan partitioning, and dielectric exclusion, all of which are important to membrane performance. In these equations, 𝛾𝑖 is the solute activity coefficient, Φ𝑖 the steric partitioning coefficient, and Φ𝐵 the Born solvation coefficient. The primed subscripts 𝑤′ and 𝑝′ here are used to denote the condition on the feed and permeate sides (just inside the membrane pores depicted in Fig. 2-1).
To calculate the solute activity coefficient in Eqs. 2.17-2.18, the Davies model has been adopted herein such that the activity coefficient is calculated as a function of
ionic strength, 𝐼, following the semi-empirical expression [99, 100]: ln(𝛾𝑖) = −𝐴𝑧𝑖2 (︂ √ 𝐼 1 +√𝐼 − 𝑏𝐼 )︂ (2.19) 𝐼 = 1 2 𝑁 ∑︁ 𝑖=1 𝑧𝑖2𝑐𝑖 (2.20)
where 𝑏 is taken to be 0.3. In Eq. 2.19, 𝐴 refers to the Debye–Hückel constant defined as [100, 101]: 𝐴= (︂√ 2𝜋𝑁𝐴 ln(10) )︂(︂ 𝑒2 4𝜋𝜀0𝜀𝑟𝑘𝑇 )︂3/2 (2.21) Here, Avogadro’s number is denoted by 𝑁𝐴, the elementary charge by 𝑒, the Boltz-mann constant by 𝑘, and the relative permittivity and permittivity of vacuum by 𝜀𝑟 and 𝜀0.
The steric partitioning coefficient, Φ𝑖, is usually introduced to account for size exclusion as it occurs in relation to the finite size of the solute relative to the pore size, quantified by the ratio 𝜆𝑖 [102]:
Φ𝑖 = (1 − 𝜆𝑖)2 (2.22)
The Born solvation coefficient, on the other hand, accounts for dielectric exclusion and is responsible for the energy barrier to solvation ions are likely to encounter as a result of the drop in the solvent dielectric constant in the pores relative to the bulk. This phenomenon is supported by evidence from studies in electrochemistry and colloidal systems [83], and is predicted by Born model [103, 104]:
Φ𝐵 = exp (︂ −∆𝑊𝑖 𝑘𝑇 )︂ (2.23) ∆𝑊𝑖 = 𝑧𝑖2𝑒2 8𝜋𝜀0𝑟𝑖 (︂ 1 𝜀𝑝 − 1 𝜀𝑏 )︂ (2.24) where the Born solvation energy barrier is denoted by∆𝑊𝑖, and the dielectric constant in the pore and the bulk by 𝜀𝑝 and 𝜀𝑏.
With these three steps accomplished, the membrane active layer is then discretized in the thickness direction as shown in Fig. 2-1, such that one extended Nernst-Planck equation is applied at every discretization point. The resulting system of equations is coupled to the boundary conditions (dictated by electrochemical equilibrium), elec-troneutrality conditions, and CP layer equations to numerically solve for the concen-tration profile. Our modeling approach is in tandem with that of Geraldes and Alves [85], and the reader is referred to another publication [54] for more details.
2.2.2
Fitting parameters: The limitation of traditional NF
modeling
Developed over two decades, the DSPM-DE model adopted herein is well-established and has been extensively validated in the literature [85, 103, 105], and its applicability to the novel class of NF membranes developed by Liu et al. [55] has been demonstrated experimentally in a recent work [54]. Despite its great success, the need for calibration (or membrane characterization) has generally presented a limitation as evident from a study by Bowen and Mohammad [106], for example, solely dedicated to this purpose. Estimating a membrane’s effective pore size, thickness, charge density, and dielectric constant through an expensive experimental protocol is always a requirement before any meaningful insights could be gleaned.
In this work, nonetheless, we pose the problem differently, looking at the model through the lens of a membrane designer. From a modeling standpoint, the perfor-mance of any membrane should be dictated by the four fitting parameters mentioned. Accordingly, the fitting parameter space can now be viewed as the membrane design space. Provided its assumptions are satisfied, the model can in principle be employed to probe which membrane properties are desirable for a specific application to achieve low-pressure operation. The path to implementing such an approach systematically remains ambiguous, however, without clear definitions for ‘specialized’ performance and ‘low-pressure’ operation.
![Table 1.1: Chemicals employed in CIP as a function of type of foulant type [11, 13, 15]](https://thumb-eu.123doks.com/thumbv2/123doknet/14733485.573572/25.918.163.752.486.854/table-chemicals-employed-cip-function-type-foulant-type.webp)