Designing a Low-Cost Measurement System for
Volume Estimation
by
Erik Nguyen
Submitted to the Department of Electrical Engineering and Computer
Science
in partial fulfillment of the requirements for the degree of
Master of Engineering in Computer Science and Engineering
at the
MASSACHUSETTS INSTITUTE OF TECHNOLOGY
September 2018
c
○
Erik Nguyen, MMXVIII. All rights reserved.
The author hereby grants to MIT permission to reproduce and to
distribute publicly paper and electronic copies of this thesis document
in whole or in part in any medium now known or hereafter created.
Author . . . .
Department of Electrical Engineering and Computer Science
August 21, 2018
Certified by. . . .
Regina Barzilay
Professor
Thesis Supervisor
Accepted by . . . .
Katrina LaCurts
Chair, Master of Engineering Thesis Committee
Designing a Low-Cost Measurement System for Volume
Estimation
by
Erik Nguyen
Submitted to the Department of Electrical Engineering and Computer Science on August 21, 2018, in partial fulfillment of the
requirements for the degree of
Master of Engineering in Computer Science and Engineering
Abstract
In this thesis, I designed and implemented large parts of a low-cost 3D reconstruction system targeted at volumetric reconstruction for lymphedema diagnosis purposes. The goal is to construct a system capable of determining changes in volume of an arm. This thesis involves construction of multi-camera rigs, but focuses on the development of data processing and surface reconstruction pipelines necessary to convert camera images into 3D surface models. We show that the system is capable of measuring volumes that, though error prone, are strongly correlated with true volume, and hence can detect volume changes on the order of 20 − 30%.
Thesis Supervisor: Regina Barzilay Title: Professor
Acknowledgments
The two years I’ve devoted to this project have been incredibly humbling. Switching fields in pursuit of an ideal is terrifying. And there is no chance I could have survived this ordeal without much support from friends and family around me.
Foremost thank you Professor Barzilay. You were right — the best way to learn is to walk into the storm while knowingly unprepared and alone. The lessons I’ve learned through this project will stay with me forever. You’ve provided trust, faith, creativity, passion, and a critical and unfiltered perspective on life and academia to each and every single student in your group. And I don’t think I could ever want more from an advisor. It has been a privilege to work in your group, and I hope that one day we’ll cross paths yet again.
I’d like to thank my current and former teammates. Fernando Yordan, I don’t think I need to say much more than that we’ve made it. You did a great job migrating the infrastructure and working on the registration system. To Julian Straub and Hayley Song, thank you for the support and encouragement when I first came into this group. Your advice and friendship helped me overcome many of the hurdles I faced while trying to acclimate myself to the project. I wish I had taken more of your advice to heart, but I’ll make do with the lessons I learned by not doing so. Gabriel Ginorio, thank you for your help designing the physical rig and printing the camera mounts. Eric Chen, thank you so much for introducing me to this project.
Thanks to Adam Yala for the almost painful advice and difference in technical perspectives. If I had time or could go back, I believe many of your suggestions would have helped with registration or even general progress. Regardless our conversations were also enlightening and the opportunity to play with Arya was always appreciated. To Helen Zhou, Lara Timbo, and Vickie Ye. Thank you for the M.Eng comradery. I was able to cope with my concerns and troubles knowing I had friends with whom I could confide my woes.
Lastly, thank you to my family. My parents and siblings have always provided me with love and support, and more importantly pushed me to make sure I stayed
on track with my goals so that I could graduate. Otherwise who knows what rabbit hole I’d be trying to understand and explore.
MIT. It’s been an eventful five years. As I leave, I believe I’ve finally managed to hone in on who I am, who I aspire to be, and the problems I hope to tackle. Thanks.
Contents
1 Introduction 13
2 Related Work 15
2.1 3D Reconstruction . . . 15
2.2 Volumetric Measurement Systems for Lymphedema . . . 16
2.2.1 Water Displacement . . . 16 2.2.2 Geometric Methods . . . 16 2.2.3 Bioelectrical Impedance . . . 17 2.2.4 Perometry . . . 17 2.2.5 KinectFusion-Based . . . 17 2.2.6 Recap of Concerns . . . 18 3 System Design 21 3.1 Hardware . . . 21 3.1.1 Camera Selection . . . 21 3.1.2 Physical Rig . . . 23 3.1.3 Computer Setup . . . 26 3.1.4 Construction Cost . . . 27 3.2 Software . . . 28
3.2.1 Calibration and Registration . . . 28
3.2.2 Reconstruction . . . 30
4.1 Simulated Point Clouds . . . 39
4.2 Real-World Inputs . . . 39
4.2.1 Geometric Surfaces . . . 39
4.2.2 Anatomical Surfaces . . . 42
4.3 Analysis . . . 44
List of Figures
3-1 Intel SR300 camera . . . 22
3-2 Hardware rig for cameras . . . 24
3-3 Hardware rig with object to be imaged . . . 25
3-4 Software Pipeline Diagram . . . 27
3-5 Example calibration target pattern . . . 28
3-6 Surfaces prior to refined registration . . . 29
3-7 Winged half-edge data structure . . . 32
3-8 Mesh prior to noise removal . . . 33
3-9 Surface trimming example . . . 34
4-1 Example simulated box . . . 38
4-2 Model shapes . . . 40
4-3 Water displacement test setup . . . 41
4-4 Plots of volume vs estimates with regressions . . . 45
List of Tables
2.1 Negatives of existing volumetric estimate methods . . . 18
3.1 Depth ranges for different commodity cameras . . . 22
3.2 Resolution and frames per second (fps) for different commodity cameras 22 3.3 Construction Cost Table . . . 27
4.1 Simulated point cloud measurements . . . 37
4.2 Geometric shape dimensions after considering cutting plane locations 39 4.3 Volume measurements of geometric shapes . . . 42
4.4 Volume measurements from device of arm . . . 43
4.5 Volume measurements from water displacement of arm . . . 43
Chapter 1
Introduction
3D reconstruction has seen marked progress with the ubiquity of cheap but effective RGBD camera series like the Microsoft Kinect, Asus Xtion, and Intel RealSense. Similarly, image processing has advanced considerably due to the relatively recent availability of GPUs and the advent of programming frameworks required to harness their incredible computing power [20]. Together, these have enabled the emergence of real-time 3D reconstruction pipelines [7, 17] that work well on commodity hardware even in dynamic scenes [7]. While these technologies exist in the academic world, and to some degree as important trade-secret technologies in specific companies, they have not been adopted as quickly in important industries such as health care. Many reasons abound for the slow adaptation of new technologies to health care; from the fact that many technologies can’t be directly applied to improving a hospital patient’s wellbeing, to the issues of patient privacy that we hold paramount, to the adoption (and sometimes human) cost of new technologies [18]. These concerns highlight the importance of careful thought and design required to produce truly useful technologies in health care, but do not diminish the fact that technologies have and will continue to improve the outcomes of patients to come [2, 18]. We have focused on adapting some of the advances in 3D reconstruction for use with a specific sequela of cancer treatment known as lymphedema.
Lymphedema is an incurable condition characterized by buildup of protein-rich fluid in tissue and often leads to chronic inflammation and reactive fibrosis of the
affected tissue. This swelling is a result of damage to sections of the lymphatic system, whether by radiation, surgery, developmental abnormalities, or infection, that affect regulation of interstitial fluid. Lymphedema victims face symptoms including decreased flexibility or mobility, swelling, aching, burning, pain, and numbness, as well as damage to a victim’s body image [22]. The leading cause of lymphedema outside the United States is lymphatic filariasis, a mosquito-borne disease and the second leading cause of chronic disability world-wide [19, 25]. However in the United States, the leading cause of lymphedema is surgical removal of lymph tissue as a routine component of cancer treatment interventions [21]. While lymphedema can never be cured, the affected area can be controlled if the condition is detected early enough and measures are taken to mitigate damage. This is especially important given the increasing prevalence of lymphedema among cancer survivors [3]. In this project, we tackle the issue of building a system capable of measuring arm volumes for the purposes of lymphedema detection.
The remainder of this thesis is organized as follows. Chapter 2 first provides an overview of 3D reconstruction, its inherent challenges and the existing related work in the field. It then describes volumetric measurement techniques currently used in, or proposed for, lymphedema diagnosis and treatment. Chapter 3 explains our system, design choices, and details alternatives to some of the approaches we’ve settled on. Chapter 4 states the final metrics on the performance of our system. Finally chapter 5 provides an analysis on our system as a whole and potential avenues through which this work can be improved.
Chapter 2
Related Work
2.1 3D Reconstruction
In 3D reconstruction, a model is built using a series of images captured by a sensor such as a camera. Many traditional methods use passive sensors that record reflected or emitted radiance from surfaces in order to infer structure in an underlying image. For example, stereo cameras capture multiple images at the same time but from offset perspectives, similar to how human vision works. These images can then be used to infer depth in the desired scene. It is also possible to use monocular cameras to infer depth from a scene given only one viewpoint at any time. These methods infer 3D shape from 2D characteristics like shading or texture [9, 28].
However we focus on active sensing technologies, like structured-light (SL) or time-of-flight (ToF), wherein cameras directly capture depth maps by interfering with the target object. SL cameras project one or more known patterns onto a scene. The deformation of a pattern allows the camera to infer depth and surface information of objects in said scene. In comparison a ToF camera resolves distance by calculating the time-of-flight of a light signal projected from the camera to the subject and back for every pixel of the image. Notable commodity examples of both types of cameras include the Intel SR300, which we use in this project and is an SL camera, and the Microsoft Kinect, which was previously an SL camera but more recently converted to ToF technology [10, 24]. The Kinect in particular has been involved in numerous 3D
reconstruction projects including in the seminal KinectFusion paper [17]. Numerous pipelines [7, 17] have also been built around commodity cameras and hardware that are able to create extremely detailed 3D reconstructions in real-time.
2.2 Volumetric Measurement Systems for Lymphedema
The existent methodologies for monitoring arm volume changes, a proxy for lym-phedema detection in patients, each have significant drawbacks. The following is a brief introduction into the most prominent methods available.
2.2.1 Water Displacement
Water displacement is a gold standard for volume measurement as the volume of any object must be equivalent to the volume of displaced water when the object is submerged. These measurements are typically accurate and precise across repeated testing [8]. However water displacement methods are time-consuming, not portable, and potentially unhygienic [15], the last of which is unacceptable for clinical set-tings. As such there is a strong incentive to find alternatives to water displacement volumetry despite it’s reliability and accuracy.
2.2.2 Geometric Methods
Geometric methods for volume estimation work by approximating segments of the arm and hand as simple 3D shapes like cylinders, frustums (truncated cones), etc [23]. Often the approximation happens by taking circumferential measurements at predetermined intervals (e.g. every 3 cm) to define the conic shapes. These methods correlate well with water displacement, as shown in Sander et. al. [23], and are extremely low-cost as the only tool necessary is a flexible measuring tape. However they are modestly time consuming for physicians to do, as repeated measurements must be done for accuracy purposes, and the raw accuracy can be problematic [23].
2.2.3 Bioelectrical Impedance
Bioelectrical impedance analysis, or BIA, does not directly measure volume of a patient’s limb. Instead it measures the impedance of an electrical current through the patient which is correlated to the amount of fluid the current must flow through. This method is a reliable and accurate tool for noting the presence of lymphedema in patients [27]. However the probes that attach to the patient’s skin are single use items. As such there is a high running cost of this method as the specialized probes need be constantly repurchased.
2.2.4 Perometry
The Perometer is a device which can approximate arm circumferences. The machine projects two perpendicular light fields along a moving frame and collects measure-ments at approximately 4mm intervals. Data collection is extremely fast and can be taken in seconds, and there is a positive bias of 6% to 7% error compared to water displacement [26]. However the Perometer is prohibitively expensive, discussions with personnel at Massachusetts General Hospital (MGH) revealed numbers on the order of tens of thousands of USD, and is therefore not often available in healthcare set-tings. Furthermore, the error is sensitive to orientation of the subject’s arm. Lastly the perometer is simply unable to measure hand volumes, likely due to assumptions made when interpreting the light field readings.
2.2.5 KinectFusion-Based
KinectFusion is a seminal algorithm and pipeline that is able to produce detailed 3D reconstructions using a singular moving camera, namely the Microsoft Kinect [17]. As the camera moves, generally slowly, it is able to take numerous detailed images at continuous points in space. This gives the algorithm it’s "super-resolution" as the slow movement allows for capture of sequences images at granularities finer than the camera’s pixel-based resolution. Registering all of the images together then creates a high detail model. This method has been shown to be a useful low-cost method for
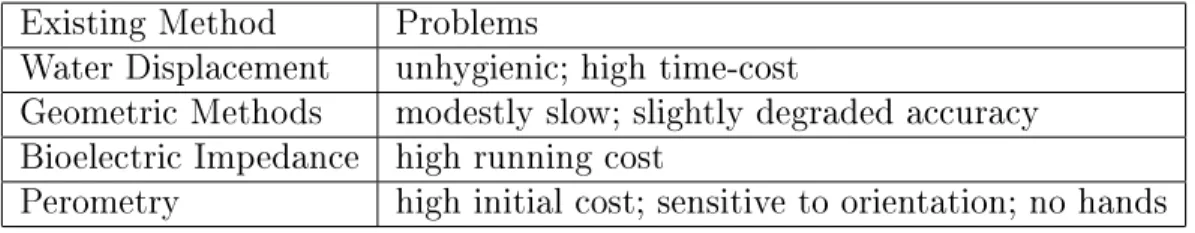
Table 2.1: Negatives of existing volumetric estimate methods Existing Method Problems
Water Displacement unhygienic; high time-cost
Geometric Methods modestly slow; slightly degraded accuracy Bioelectric Impedance high running cost
Perometry high initial cost; sensitive to orientation; no hands
measuring volume of arms [4]. However the necessity for slow movement to capture the data implies either personnel need to be well trained in how to move the camera for data capture or a rotating mount is built. Neither situation is ideal for a clinical setting as the former would be cumbersome and the latter raises concerns about longterm physical reliability of the device. Unfortunately such a solution does not exist on the market and hence the pros and cons are difficult to evaluate.
2.2.6 Recap of Concerns
We reached out to personnel who work with lymphedema victims at MGH for input on the failure points of existent volumetric estimate methods, and therefore what a successful system would require to thrive in a clinical setting. Some pain points echo those found in literature and are summarized in Table 2.1. But in general there are concerns about measurement accuracy given that most methods assume proxies for volume estimates (e.g. circumference, impedance, etc.). Furthermore, these methods are generally unable to provide models of the limbs that would allow clinicians to research the condition in better detail. Even worse, some methods are unable to cope with measurements of the hand.
To understand the severity of this issue consider the issue of accuracy. The po-tentially random noise seen in measurements may correlate with shape (e.g. as the arm swells, certain approximations or assumptions may start to hold more or less true). But this can create issues for clinicians who wish to track arm volume changes over time for treatment. Some methods compensate by performing a comparison of the lymphedema affected and non-affected limb pairs. However it is possible for
lym-phedema to strike bilaterally, which invalidates the aforementioned solution. As such in the worst case, the noise obfuscates important information.
As a note on the KinectFusion-based methods: While the KinectFusion-based methods would provide a detailed surface model, the need for a moving camera in-troduces a mechanical point of failure as well as a need for more detailed clinician training 1.
1The Kinect camera polls at 30Hz max. If the camera moves too quickly the depth image is blurred and data cannot be acquired. This can result in holes in the output model.
Chapter 3
System Design
This prototype is designed with the intended environment of a clinical setting in mind. Our device is relatively compact and could fit on a table in a small office1. It
is portable, as the device could need to be used in multiple areas of a hospital. As seen later, it is able to measure volumes in a consistent manner. Lastly for physical reliability of the system, we opted against any design that would include moving parts (i.e. in an attempt to use the Kinect Fusion work).
3.1 Hardware
3.1.1 Camera Selection
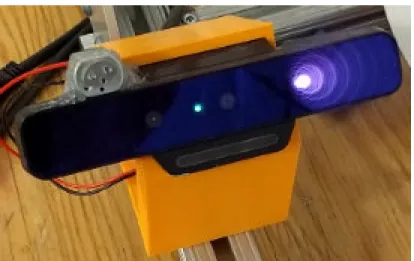
The selection of camera is extremely important as most hardware or software con-straints will arise from limitations in the camera itself. Our project is based on the Intel SR300, shown in Figure 3-1. We selected this camera because of its superior performance compared to other available cameras at the time, as shown in Table 3.1. The 0.2 m minimum-depth-range allows us to compact the device while maintaining ample amounts of tolerance.
Normally Table 3.2 would also show a positive incentive for selecting the SR300. In a single camera setup, a higher frame rate without sacrificed resolution would
1As we concede later, this device could likely be made more compact. We are not design experts and so there is likely much room for reducing the size of the system.
Figure 3-1: Intel SR300 camera. On the face of the camera, from left to right, you can see the SL camera, on-indicator light, RGB camera, and SL projector.
Table 3.1: Depth ranges for different commodity cameras at the time this project started in 2016 [10, 1, 16]
Camera Min Depth [m] Max Depth [m]
Intel RealSense SR300 0.2 1.5
Asus Xtion Pro 0.8 3.5
Microsoft Kinect 0.8 4.0
Microsoft Kinect: Near Mode 0.5 3.0
Table 3.2: Resolution and frames per second (fps) for different commodity cameras [10, 1, 16]
Camera Pixel Resolution FPS Intel SR300 640 x 480 60 Asus Xtion Pro 640 x 480 30 320 x 240 60 Microsoft Kinect 640 x 480 30
help to minimize the effects that accidental movements on the part of the imaged subject would have on the reconstruction process. However we proposed a multi-view system with each multi-view corresponding to a unique camera. The usage of multiple cameras creates opportunities for interference amongst their depth sensing units. The projection of multiple patterns simultaneously on a subject results in inaccurate depth readings. We mitigate this issue by cycling through the set of cameras for capture purposes and requiring that any camera not collecting data turn off it’s infrared projector2. While this solves the interference problem, it creates a registration issue
because of the time delay between subsequent data captures.
3.1.2 Physical Rig
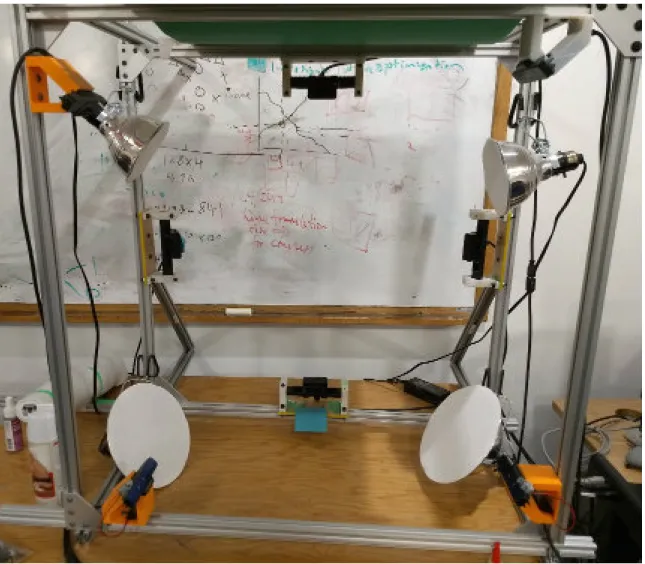
The physical rig, as shown in Figure 3-2, is comprised of a metal frame, eight Intel RealSense SR300 cameras, custom 3D printed mounts for each camera, and four floodlights. The metal frame spans 86.4 cm by 86.4 cm by 45.7 cm. Due to the shape of the cameras, and the need for a cable to access the rear of each camera for data transfer, each camera is mounted such that the face of the camera is anywhere from 5 cm to 7.5 cm away from the frame. Given the minimum distance for depth sensing, this corresponds to a 30 cm by 30 cm area in which an imaged subject could exist, and also allows for more overlap of imaged areas between cameras. We believe that a more thorough analysis and simulation of the cameras could result in a more compact structure, but that such an analysis is out of the scope of this project’s goal of developing a potentially viable prototype.
The eight cameras are distributed in sets of four with the intent to maximize the amount of potential overlap between imaged surfaces of the cameras:
∙ The four cameras3 situated at the rear face (the face further away from the
2We have also attempted to remove interference altogether by attaching vibrating motors to each camera, as in the work of Butler et. al. on the Kinect sensor [5]. However we were unable to achieve any promising results. Whether this is because the motors were not strong enough to induce sufficient vibration or another cause was not researched.
3These cameras are the pre-release versions of the SR300 that we managed to acquire through the developer program as this thesis began. Shortly afterward we ordered another four cameras and received the normal release versions.
viewer of Figure 3-2) of the frame are mounted at the midpoints of each side and tilted approximately 45 degrees to view towards the center of the device. This helps the entire system see the tips of the fingers.
∙ The four cameras situated at the front face of the frame are mounted perpen-dicularly to the frame and close to the corners of the frame. Supporting metal plates prevented us from putting the cameras in the corners themselves. The floodlights, which are seen covered with paper, were placed to provide even diffuse lighting for the cameras. The green board on the top only exists to block light from the office light above. Lastly there exist very thin loops of string hanging from the top edges of the frame. These are effectively invisible to the depth cameras and are placed to help stably suspend objects we imaged as shown in Figure 3-3. These strings are extremely useful when imaging arms as they help to reduce the swaying and shaking that occurs when we attempt to hold our arms still for a brief period of time.
3.1.3 Computer Setup
We built dedicated computers to use in this project. Each computer is comprised of a ASUS Z170-A motherboard, 16 gigabytes of DDR4 RAM, 500 GB of SSD, a GTX 1070 GPU, an Intel Core i7-6700K CPU, and applicable accessories for cooling and power. The cameras connect to the computer through an externally powered USB hub that is able to service and power all eight cameras. The computer runs on Ubuntu 16.04.1. We found that this computer is powerful enough for our computational needs, which did not often maximize throughput in the system. Typically a scan would take on the order of a few tens of seconds to record and register images and then a few seconds to reconstruct a model of the surface itself. In total we could casually use our system to go from imaging through data cleaning and to volume calculations on the order of a minute. Although this time can certainly be improved, we did not believe it was necessary to show the value of our system.
Table 3.3: Construction Cost Table
Part USD Cost (2016) Part USD Cost (2016)
Motherboard 135 RAM 82
CPU 340 Case 60
GPU 400 Power Supply 57
SSD 157 CPU Cooling 30
Cameras 129 x 8 -
-Total 2293
Figure 3-4: Software Pipeline Diagram. The focus of this thesis is in the bolded black box.
3.1.4 Construction Cost
We purchased all parts in the fall of 2016. The part costs are listed in Table 3.3. We do not have cost estimates for the 3D printed mounts or the metal frames, brackets, etc. However if we assume those parts cost the same amount as the computer and cameras, the total system cost for us came out to approximately $4600 which is an order of magnitude less than the cost for MGH to acquire a Perometer.
Figure 3-5: Example calibration target pattern built with Calibu library. The pattern is printed on paper and affixed to a rigid flat board. The scale of the printed target (i.e. how far between centers of dots) is then recorded for use as an input into the calibration system.
3.2 Software
The general software pipeline for the project is shown in Figure 3-4. The majority of the software work on this thesis is dedicated to the sections marked in the black box, namely surface reconstruction and editing and then volumetric reconstruction. The calibration through registration work is the focus of another thesis in this group [29]. However we believe it is important to provide a brief overview of all sections for context.
3.2.1 Calibration and Registration
The first step of the software pipeline is to perform intrinsic, depth, and extrinsic calibration of the cameras. The intrinsic calibration is done to help remove distortions in the images caused by imperfections in the camera components and general radial distortion. The depth calibration attempts to further rectify any distortion in the perceived depth fields. The extrinsic calibration attempts to register the locations and orientations of the cameras with respect to one another in some global coordinate
Figure 3-6: Surfaces prior to refined registration. Notice how the sheets of points are roughly in the correct global position but still visibly unaligned.
space. All types of calibration are done using a flat calibration target shown in Figure 3-54. The board creates a unique pattern that is observable even with minor
occlusion and the flatness of the board allows the software to roughly model camera irregularities.
Once calibration is completed, image acquisition and registration occurs. The image acquisition is done through the use of the librealsense library, provided online by Intel, with each camera turned on and off in sequence to prevent the aforementioned depth interference. Each pair of color and depth images is transformed into a point cloud that then needs to be registered into a coherent global model. The extrinsic calibration from before allows each point cloud to roughly align with every other point cloud. However small discrepancies in the transformation matrix can result in large errors, as in Figure 3-6. As such the registration is further refined via sets of alignments provided by the Iterative Closest Point (ICP) class of algorithms. Then this thesis’s work takes the output registered model as an input and attempts to construct a reasonable volume estimate.
3.2.2 Reconstruction
For the sake of clarity we define a number of terms here first before delving into the reconstruction pipeline.
∙ Polygon mesh or mesh: A collection of vertices, edges and faces that define a polyhedral object (i.e. is a 2-manifold). Surface normals for the mesh are defined to point outside of the mesh.
∙ Boundary edge: An edge adjacent to only one face in the mesh.
∙ Watertight: A term describing a mesh without a non-topological hole. This implies a lack of boundary edges.
∙ Inside/Outside: The notion of inside and outside of a mesh follow the intuitive binary definitions of space demarcated by a watertight mesh.
Surface Reconstruction
Surface reconstruction is performed using the Poisson Reconstruction algorithm[13]. This algorithm takes as input an oriented point cloud (a point cloud with calculated normals) and outputs a triangular mesh. It works by interpreting the point cloud as a vector field ⃗𝑉 (with each point determining location and each normal determining direction), and then solving for a scalar function 𝑋 whose gradient approximates the vector field. Applying a divergence operator to both sides reduces the problem to solving the Poisson equation as shown in eq. 3.1.
∇𝑋 = ⃗𝑉 ⇒ ∆𝑋 = ∇ · ⃗𝑉 (3.1)
The solution can be computed with varying levels of approximation5, but it must
be noted that coarser approximations result in less detailed output meshes that may not be representative of the imaged surface. In our case, human arms are rather feature minimal in terms of geometric landmarks and hence the solution need not
5This is often done by specifying how deeply into an octree search tree the solution will attempt to traverse.
use high levels of precision during the searching step, which helps to reduce runtime. The coarser solution also allows the algorithm to smooth over small gaps in the raw dataset that are left behind by noise and other imperfections in data capture. We use an open source Poisson reconstruction library6 to solve this step with a search depth
of eight.
Noise Removal
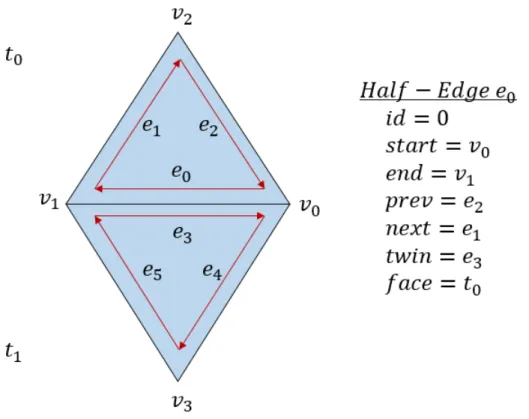
Once the triangle mesh has been created, it must go through a series of post-processing steps to remove noise, as seen in Figure 3-8. As input we take a PLY file which describes the mesh as a set of vertices and a set of vertex-index-triplets. These triplets are in a specific order that defines the direction of the surface normal for the triangle. We first convert this mesh representation into a graph of winged half edges, shown in Figure 3-7. We chose this data structure for numerous reasons. One it simplifies traversal across the mesh, and two it simplifies checks for manifold imperfections7.
With this graph structure we then filter out all connected components except the largest component which we assume to be the target mesh itself. A cleaned mesh is then ready for the last processing step of trimming.
Surface Trimming
Surface trimming describes removing undesired parts of the final mesh. Given the orientation of the cameras it is impossible to acquire the view of every side of a subject, and as such there must be a well-defined termination plane for measurement. We do this by allowing users to select mesh vertices that could lie on some cutting plane and then computing the plane using least squares regression8. The last selected
vertex is used to define the direction of the plane’s normal and hence the notion of ’outside’. Once the plane is computed the half-edge mesh is processed to remove any points outside of the plane. Edges are intersected with new vertices initialized at the
6Link here: https://github.com/mkazhdan/PoissonRecon
7Consider looking for a non-topological hole in a mesh (e.g. a hole that prevents the mesh from being watertight). It becomes sufficient to look for any half-edge without a twin.
8The linear least squares system is solved using Singular Value Decomposition (SVD) methods for numerical stability.
Figure 3-7: Winged half-edge data structure. It is called a half-edge because it records data specifically about an edge in one direction, which can simplify traversal over polygonal meshes. In this figure 𝑡𝑖 represents a triangle, 𝑣𝑖 represents a vertex,
and 𝑒𝑖 represents a half-edge. A full edge of a manifold is part of two polygons, but in
order for the polygons to have similar surface normals, these two polygons necessarily use the edge in opposite directions (as shown by the red arrows). The surface normals in this example point into the page following standard right-handed coordinate rules. The data elements of a half-edge are shown on the right and consist of the following: id is a unique identifier for the half-edge, start and end point to the vertices that define the half-edge, prev and next point to the half-edges preceding and succeeding this half-edge on the polygon, twin represents the half-edge on the adjacent face that points in the opposite direction to this half-edge, and face points to the polygon this half-edge is part of.
Figure 3-8: Mesh prior to noise removal. Notice the small clusters in the upper right quadrant of the figure.
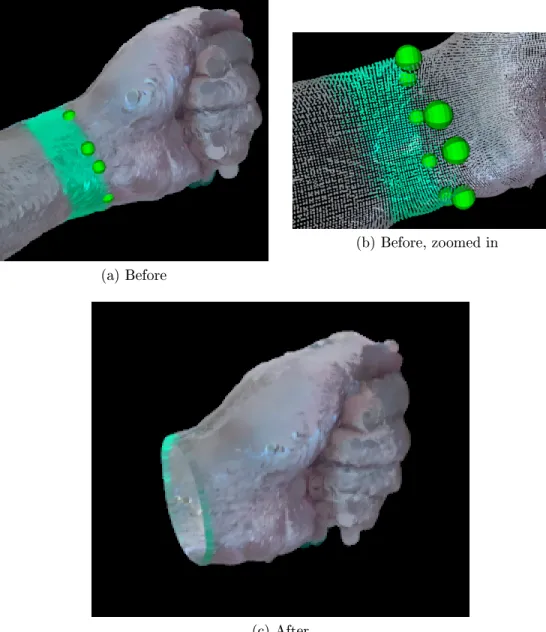
(a) Before
(b) Before, zoomed in
(c) After
Figure 3-9: Surface trimming example. In this case the left human arm is undergoing truncation to measure volume of the hand from the wrist up. In (a), the green spheres represent points that have been selected for calculating the cutting plane. (b) shows a zoomed in version that exposes points selected on the other side of the wrist. These points, as mentioned elsewhere, attempt to straddle the edge between the green tape the and skin. (c) shows the result of the truncation. There exists a small amount of green around the wrist implying that the cut is not perfect, but the amount of extra volume from the disk is minimal compared to the full volume of the fist.
intersection points. Then new triangles are constructed to replace any triangle that needs to be partially removed. This process is shown and described in Figure 3-9
Lastly any holes created by the cutting plane are patched by a series triangles. We take the simplest approach to hole filling possible despite the possibility for minor error. Given a set of vertices connected to one another in a cycle along a mesh boundary, we first find the centroid of the vertices. Then for each consecutive pair of vertices we construct a triangle with said pair and the centroid while preserving the desired normal orientation defined by the cutting plane. While this removes the hole, there can be imperfections when the hole is non-convex. However in practice we have seen that the number of triangles constructed for hole patching is dwarfed by multiple orders of magnitude compared to the number of triangles that exist in the mesh, and hence the added error is minimal with respect to volume calculations. Volumetric Reconstruction
We perform volumetric reconstruction by summing signed volumes of pyramids formed by each triangle in the mesh and the origin of the Euclidean space the surface model resides in. The signed volume of any triangle can easily be calculated using the triple product of the triangle’s vertices in order, as shown in eq. 3.2
1 6 |𝑇 | ∑︁ 𝑖 𝑣𝑖0· (𝑣1𝑖 × 𝑣𝑖2) (3.2) where 𝑇 represents the set of triangles in the processed mesh, and 𝑣𝑖
𝑗 represents
the 𝑗th vertex of the 𝑖th triangle. In order to minimize the potential error of from accumulating numerous small floating-point numbers, the summation is performed using the Kahan summation algorithm [12]. This algorithm works by compensating for lost low-order bits of the accumulated numbers during the summation itself. When the condition number ∑︀|𝑥
𝑖|/|∑︀𝑥𝑖| is small, as in this case, the error is proportional
to machine precision instead of proportional to the size of the set summed. The pseudocode for this algorithm is shown below.
function Kahan_Sum(inputs) 𝑠𝑢𝑚 ← 0
𝑐 ← 0 ◁ 𝑐 acts as an accumulator of lost low-order bits for all 𝑣 ∈ 𝑖𝑛𝑝𝑢𝑡𝑠 do
𝑦 ← 𝑣 − 𝑐 ◁Adds low-order bits of previous 𝑦 𝑡 ← 𝑠𝑢𝑚 + 𝑦 ◁ Low-order bits of 𝑦 are lost if 𝑠𝑢𝑚 ≫ 𝑦 𝑐 ← (𝑡 − 𝑠𝑢𝑚) − 𝑦 ◁Retrieves negative of low-order bits of 𝑦 𝑠𝑢𝑚 ← 𝑡
end for return 𝑠𝑢𝑚 end function
Chapter 4
Evaluation
In this section we evaluate our device’s outputs from both qualitative and quantitative perspectives. We first analyze the error of the surface and volumetric reconstruction pipeline using simulated point clouds as a baseline. This provides us with a glimpse of how the system could run with ideal inputs. Then we evaluate our entire pipeline with three classes of real objects: geometric shapes, a mannequin arm, and human arms. The ground truth volume of each class is either calculated mathematically, in the case of geometric shapes, or via water displacement experiments, in the case of the mannequin and human arms.
Table 4.1: Simulated point cloud measurements. Model parameters roughly match those of the real world scanned objects and contain a point density of 10 points per square centimeter.
Object Dimensions [cm] Volume [ml] Estimate [ml]
Sphere 𝑟 = 6 904.78 904.83
Cylinder 𝑟 × ℎ = 4 × 14 703.72 703.65
Figure 4-1: Example simulated box. Notice the ruggedness of the surface. The sparse data prevents the surface reconstruction from building perfectly flat sides and sharp corners.
Table 4.2: Geometric shape dimensions after considering cutting plane locations
Object Abbrev. Dimensions [cm]
Foam cone cone 𝑟 × ℎ = 3.493 × 13.97
Foam cylinder cyl 𝑟 × ℎ = 3.493 × 11.43 Foam rectangular prism prism 𝑙 × 𝑤 × ℎ = 7.144 × 6.985 × 11.43 Foam rectangular pyramid pyr 𝑙 × 𝑤 × ℎ = 7.144 × 6.985 × 14.03 Wooden rectangular prism block 𝑙 × 𝑤 × ℎ = 4.445 × 8.890 × 20.32 Yoga roller roller 𝑟 × ℎ = 4.921 × 32.54
4.1 Simulated Point Clouds
The simulated point clouds attempt to model some of the parameters of the point clouds seen from the device. These noisy point clouds contain 120000 to 500000 points depending on the size of the object imaged. On average this corresponded to a point density of 350 points per square centimeter. The simulated clouds contain a density of 10 points per square centimeter to both account for noise and demonstrate viability with much lower resolution inputs.
Table 4.1 shows the results of these baseline tests with Figure 4-1 showing an example simulated object. Even with much sparser input point clouds, the pipeline can calculate volumes with less than a percentage point of error. This is likely because surface defects contribute minimally to volume.
4.2 Real-World Inputs
4.2.1 Geometric Surfaces
The real-world input shapes are shown in figure Figure 4-2. The green tape on the geometric solids are exactly one inch wide. Cutting planes for the geometric shapes were chosen to exist at the top edge of the green tape. The dimensions of the geometric surfaces measured by the device are described in Table 4.2. The volumetric estimates of the device using carefully selecting cutting planes are shown in Table 4.3. The linear regression plot for expected true volume vs the device estimates is shown in
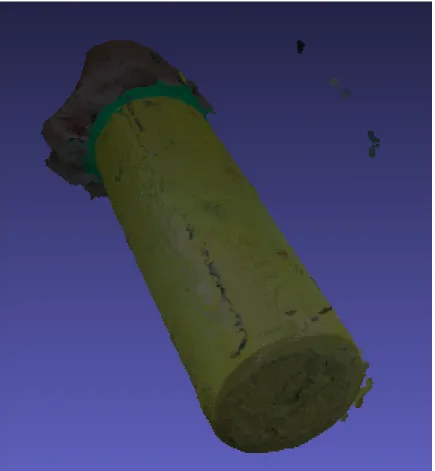
Figure 4-2: Model shapes. From top-to-bottom, left-to-right the models are as follows: a mannequin arm, a foam cone, a foam cylinder, a wooden rectangu344lar prism, a foam rectangular pyramid, a foam rectangular prism, and a yoga roller. The green tape adhered to the objects are primarily used to mark possible cutoff planes for each shape. As shown in the image, the tape is also used to combine shape primitives into more complex models for experimentation. The markings on the yoga roller are for qualitative evaluation purposes. The registration pipeline does not take color features into account.
Figure 4-3: Water displacement test setup. The plastic bucket holds a tall column of water and has an overflow drain near the top. Water displaced flows into graduated cylinders for measurement. This figure shows an example measurement for a human arm.
Table 4.3: Volume measurements of geometric shapes
Object Orientationa Volume [ml] Estimate [ml] Raw Error [%]
cyl normal 437.99 749.77 71.18
skew 437.99 746.10 70.35
prism normal 570.35 897.48 57.36
skew 570.35 937.6 64.39
cyl + cone normal 616.43 1018.5 65.22
skew 616.43 1046.1 69.70
prism + pyr normal 802.71 1258.5 56.78
skew 802.71 1295.22 61.36
block normal 802.97 1263.03 57.30
skew 802.97 1185.53 47.64
roller normal 2476.1 3481.9 40.62
skew 2476.1 3413.1 37.84
a The orientation is with respect to the device. "normal" means the object
was place dead center of the device perpendicular to plane formed by the back four cameras. "skew" means that the object was place near the center but rotated off of perpendicular by 15 degrees.
subplot (a) of Figure 4-4. Despite the high error, there seems to be a strong correlation between the exact volume and the device estimated volume. If we compare the normal orientation device volumes for the prism and block, it seems as though the device is sensitive to volume differences in similar shapes. The difference in raw error for the cylinder and roller are attributed to the vast differences in sizes of the objects.
4.2.2 Anatomical Surfaces
The mannequin arm used is shown in Figure 4-2. Cutting planes for the mannequin arm were chosen to exist on the left edge of the tapes. Similar cutting planes were chosen for the human arm as well. In both cases, the cutting planes selected were also used to define cutoff points for submersion in the water displacement tests. The water displacement tests were done using a tall storage column shown in Figure 4-3 and graduated cylinders with a tolerance of ±5ml. To measure volume, the bucket is first filled with water until overflowing through the drain. Once the water finishes overflowing and is discarded, the desired objects are slowly submerged and the over-flow caught in graduated cylinders for measurement. Measurement occurs after the
Table 4.4: Volume measurements from device of Erik Nguyen’s (author) arm1.
Measurements [ml] Aggregations [ml]
Sidea Objectb 1 2 3 4 5 Avg Std Dev
L P 643.51 644.45 627.48 637.01 580.91 626.67 26.47 L F 537.45 562.86 534.18 566.25 516.28 543.41 21.96 L FA 1700.6 1733.6 1676.3 1705.2 1767.5 1716.6 34.974 R P 625.74 625.00 583.21 613.06 623.26 614.05 17.982 R F 594.4 490.61 528.74 531.91 605.18 550.17 48.275 R FA 1871.4 1838.5 1671.7 1863.8 1895.1 1828.1 89.708 a L: Left. R: Right.
bP: Open Palm (fingertip to wrist). F: Fist (until wrist). FA: Forearm (wrist
to elbow).
Table 4.5: Volume measurements from water displacement of Erik Nguyen’s (author) arm1. An estimate of forearm only measurements can be extracted using the property
linearity of expectation.
Measurements [ml] Aggregations [ml]
Sidea Objectb 1 2 3 4 5 Avg Std Dev
L H 398 383 390 385 390 389 5.81
L H + FA 1468 1444 1445 1462 1455 1453 10.47
R H 389 380 389 386 392 387 4.55
R H + FA 1557 1540 1540 1555 1541 1547 8.620
a L: Left. R: Right.
b H: Hand (fingertip to wrist). FA: Forearm (wrist to elbow).
second round of runoff has subsided. The process then repeats with the same or other objects again by refilling the bucket.
The data from water displacement and device measurements of both a human and a mannequin arm are shown in Table 4.4, Table 4.51, and Table 4.6. The linear
regression plot for water displacement estimate vs device estimates is shown in subplot (b) of Figure 4-4. From the tabular data we see that the fist orientation for hands results in a consistently smaller estimated volume than the palm orientation.
1Measurements from Table 4.4 and Table 4.5 were taken within three hours of each other to minimize any possible effects of human physiology on the volumes.
Table 4.6: Volume measurements of a mannequin arm
Object Water Displacement [ml] Device Estimate [ml]
4.3 Analysis
Table 4.3 seems to imply that affine transformations in positioning of shapes in the device leads only to small fluctuations of error. On the other hand Table 4.4 implies that the positioning of the hand (which are non-affine transformations) results in very large differences in volume estimations (∼ 60% error drops to ∼ 40% error). Further the error in palm vs forearm estimates are similar. Therefore we believe that the higher number of geometric features easily detected in a human fist allows results in a better model. These features would help with registration and lead to overall smaller values despite the fact that some occluded space in the fist is added to the volume as well.
In general the device estimates of volume have a strong positive bias as evidenced in the data tables. This seems to be mostly systematic error as there exists a strong correlation between the device estimates and the expected true volumes as evidenced by Figure 4-4. The systematic error is primarily attributed to registration artifacts such as those witnessed in Figure 4-5 which we describe qualitatively.
In this image, multiple blemishes can be seen. It is clear that the green tape is not properly aligned in the upper part of the red-marked region. This indicates that the surfaces slide with respect to one another, likely due the the lack of useful depth features along the sides of the roller. The two "x" characters in the red box, and the faint "A" characters below both show that the surfaces were pulled away from each other. All of these registration issues show work to increase the volume in the output mesh. Apart from registration issues, there appear to be noise issues in the capture data that are not dealt with during reconstruction. This can be seen in the faint ridge close to the bottom of Figure 4-5. These would also need to be mitigated in order to increase confidence in the system.
(a) Regression for Geometric Shapes (b) Regression for Anatomical Shapes
(c) Regression for All Shapes
Figure 4-4: Plots of volume vs estimates with regressions. (a) shows data captured for the classes of geometric shapes. (b) shows data captured for the human and mannequin arm segments. Only fist shape data was include for hands. (c) shows all of the data in (a) and (b) together. In each case, there exists a strong correlation between the average device estimate and the respective true volume estimates.
Figure 4-5: Example of registration misalignment. Notice how the symbols seem to exist faintly in two places, such as the "A". This is indicative of misalignment of point clouds. This can be seen on each part of the lateral surface, implying that the registration is fractionally pulling the surfaces apart, thereby causing the volume increase.
Chapter 5
Discussion and Conclusions
Many of the goals the MGH physicians requested were mostly achieved in this pro-totype, namely affordability, compactness, portability, and reliability. The size of the physical device is small enough that it could manageably be moved around. The to-tal cost of this prototype is at least an order of magnitude lower than the Perometer upfront, and over time would be cheaper than bioelectric impedance running costs. The fact that all device components are strongly fastened to the frame relieves any concerns about physical reliability. Moreover data capture is fast (on the order of seconds), with the remaining time taken up by processing. The low variance in error implies reproducible behavior of the system. And the strong correlation between mea-sured and expected volume shows promise in the system despite the high systematic error.
That said, there are multiple avenues that can help refine the device and software pipelines. A complete simulation of the camera parameters could allow the physical rig to shrink in size. This would also be necessary to optimize camera-to-camera overlap for registration with the existing number of cameras, or even more. It is hard to say if more cameras is worthwhile, however. On one hand, more cameras in the current rig implies a longer capture time, which can be problematic with targets that can shift. On the other, more cameras allows for more overlap in captured scenes which can help with pair-wise image registration. We do not believe switching cameras will result in better performance given the numerous constraints. Even the
newer Intel ZR300 camera which is designed such that little to no interference occurs between IR depth projectors has a minimum depth size that is much larger than that of the SR300 [11]. As such if compactness and portability are important features the SR300 is likely here to stay unless specialized cameras are built or ordered.
The registration portion also has much potential for improvement. In the current device, each camera captures a singular image which is used to create the model. This is good for minimizing the effects of movement on the quality of the registered point cloud. However it also implies that any noise or missing data may become ingrained in the model in a way that is non-trivial to deal with during reconstruction. This registration issue can be tackled in a number of ways, but likely will need to involve non-rigid transformations that register the scene image to a prior template. This is because patients may have physical constraints that prevent them from holding arms straight, or hands in specific positions. In order to deal with all of these potential issues robustly, the registration almost has to be non-rigid and online as in [7]. If such a registration system is built, then any movement on the part of a patient would allow the model to collect more data, similar to how Kinect Fusion moves the camera for more view points.
The surface reconstruction pipeline has many points that need to be refined. Ide-ally the cameras would send multiple images instead of one to help with mitigating noise. However this would likely require the data to be stored in voxels instead of as points. A voxel representation involves constructing a 3D Cartesian grid such that each coordinate in the grid corresponds to a signed distance from the imaged surface. This intuitively allows for removal of random depth noise by storing average distances into each voxel. However the memory used in a high resolution voxel representation is wasted space, and so care must be taken to design space and time efficient sparse voxel grids. Converting the voxel representation into a mesh can be done by the marching cubes algorithm [14] or any such similar algorithm. Although holes are not smoothed over by marching cubes in the same way that Poisson reconstruction does, it is possible to patch small holes efficiently using volumetric diffusion [6]. Then other post processing steps such as the removal of noisy connected components and surface
trimming can occur as before.
Lastly, there is opportunity to include another pipeline component by way of full surface-to-surface mapping. If two surface reconstructions are taken at different points in time, such a mapping would help with transferring cutting plane locations and therefore allow measurements over time to correlate. More interestingly it would allow for analysis of changes in the mesh (e.g. what parts start swelling first and what is the rate of swelling across the upper extremities?).
As final remarks, this prototype is still rough around the edges. It shows promise but must undergo much revision to improve accuracy of reconstruction. Without this accuracy, it would be hard to convince any medical professional of volumetric measurements regardless of correlation strength. For instance, it would certainly be possible to detect large fluctuations in volume but not small ones on the order of a few percentage points. However with refinement opens up possibilities for other research avenues. If a 3D reconstruction project similar to this work or otherwise comes to completion, the rich surface models created for diagnosis can be collected for further research into lymphedema.
Bibliography
[1] Asus. Xtion Pro Specifications. url: https://www.asus.com/3D-Sensor/Xtion_PRO/specifications/.
[2] D. W. Bates and A. A. Gawande. Improving safety with information technology. New England Journal of Medicine, 348(25):2526–2534, 2003. PMID: 12815139. [3] K. M. Brayton, A. T. Hirsch, P. J. O’Brien, A. Cheville, P. Karaca-Mandic,
and S. G. Rockson. Lymphedema prevalence and treatment benefits in cancer: Impact of a therapeutic intervention on health outcomes and costs. PLOS ONE, 9(12):1–15, 12 2014.
[4] Roberto Buffa, Elena Mereu, Paolo Lussu, Valeria Succa, Tonino Pisanu, Franco Buffa, and Elisabetta Marini. A new, effective and low-cost three-dimensional approach for the estimation of upper-limb volume. Sensors, 15(6):12342–12357, 2015.
[5] D Alex Butler, Shahram Izadi, Otmar Hilliges, David Molyneaux, Steve Hodges, and David Kim. Shake’n’sense: reducing interference for overlapping structured light depth cameras. In Proceedings of the SIGCHI Conference on Human Factors in Computing Systems, pages 1933–1936. ACM, 2012.
[6] James Davis, Stephen R Marschner, Matt Garr, and Marc Levoy. Filling holes in complex surfaces using volumetric diffusion. In 3D Data Processing Visualization and Transmission, 2002. Proceedings. First International Symposium on, pages 428–441. IEEE, 2002.
[7] M. Dou, S. Khamis, Y. Degtyarev, P. L. Davidson, S. R. Fanello, A. Kowdle, S. Orts, C. Rhemann, D. Kim, J. Taylor, P. Kohli, V. Tankovich, and S. Izadi. Fusion4d: real-time performance capture of challenging scenes. ACM Trans. Graph., 35:114:1–114:13, 2016.
[8] Alan R Hargens, Jong-Moon Kim, and Peihong Cao. Accuracy of water displace-ment hand volumetry using an ethanol and water mixture. Aviation, space, and environmental medicine, 85(2):187–190, 2014.
[9] B. KP. Horn. Shape from shading: A method for obtaining the shape of a smooth opaque object from one view. 1970.
[10] Intel. Intel RealSense Camera SR300: Embedded Coded Light 3D Imaging System with Full High Definition Color Camera, June 2016. Revision 1.0.
[11] Intel. Intel RealSense 3D Camera ZR300, January 2017. Revision 1.0.
[12] William Kahan. Pracniques: further remarks on reducing truncation errors. Communications of the ACM, 8(1):40, 1965.
[13] Michael Kazhdan, Matthew Bolitho, and Hugues Hoppe. Poisson surface recon-struction. Indicator, 1(1):0.
[14] William E Lorensen and Harvey E Cline. Marching cubes: A high resolution 3d surface construction algorithm. In ACM siggraph computer graphics, volume 21, pages 163–169. ACM, 1987.
[15] Antoinette M Megens, Susan R Harris, Charmaine Kim-Sing, and Donald C McKenzie. Measurement of upper extremity volume in women after axillary dissection for breast cancer. Archives of physical medicine and rehabilitation, 82(12):1639–1644, 2001.
[16] Microsoft. Kinect Sensor, March 2012. url: https://docs.microsoft.com/en-us/previous-versions/microsoft-robotics/hh438998(v=msdn.10).
[17] R. A. Newcombe, S. Izadi, O. Hilliges, D. Molyneaux, D. Kim, A. J. Davison, P. Kohi, J. Shotton, S. Hodges, and A. Fitzgibbon. Kinectfusion: Real-time dense surface mapping and tracking. In 2011 10th IEEE International Symposium on Mixed and Augmented Reality, pages 127–136, Oct 2011.
[18] Institute of Medicine. To Err Is Human: Building a Safer Health System. The National Academies Press, Washington, DC, 2000.
[19] World Health Organization. Global programme to eliminate lymphatic filariasis. Weekly Epidemiological Record, 84(42):437–444, 2009.
[20] S. I. Park, S. P. Ponce, J. Huang, Y. Cao, and F. Quek. Low-cost, high-speed computer vision using nvidia’s cuda architecture. In 2008 37th IEEE Applied Imagery Pattern Recognition Workshop, pages 1–7, Oct 2008.
[21] E. Poage, M. Singer, M. Poundall, and J. Shellabarger. Demystifying lym-phedema: Development of the lymphedema putting evidence into practice card. Clinical Journal of Oncology Nursing, 12(6):951–964, 2008.
[22] E. Quirion. Recognizing and treating upper extremity lymphedema in postmas-tectomy/lumpectomy patients: A guide for primary care providers. Journal of the American Association of Nurse Practitioners, 22(9):450–459, 2010.
[23] A. P. Sander, N. M. Hajer, K. Hemenway, and A. C. Miller. Upper-extremity volume measurements in women with lymphedema: A comparison of measure-ments obtained via water displacement with geometrically determined volume. Physical Therapy, 82(12):1201–1212, 2002.
[24] H. Sarbolandi, D. Lefloch, and A. Kolb. Kinect range sensing: Structured-light versus time-of-flight kinect. Computer Vision and Image Understanding, 139:1– 20, 2015.
[25] R. K. Shenoy. Clinical and pathological aspects of filarial lymphedema and its management. The Korean Journal of Parasitology, 46(3):119, 2008.
[26] AWB Stanton, JW Northfield, B Holroyd, PS Mortimer, and JR Levick. Valida-tion of an optoelectronic limb volumeter (perometer○R). Lymphology, 30(2):77–
97, 1997.
[27] Anne G Warren, Brian A Janz, Sumner A Slavin, and Loren J Borud. The use of bioimpedance analysis to evaluate lymphedema. Annals of plastic surgery, 58(5):541–543, 2007.
[28] Andrew P. Witkin. Recovering surface shape and orientation from texture. Ar-tificial Intelligence, 17(1):17 – 45, 1981.
[29] F. Yordan. Multi-cam alignment for 3d arm reconstruction in lymphedema di-agnosis using iterating pairwise icp. Master’s thesis, Massachusetts Institute of Technology, 2018.