Astrocytoma infiltrating lymphocytes include major T cell clonal expansions confined to the CD8 subset
13
0
0
Texte intégral
(2) 1338 CD81 T cell oligoclonal expansions in human astrocytoma lysates (11), sometimes correlated with the detection of T cell effectors (10,11). The therapeutic potential of T cells is not limited to melanoma. Patients with relapsing leukemia or lymphoma after allogeneic bone marrow transplant can be rescued by the injection of donor lymphocytes (adoptive immunotherapy) (12,13). Arising from astrocytes, astrocytomas are the most common primary brain neoplasms that represent 3% of human tumors. They are classified according to histological criteria. Malignant forms include anaplastic astrocytoma (grade III) and glioblastoma (grade IV). Although it is clear that immune reactions can and do occur in the central nervous system (CNS) (14– 17), this particular localization in a long thought immune privileged site may have consequences for putative antitumor immune responses. Indeed, special features of the brain microenvironment (e.g. absence of MHC molecules expression on the normal brain parenchyma and exclusion of components of the immune system by the blood–brain barrier) suggest that the rules governing immune responses in the brain should not be directly extrapolated from those observed in other tissues. Most astrocytomas are infiltrated by T lymphocytes (18), but these cells are poorly characterized and may have a reduced proliferative potential in culture (19,20). Therefore, looking for immune responses only by standard cellular approaches may significantly underestimate the frequency of specific cells (19,21,22). Here, to better appraise the global T cell immune response in astrocytoma, we take advantage of a high-resolution RT-PCR method based on the determination of the TCR β chain complementarity determining region (CDR) 3 length. The CDR3 region carries the principal antigenic specificity of a T lymphocyte, a conclusion further validated by recent crystallography studies (23,24). V–D–J recombination and the action of the terminal deoxynucleotidyl transferase give rise to CDR3 regions of variable sequences and lengths (5–15 amino acids) at the V–J junction. Therefore, the analysis of CDR3 size distribution among the different BV families is a powerful approach to study TCR diversity, and to evaluate the dynamics and specificity of immune responses taking place in vivo (25,26). TCR molecular analysis can also be performed on cell populations sorted according to expression of certain phenotypic markers (27,28), greatly enhancing the possible applications of this technique. In the present study, TCR diversity was analyzed in the whole T cell infiltrate, and compared with that of sorted CD41 and CD81 T cell subpopulations in order to assess their relative importance in the response. Indeed, the question of the requirement for CD41 T cells in the generation and function of CD81 cytotoxic T lymphocytes (CTL) is an important issue in many immune responses. For viral clearance, contrasting results can be found depending on the source of the antigen and the experimental system used (29–33). In the case of chronic infections, CD41 help seems to be particularly important for the continued maintenance of CD81 effector functions (34). In cancer, tumor cells genetically modified to express MHC class II molecules were more immunogenic than the parental cell lines, suggesting that an optimal antitumor response may depend on the recruitment of CD41 T cells (35,36). Concerning the epitopes recognized by CD41 T cells in man, some MHC class II-restricted tumor antigens. have now been characterized (37–39). In certain experimental conditions, CD81 T cells alone can nevertheless mediate partial or complete anti-tumor effects (40–42). Recent data indicate that the site of immunization may determine the requirement for CD41 cells (43), an observation that may help to reconcile some of these conflicting data. In the CNS, several experimental results support the view that an efficient CD81 response relies on appropriate CD41 help (14–17). For example, CD4-depleted mice infected with the neurotropic JHM strain of mouse hepatitis virus showed normal CTL effector function in peripheral tissues, but failed to clear virus in the CNS (14). Investigating the role of CD41 and CD81 T cells in human astrocytoma could be invaluable for understanding why the immune system fails to control the development and growth of these tumors. In the present work, a fine characterization of TCR variability was undertaken in a large series of human astrocytomas. Our data demonstrate the presence of significant T cell clonal expansions in the tumor bed, strongly suggesting an immune response to as yet undefined astrocytoma antigens. Furthermore, we provide evidence that, in vivo, oligoclonality of T cells is confined to the CD8 population. Methods. Patients and samples Peripheral blood samples and tumor biopsies were collected during surgery from 16 Caucasian patients with grade III or grade IV malignant astrocytomas. Patients (four females and 12 males) were 35–85 years old, mean 6 SD: 57 6 15 years. PBMC were separated by Ficoll-Hypaque (Pharmacia, Uppsala, Sweden) density gradient centrifugation. Small pieces of the tumor biopsy were washed with PBS. PBMC and tumor biopsies were frozen and cryopreserved in liquid nitrogen for subsequent RNA extraction. When sufficient material was available (patients Ge10, Ge20 and Ge123), the rest of the tumor sample was processed to obtain single-cell suspensions (see below). Patients’ PBMC were characterized for their HLA alleles by serology, by PCR and subsequent oligonucleotide hybridization (44) or by PCR using sequencespecific primers (45).. TCRAV and TCRBV gene segment usage TCRAV and TCRBV gene segment usage was determined by RT-PCR as previously described (46). Briefly, total RNA was prepared from tumor (0.2–0.5 g tissue) or PBMC (2–53106 cells) using TRIzol (Gibco/BRL, Life Technologies, Paisley, UK) and converted to cDNA by standard methods using reverse transcriptase and an oligo(dT) primer. These cDNAs were amplified in non-saturating PCR conditions (30 cycles) with a panel of experimentally validated 59 sense primers specific for the 22 BV subfamilies or the 29 AV subfamilies and one 39 antisense primer specific for the BC gene segment or the AC gene segment. The specificity of the amplified products were assessed after Southern blotting and hybridization with a labeled BC or AC oligonucleotide, and also by verifying the length of the PCR products with values deduced from the 59 and 39 primer positions. The comparative analysis of each BV or AV product between the different samples was.
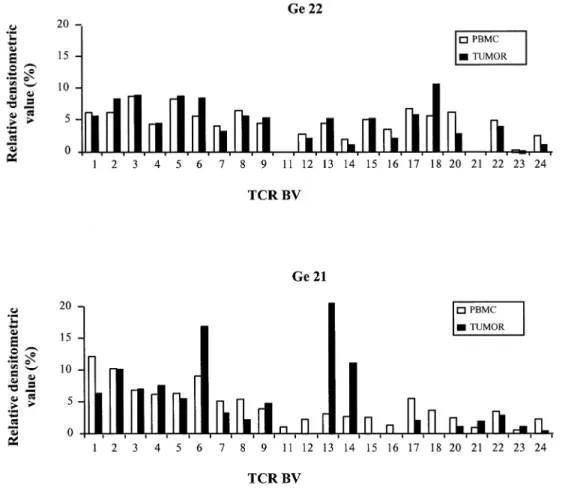
(3) CD81 T cell oligoclonal expansions in human astrocytoma 1339. Fig. 1. Relative TCR BV gene segment expression in astrocytoma and PBMC samples from patients Ge22 and Ge21. Total RNA from uncultured PBMC and tumor samples was reverse transcribed and amplified in non-saturating PCR conditions (30 cycles) using BV and BC primers. The DNA fragments amplified by each BV–BC primer pair were hybridized with a BC oligonucleotide probe. Results are presented according to the new nomenclature (78). For each sample, the autoradiographic spots obtained by Southern blot of PCR amplified TCR BV gene segments were analyzed by densitometry, and each BV signal was calculated as a percentage of the sum of all BV spots and displayed in the histograms.. achieved by densitometric analysis of the signals on the autoradiographs.. CDR3 size analysis of TCRBV transcripts The CDR3 region of the PCR-amplified TCRBV1–22 transcripts was analyzed using a run-off procedure, as previously described (26). Briefly, aliquots (2 µl) of BV1–22–BC PCR products (40 cycles) were subjected to one to three cycle run-off reactions, using dye-labeled oligonucleotide primers, specific for either BC or one of the 13 human functional BJ segments. The run-off products were then run on an automated sequencer in the presence of fluorescent size markers. The length of the DNA fragments and the fluorescence intensity of the bands were analyzed with Immunoscope software (developed by C. Pannetier) or Genescan Analysis software (Applied Biosystems, Forster City, CA).. Sequencing of PCR products TRCBV1–BC PCR products derived from astrocytoma samples were cloned into pBS-SK1 vector (Stratagene, La Jolla, CA). Competent XL-1 blue Escherichia coli (Stratagene). were transformed and plated for blue/white color selection on media containing X-gal. Plasmid DNA was extracted from white colonies using the Qiagen Plasmid Mini-kit (Qiagen, Hilden, Germany) and sequenced using the Dye Terminator Cycle Sequencing kit (ABI PRISM; Perkin Elmer, Foster City, CA) according to the manufacturer’s instructions.. Quantification of BV1 clonal expansions To quantify the respective proportions of recurrent BV1 transcripts in the total BV1 mRNAs, we adopted the approach described elsewhere (27). Briefly, clonotypic primers hybridizing with the CDR3 region of the recurrent BV1 sequences found in the astrocytoma samples were synthesized and labeled with a 6-Fam fluorophore (GENSET, Paris, France). Primer sequences were 59-ATAGGAATTGGACCAGGCTAC-39 for patient Ge10 and 59-GTAAAGCCCCTGTGGATTTAC-39 for patient Ge22. cDNA samples were amplified using a BV1 and a BC primer, then aliquots of the BV1–BC PCR products were subjected to an elongation (one cycle) with either a 6Fam-labeled and nested BC primer (26) or with the clonotypic primer. The two run-off products were then mixed in equal.
(4) 1340 CD81 T cell oligoclonal expansions in human astrocytoma. Fig. 2. CDR3 size distribution profiles of selected TCR BV–BC run-off products from PBMC and tumor RNA samples in eight patients. Total RNA from uncultured PBMC and tumor samples was extracted, reverse transcribed and amplified by PCR using BV and BC primers. Amplified cDNA was copied by a fluorescent BC primer in a run-off reaction and subjected to electrophoresis on an automated sequencer. The patterns obtained show the size and intensity distribution of in frame BV1–BC, BV13–BC, BV14–BC and BV16–BC amplification products. Horizontal axis: size in amino acids of the CDR3 region deduced from the fragment length. Vertical axis: relative fluorescence intensity. The graphs representing CDR3 size patterns were normalized to 100% for the most intense peak. The BV13 profile of Ge33 is reproduced from (19) with permission.. amounts and size-fractionated in the automated sequencer. The proportion of the specific sequence in the total BV1 mRNA population was calculated by dividing the area under the curve (AUC) obtained with the clonotypic primer by the sum of the AUC obtained with the BC primer. The obtained ratio was corrected by the relative specific activity of the clonotypic primer, which was calculated by dividing the AUC obtained with the clonotypic primer by the AUC obtained with the BC primer when amplifying plasmid DNA encoding the recurrent BV1 sequence. The frequency of clonal BV1 cells in tumors was then determined as previously described (47). Briefly, cDNA of astrocytoma samples of interest were co-amplified with serial dilutions of a standard plasmid (105–102 copies). The standard plasmid used displayed .85% homology with the astrocytoma BV1 transcripts but with a shorter CDR3 size (8 amino acids). Regions for primer hybridization were totally identical. Mismatches were located in the CDR3 and BJ regions. The run-off reaction was performed as described. The ratio of the AUC for standard and AUC for astrocytoma samples was calculated in each CDR3 profile, and plotted against the number of standard DNA copies mixed with the cDNA. samples. This allowed the determination of the number of specific clonal transcripts present in 1 µg of tumor RNA.. Purification of CD41 and CD81 T cells Tumor tissue was enzymatically digested for 1–2 h at 37°C in RPMI medium containing 0.1% collagenase type IA, 0.002% DNase type II and 0.05% protease type I. The resulting cell suspensions were centrifuged over a Ficoll-Hypaque gradient (Pharmacia, Uppsala, Sweden) and incubated for 48 h in Iscove’s medium to allow re-expression of CD4 and CD8 molecules degraded by the digestion procedure (G. Perrin, unpublished data). All enzymes were obtained from Sigma (St Louis, MO) and media were from Gibco/BRL, Life Technologies (Paisley, UK). Non-adherent cells were then subjected to triple staining with an FITC–anti-CD3 (clone UCH-T1), a phycoerythrin–anti-CD8 (clone LT8) and a biotinylated antiCD4 antibody (clone B-B14) followed by streptavidin–TriColor (Caltag, Burlingame, CA) and sorted on a FACS Vantage (Becton Dickinson, Mountain View, CA). mAb were purchased from Serotec (Oxford, UK). Equal numbers of sorted CD41 and CD81 T cells were loaded with 106 P815 cells and pelleted for RNA extraction with Qiagen Rneasy Mini-kits.
(5) CD81 T cell oligoclonal expansions in human astrocytoma 1341. Fig. 3. CDR3 size distribution profiles of TCR BV–BC run-off products from distinct tumor regions. For each of the four patients, total RNA was extracted from two different pieces of the tumor biopsy and analyzed as described in Fig. 2. The patterns obtained show the size and intensity distribution of in frame BV–BC amplification products. For each patient, BV–BC profiles that are not represented either include multiple CDR3 lengths or were only at background levels.. (Qiagen). After reverse transcription, CDR3 size analysis was performed on both populations as described above. Results. Diverse TCR AV and BV gene segment usage in astrocytoma patients TCR AV and BV gene segment usage was analyzed in PBMC and tumor samples from the first nine astrocytoma patients. The AV gene segment usage was not restricted (data not shown). Relative expression level of BV gene segments in the tumor biopsies generally did not reveal any significant deviation from the PBMC as illustrated for patient Ge22 in Fig. 1. However, some BV were missing from the tumor sample of certain patients, showing a complete repertoire in the PBMC (e.g. Ge21 in Fig. 1). Among these patients, there was no recurrent pattern of BV overexpression, making stimulation by a putative superantigen unlikely.. Numerous T cell clonal expansions are detected in uncultured astrocytoma samples by CDR3 size analysis Recurrent identical size transcripts of TCR β chains are found after specific T cell clonal expansion in response to defined antigens (26,27,48,49). To further investigate the T cell response in uncultured astrocytoma samples, we used a high-resolution RT-PCR method based on the determination of the spectrum of sizes of the CDR3 regions. Polyclonal T cell populations give rise to a bell-shaped profile of CDR3 size distribution. In contrast, expansion of specific T cell clones over a polyclonal population can be detected by significant perturbations in the CDR3 distribution profiles induced by the accumulation of recurrent size transcripts. In a first step, the CDR3 size variability of TCR BV transcripts was studied in blood and tumor samples from eight astrocytoma patients. BV1–24–BC products were copied with a nested fluorescent BC primer and the size of the fluorescent run-off products was determined by electrophoresis on an automated.
(6) 1342 CD81 T cell oligoclonal expansions in human astrocytoma. Fig. 4. Clonal BV1–BC transcripts with identical CDR3 size observed in astrocytoma samples display a variable BJ gene segment usage and different CDR3 sequences. (A) BV1–BC run-off products from astrocytoma samples of patients Ge22, Ge10 and Ge21 are shown as in Fig. 2. BV1–BC PCR products were copied in 13 different run-off reactions using the 13 BJ-specific labeled primers and subjected to electrophoresis on an automated sequencer. Only the profiles of BV–BJ rearrangements responsible for the 10 amino acids CDR3 peak are indicated. The profiles of other BV–BJ combinations either include multiple CDR3 lengths or were only at background levels. (B) BV1–BC PCR products derived from three astrocytoma samples were cloned and sequenced as described in Methods. CDR3-like boundaries were defined according to (79) and encompass residues 95–106.. DNA sequencer. In the majority of astrocytoma samples, significant perturbations in CDR3 size distribution profiles were found among different BV subfamilies (Fig. 2). In contrast, most (.90%) of the BV–BC PCR products from PBMC displayed a bell-shaped profile with several 3-nucleotide-spaced peaks (see representative patterns from BV1 and BV13; Fig. 2), as found in healthy human donors (50). To exclude the possibility that these peaks reflect stochastic PCR amplification, the reproducibility of the profiles was tested for several tumors, starting either from the same cDNA sample or from cDNA samples derived from different pieces of the tumor. Profiles obtained after different PCR from the same cDNAs yielded identical results (data not shown). Interestingly, CDR3 distribution profiles were highly reproducible in different tumor regions for most patients (as shown for Ge10, Ge03 and Ge87 in Fig. 3), showing that the prominent peaks generally reflect dominant T cell clonal expansions widely represented in the tumor. In contrast, the important variations in CDR3 size profiles observed in Ge21 (Fig. 3) may be a consequence of tumor heterogeneity.. BV1 clonal expansions with identical CDR3 size in different astrocytoma samples The recurrent transcripts inside each BV subfamily usually had different CDR3 sizes in the different samples tested (e.g. BV14 and BV16 in Fig. 2), with the exception of the BV1. subfamily where the majority of overwhelming expansions were due to β chains with the same CDR3 size of 10 amino acids (Ge3, Ge21, Ge22, Ge10, Ge14 and Ge24 in Fig. 2). Further analysis of BV1 transcripts in eight additional malignant astrocytoma RNA samples revealed clonal expansions with a CDR3 size of 10 amino acids in eight of 16 of the patients (data not shown). To further define the clonality of BV1 transcripts and to determine the BJ usage, BV1–BC PCR products from the first eight astrocytoma samples were copied in 13 different run-off reactions using the 13 BJ-specific labeled primers. In seven cases, a single BV1–BJ rearrangement was responsible for the 10 amino acids CDR3 size peak detected at the previous level of analysis using the BC specific labeled primer (Ge22 and Ge21 as representative examples in Fig. 4). However, there is also the possibility that two different BV1–BJ rearrangements can contribute to create such a peak, as in the case of Ge10. The BJ usage was generally different from one sample to another (Fig. 4A and data not shown). Results obtained with the run-off analysis were confirmed by sequencing the BV1–BC PCR products of three astrocytoma samples (Fig. 4B). Alignments of CDR3encoded amino acids indicated the presence of predominant BV1 clonotypes with a CDR3 size of 10 amino acids. However, despite their length homogeneity, the CDR3 regions of recurrent sequences did not include conserved amino acids residues. Moreover, HLA typing of patients’ PBMC did not.
(7) CD81 T cell oligoclonal expansions in human astrocytoma 1343 Table 1. HLA-A, -B and -C class I alleles, and HLA-DRB class II alleles of astrocytoma patients Age (years)/ Diagnosis sex. HLA-A. HLA-B. HLA-C. HLA-DRB1. HLA-DRB3 DRB3*0301 DRB3*02 DRB3*02 DRB3*0101, DRB3*0301 DRB3*0101 DRB3*0101. Ge Ge Ge Ge. 03 08 10 14. 65/F 55/F 64/M 61/M. grade grade grade grade. IV IV III III. A2, A11 A3, A32 A2, A11 A1, A26. B44, B60 B7, B61 B57, B35 B44, B60. Cw*0304, Cw*0501 Cw*0202, Cw*04 Cw*04, Cw*0602 Cw*0501, Cw*0304. DRB1*0701, DRB1*1302 DRB1*14, DRB1*16 DRB1*0402, DRB1*14 DRB1*13, DRB1*x. Ge Ge Ge Ge Ge Ge Ge Ge Ge Ge Ge Ge. 20 21 22 24 33 34 57 78 85 87 90 123. 69/M 41/F 73/M 38/M 71/M 54/M 69/M 35/M 85/M 39/M 36/F 56/M. grade grade grade grade grade grade grade grade grade grade grade grade. IV IV IV III IV IV IV IV IV III III III. A24, A25 A1, A2 A1, A2 A28, A32 A2, A24 A*03, A*32 A*0201, A*23 A*0205 A*11, A*30 A*02, A*0301 A*02, A*11 A*02, A*0301. B7, B18 B8, B27 B44, B17 B44, B62 B51, B35 B*07, B*15 B*4403, B*39 B*41, B*58 B*13, B*51,52 B*07, B*4001 B*07, B*35 B*07, B*40. Cw*0702, Cw*1203 Cw*0102, Cw*0701 Cw*0501, Cw*0602 Cw*0602, Cw*0302/04 Cw*04, Cw*1502/03 Cw*0702, Cw*0303 Cw*04, Cw*0702 Cw*17, Cw*0701 Cw*0602, Cw*1202 Cw*0304, Cw*07 Cw*04, Cw*0702 Cw*0202, Cw*07. DRB1*0301, DRB1*08 DRB1*01, DRB1*0301 DRB1*04, DRB1*0701 DRB1*0102, DRB1*04 DRB1*15, DRB1*11 DRB1*0101, DRB1*1501 DRB1*04, DRB1*x DRB1*11, DRB1*13 DRB1*0701, DRB1*1502 DRB1*04, DRB1*1501 DRB1*11, DRB1*1501 DRB1*11, DRB1*13. DRB3*02 DRB3*02, DRB3*0301 DRB3*02 DRB3*02, DRB3*0301. Grade IV, glioblastoma; grade III, anaplasic astrocytoma.. reveal any obvious correlation with particular HLA haplotypes (Table 1).. Some T cell clones are highly expanded in astrocytoma Despite the absence of sequence homology, the presence of clonal BV1 transcripts with the same CDR3 size in a high proportion of astrocytoma samples was an unexpected observation needing further investigation, particularly since multiple sampling of the same tumors suggested that many of these clones were quite widely distributed within the tumor. The proportion of infiltrating T cells bearing such a receptor among the total tumor infiltrating lymphocyte (TIL) population was determined in two steps using quantitative PCR assays (47). First, the proportion of the recurrent BV1 transcripts in the total BV1 mRNAs was determined for patients Ge10 and Ge22 using a clonotypic primer hybridizing with the CDR3 region of the recurrent BV1 sequence (Fig. 4B) as previously described (27). The BV1 clone with a CDR3 size of 10 amino acids in patient Ge10 represented 53 and 41% of the total BV1 mRNAs in two independent samples from different regions of the tumor, whereas it was undetectable in autologous PBMC. In the case of Ge22, 70% of the total BV1 RNA population was accounted for by a T cell clonal expansion with a CDR3 size of 10 amino acids (data not shown). Based on these latter data, we calculated the number of clonal BV1 transcripts per µg of astrocytoma RNA, using a competitive RT-PCR assay (47). Aliquots of cDNA corresponding to 20 ng tumor RNA were co-amplified with defined copies numbers of a standard BV1 plasmid displaying high homology (.90%) with the astrocytoma clonal BV1 transcripts. Both templates were distinguishable based on their six nucleotides difference in CDR3 length (Fig. 5A). The ratio of the intensities of the two peaks (at different quantities of standard plasmid) yielded the number of BV1 transcripts with a CDR3 size of 10 amino acids (Fig. 5). By integrating the percentage of the clonotype of interest among these transcripts, we found that. 142,000 and 111,500 clonal BV1 transcripts were contained in 1 µg astrocytoma Ge22 and Ge10 RNA samples respectively. Assuming that a T cell contains ~400 TCR β transcripts (51), we estimated 350 and 280 clonal BV1 T cells per µg RNA in the two samples tested respectively. Considering that 1 µg RNA corresponds to 105–106 cells and that T cells represent 0.1–1% of the entire cell population as determined by FACS (G. Perrin, unpublished results), the BV1 clonal cells in Ge22 and Ge10 can be estimated to represent at least 3.5% (350/10,000) and 2.8% (280/10,000) of all TIL respectively.. Most expanded clones in astrocytoma are CD81 cells We determined whether in vivo expanded T cell clones were of CD41 or CD81 phenotype by flow cytometric sorting of CD31CD41 and CD31CD81 T cell populations from dissociated tumors. CDR3 size analysis was performed on both populations and compared with results obtained from nondissociated astrocytoma RNA samples. Figure 6 shows that, for patient Ge10, all predominant peaks detected in the tumor biopsy segregated with the CD8 marker. To definitively demonstrate that the expanded cells detected in the CD81 population corresponded to the expanded clones detected in the unmanipulated biopsy, BV1, BV4 and BV14 transcripts from the tumor biopsy were sequenced, and clonotypic primers specific for the CDR3 region of the recurrent sequences identified were synthesized. cDNAs derived from CD41 and CD81 sorted cells were subjected to the run-off analysis with the clonotypic primers. All three clones clearly appeared in the CD81 cells as shown for the BV1 clone in Fig. 7. The same CD4/CD8 sorting experiment was performed in two other astrocytoma samples. With the exception of one minor peak found in CD41 cells, the other five oligoclonal expansions analyzed in these two additional patients segregated with the CD8 marker (data not shown)..
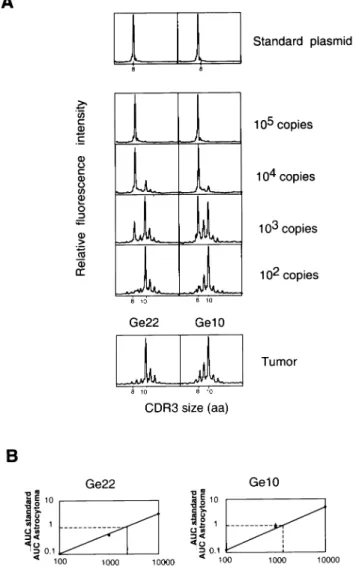
(8) 1344 CD81 T cell oligoclonal expansions in human astrocytoma. Fig. 5. Frequency of clonal BV1 T cells in Ge22 and Ge10 astrocytoma samples. (A) Copies (105) of the standard plasmid were amplified using BV1 and BC primers. PCR products were copied by a fluorescent BC primer in a run-off reaction (one cycle) and subjected to electrophoresis on an automated sequencer. The CDR3 size pattern obtained confirmed the clonality of the plasmid with a CDR3 size at 8 amino acids. The CDR3 profiles obtained for the astrocytoma samples Ge22 and Ge10 are shown as in Fig. 2 to facilitate the comparison. cDNA corresponding to 20 ng tumor RNA was coamplified with serial dilutions of the standard plasmid (from 105 to 102 copies). Note the progressive appearance of the peak with a CDR3 size at 10 amino acids. (B) The ratio of AUC for standard and AUC for astrocytoma samples was calculated in each CDR3 profile, and plotted against the number of standard DNA copies mixed with Ge10 or Ge22 cDNA respectively.. Discussion. T cell clonal expansions are detected in human malignant astrocytoma In this work, we studied the TCR diversity of T lymphocytes in tumor and blood samples collected from Caucasian astrocytoma patients. By analyzing CDR3 size variability, several T cell (oligo)clonal expansions were observed within different. BV subfamilies in all 16 astrocytoma biopsies tested, consistent with immune responses to astrocytoma antigens. In contrast to this local reaction seen in the tumor bed, a systemic immune response was not obvious, since only exceptional (oligo)clonal expansions were detected in PBMC. It is therefore unlikely that T cells clonally expanded in astrocytoma are the direct consequence of blood expansions, such as those observed in certain healthy people (28,50,52). This was further supported by data obtained with clonotypic primers, showing that T cell clones highly represented in the tumor were not detectable in autologous PBMC [below the threshold of detection of the PCR, estimated at 1 in 105 (50)]. The T cell clonal expansions found in our study showed conserved TCR structural features in certain cases (e.g. many BV1 expansions with identical CDR3 size), but never conserved CDR3 sequences. This contrasts with previous TCR molecular analysis of astrocytoma infiltrating lymphocytes (but of nonCaucasian patients) reporting preferential AV7 and BV13 gene segment usage, with an identical BV13 transcript in different astrocytoma samples (53,54). In our series of Caucasian patients, this recurrent BV13 sequence was never detected in eight astrocytoma samples, including two patients expressing HLA-A24, the haplotype commonly (but not exclusively) associated with the recurrent TCR previously described (54) (G. Perrin, unpublished observations). Intratumoral T cell clonal expansions have been reported in various types of cancers (4,7,8,55,56). Their presence in a tumor arising in the brain (i.e. astrocytoma) is more surprising. Indeed, the immune response in the CNS is tightly regulated to avoid deleterious consequences (57,58) and astrocytomas may exert immunosuppressive effects via soluble factors (59) or intercellular interactions (60). It was therefore interesting to evaluate the magnitude of unique T cell clonal expansions present in astrocytoma. Quantification of clonal TCR transcripts revealed that each expanded T cell clone analyzed was important in terms of absolute cell number and its frequency among TIL. The estimation of the cell numbers was confirmed by an independent experiment in which a tumor RNA sample was mixed with a defined number of PBMC (G. Perrin, data not shown). Other experimental data substantiate the importance of these results. In vivo expanded T cells detected by molecular analysis were found in significant proportions among in vitro derived clones generated by direct cloning of TIL from the tumor digestion (G. Perrin, unpublished data). Furthermore, the reproducibility of the BV–BC profiles and the detection of the same clonotypes in different areas of a given tumor (Fig. 2 and data not shown) indicate that such clones can be widely distributed within astrocytoma. Overall, even if lymphocytic infiltration is not as overwhelming as found in certain other tumors (e.g. melanoma, renal cell cancer), these data suggest that astrocytoma may induce specific immune responses despite their intracerebral location. The identification of the in vivo expanded T cell populations by TCR molecular analysis guides our choice of T cell clones for expansion in vitro, and subsequent testing of specificity and function. For instance, CD81 BV11, BV41 and BV141 clones from patient Ge10 are very attractive candidates to identify the antigens recognized (61), and have already been expanded in vitro (G. Perrin, unpublished data)..
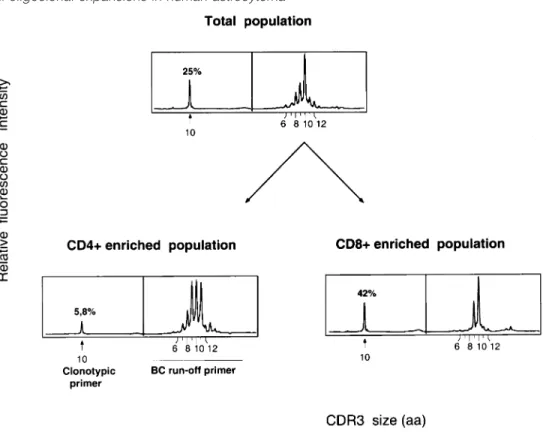
(9) CD81 T cell oligoclonal expansions in human astrocytoma 1345. Fig. 6. Oligoclonal expansions are preferentially found in the CD8 subset. CD41 and CD81 T cells were sorted from the tumor biopsy after enzymatic digestion as described in Methods. cDNAs derived from CD41 and CD81 T cells were amplified using appropriate BV primers and analyzed as described in Fig. 2.. Significance of conserved CDR3 size Structural conservation of the TCR critical region for peptide recognition might reflect repertoire selection by a common MHC–peptide complex. Indeed, although TCR repertoires against defined epitopes were shown to exhibit variable levels of diversity (62), the CDR3 length was conserved over primary and memory responses with a restricted T cell repertoire (49,63). In human diseases, some restriction in CDR3 size variability was also reported in CD81 T cells specific for HIV (64). Moreover, in vitro stimulation of lymphocytes with autologous tumor cells in mixed lymphocyte tumor cell culture assays can generate T cell clones sharing common BV gene segments and CDR3 sizes but different CDR3 sequences (65). Overall, these observations suggest that CDR3 length homogeneity may be a useful indicator of specific cells to unknown peptidic antigens (49,63,64). In this study, the CDR3 sizes of BV T cell clones were random, except those present in the BV1 subfamily in which a CDR3 size of 10 amino acids was found in 50% of the astrocytoma samples. However, the presence of these BV1 clones with conserved CDR3 size was apparently not correlated with a given HLA allele and we did not find any conserved amino acids motif in the different CDR3 sequences. We do not have a direct explanation for this intriguing result but it may be interesting to analyze whether it reflects a response driven by antigens presented by nonclassical MHC molecules such as CD1 (66).. T cell clones detected ex vivo by molecular analysis are CD81 Recent experimental data have highlighted the importance of a synergistic action of CD41 and CD81 T cells for the induction of protective immunity in the CNS (14–17). In the second part of our study, we asked whether T cells of both subsets were clonally expanded in human astrocytoma. Previous studies have shown that both CD41- and CD81specific T cell responses against defined antigens can be detected in vivo by the appearance of certain BV populations with restricted CDR3 size diversity (27,48,67). Consequently,. the CD4/CD8 phenotype of the in vivo expanded T cell clones was defined by repeating the TCR molecular analysis on CD41 and CD81 T lymphocytes sorted from three dissociated astrocytomas. Although T cells of both subsets were found among TIL (CD81 cells: 30–55% ; CD41 cells: 45–70%), expanded T cell clones were almost exclusively confined to the CD81 subset, as definitively assessed with clonotypic primers. The lack of obvious CD41 T cell clonal expansions might be the direct consequence of the low or absent constitutive MHC class II expression by the CNS cells (68). However, the expression of MHC molecules is a dynamic process and can be induced in vitro on several CNS cell types (e.g. microglial cells, endothelial cells, smooth muscle/ pericyte cells, astrocytes) that may potentially exhibit antigen-presenting cell (APC) functions (58). Similar events may also take place in vivo under the influence of microenvironmental factors (e.g. cytokines, neuropeptides) and indeed, specific CD41 T cells accumulate in the brain following infection or autoimmune disease (69–72). It is therefore unlikely that low MHC class II expression is the sole explanation for our observations. Other hypotheses may be envisaged. Firstly, the presence of specific CD41 cells with very broad CDR3 diversity that would have been undetectable by our approach cannot be formally excluded. Direct cloning of CD41 TIL and subsequent testing of CD41 clones for specificity is currently being performed to address this question. Secondly, the lack of CD41 clonal expansions may suggest functionally deficient APC, as described for dendritic cells present in skin and colon cancers (73). Finally, the present results have to be considered in the light of the new ‘licensing’ model proposed for CD41 help (74), in which CD41 T cells would be needed to activate inefficient APC (e.g. with low expression levels of MHC and co-stimulatory molecules). This model suggests that CD41 and CD81 cells could be sequentially primed at different sites. Therefore, an interesting question to address in the case of astrocytoma is whether oligoclonal expansions of CD41 T cells can be found in cervical lymph nodes that have been proposed to be the site of CNS lymphatic drainage (75)..
(10) 1346 CD81 T cell oligoclonal expansions in human astrocytoma. Fig. 7. Expanded BV1 clone in patient Ge10 segregates with the CD8 marker. CD41 and CD81 T cells were sorted from the tumor biopsy after enzymatic digestion as described in Methods. cDNA derived from CD41 and CD81 T cells was amplified with the BV1 primer. Each product was separated in two equal aliquots: one was used as template for the elongation with the fluorescent BC primer, providing the peaks on the right part of each panel. The other was used in the elongation with the clonotypic primer, providing the single peak on the left. These two run-off products were then mixed and size-fractionated in an automated sequencer. Quantification of the clonotype was performed as described in Methods.. With our current understanding of the importance of CD41 help for the generation of efficient immune responses in the CNS, it is tempting to speculate that the lack of CD41 T cell clonal expansions infiltrating the tumors of these patients may play a role in the ultimate failure of the immune system to control tumor growth. This hypothesis is in accordance with recent data further emphasizing the critical role of CD41 cells for maintaining CD81 function. For example, in transgenic mice expressing ovalbumin in pancreatic β cells, it was reported that the biological effects of specific CD81 cells (i.e. induction of diabetes by destruction of islet cells) were strongly dependent upon the presence of CD41 cells. One possible explanation is that the CD41 T cells can activate APC (74) to induce immunity rather than tolerance (76,77). In a similar way, the oligoclonal CD81 T cells in astrocytoma may reflect transiently expanded populations that are functionally compromised by insufficient CD41 help. It may be interesting to extend this study to a broader panel of patients to see if a CD41 deficiency is a common feature of all astrocytoma. Another interesting question is whether a similar defect is also observed in other human tumors progressing outside the CNS or is restricted to astrocytoma. In summary, this work is the first in-depth characterization of the clonality, the quantity and the phenotype of human astrocytoma infiltrating T cells. The presence of highly. expanded T cell clones in the tumor bed is a strong argument for a spontaneous immune response being initiated against putative astrocytoma antigens, even if insufficient for tumor rejection. Some of these clones are currently being tested for function and specificity, and should help to identify the antigens recognized. An additional new finding of this study is the apparent deficiency in the CD41 response at the site of tumor growth. This observation made in human astrocytoma raises important questions concerning the site of antigen presentation and the cell types involved in this critical biological process. Resolving such questions in animal models may indicate the best ways to reinforce the CD41 T cell help in novel treatment strategies designed to elicit an anti-tumor immune response against CNS tumors.. Acknowledgements We would like to thank A. Lim for helpful discussions, C. Metral for her expert technical help, and Pierre Alberto and Andre´-Pascal Sappino for continuous support and encouragement. We thank the Neurosurgery staff for providing tissue samples. We acknowledge the excellent secretarial assistance of Melissa Morawitz. This work was supported by the Swiss National Science Foundation (to P. Y. D.), la Ligue Genevoise contre le Cancer, les Ligues Suisse et Franc¸aise contre le Cancer, la Fondation Prevost-Martin, the Helmut Horton Stiftung and la Fondation pour la lutte contre le.
(11) CD81 T cell oligoclonal expansions in human astrocytoma 1347 cancer et pour des recherches biologiques. G. P. was supported by la Fondation MEDIC.. Abbreviations APC AUC CDR CNS CTL PBMC TIL. antigen-presenting cell area under the curve complementarity determining region central nervous system cytotoxic T lymphocyte peripheral blood mononuclear cell tumor infiltrating lymphocytes. References 1 Boon, T., Cerottini, J. C., Van den Eynde, B., Van der Bruggen, P. and Van Pel, A. 1994. Tumor antigens recognized by T lymphocytes. Annu. Rev. Immunol. 12:337. 2 Pardoll, D. M. 1995. Paracrine cytokine adjuvants in cancer immunotherapy. Annu. Rev. Immunol. 13:399. 3 Robbins, P. F. and Kawakami, Y. 1996. Human tumor antigens recognized by T cells. Curr. Opin. Immunol. 8:628. 4 Caignard, A., Guillard, M., Gaudin, C., Escudier, B., Triebel, F. and Dietrich, P. Y. 1996. In situ demonstration of renal cell carcinoma specific T-cell clones. Int. J. Cancer 66:564. 5 Kawakami, Y., Eliyahu, S., Delgado, C. H., Robbins, P. F., Sakaguchi, K., Appella, E., Yannelli, J. R., Adema, G. J., Miki, T. and Rosenberg, S. A. 1994. Identification of a human melanoma antigen recognized by tumor-infiltrating lymphocytes associated with in vivo tumor rejection. Proc. Natl Acad. Sci. USA 91:6458. 6 Bakker, A. B., Schreurs, M. W., De Boer, A. J., Kawakami, Y., Rosenberg, S. A., Adema, G. J. and Figdor, C. G. 1994. Melanocyte lineage-specific antigen gp100 is recognized by melanoma-derived tumor-infiltrating lymphocytes. J. Exp. Med. 179:1005. 7 Farace, F., Orlanducci, F., Dietrich, P. Y., Gaudin, C., Angevin, E., Courtier, M. H., Bayle, C., Hercend, T. and Triebel, F. 1994. T cell repertoire in patients with B chronic lymphocytic leukemia. Evidence for multiple in vivo T cell clonal expansions. J. Immunol. 153:4281. 8 Mackensen, A., Carcelain, G., Viel, S., Raynal, M. C., Michalaki, H., Triebel, F., Bosq, J. and Hercend, T. 1994. Direct evidence to support the immunosurveillance concept in a human regressive melanoma. J. Clin. Invest. 93:1397. 9 Marchand, M., Van Baren, N., Weynants, P., Brichard, V., Dreno, B., Tessier, M. H., Rankin, E., Parmiani, G., Arienti, F., Humblet, Y., Bourlond, A., Vanwijck, R., Lienard, D., Beauduin, M., Dietrich, P. Y., Russo, V., Kerger, J., Masucci, G., Jager, E., De Greve, J., Atzpodien, J., Brasseur, F., Coulie, P. G., Van der Bruggen, P. and Boon, T. 1999. Tumor regressions observed in patients with metastatic melanoma treated with an antigenic peptide encoded by gene MAGE-3 and presented by HLA-A1. Int. J. Cancer 80:219. 10 Rosenberg, S. A., Yang, J. C., Schwartzentruber, D. J., Hwu, P., Marincola, F. M., Restifo, N. P., Dudley, M. E., Scwarz, S. L., Spiess, P. J., Wunderlich, J. R., Parkhurst, M. R., Kawakami, Y., Seipp, C. A., Einhorn, J. H. and White, D. E. 1998. Immunologic and therapeutic evaluation of a synthetic peptide vaccine for the treatment of patients with metastatic melanoma. Nat. Med. 4:321. 11 Nestle´, F. O., Alijagic, S., Gilliet, M., Sun, Y., Grabbe, S., Dummer, R., Burg, G. and Schadendorf, D. 1998. Vaccination of melanoma patients with peptide- or tumor lysate-pulsed dendritic cells. Nat. Med. 4:328. 12 Ballen, K. and Stewart, F. M. 1997. Adoptive immunotherapy. Curr. Opin. Oncol. 9:579. 13 Claret, E. J., Alyea, E. P., Orsini, E., Pickett, C. C., Collins, H., Wang, Y., Neuberg, D., Soiffer, R. J. and Ritz, J. 1997. Characterization of T cell repertoire in patients with graft- versusleukemia after donor lymphocyte infusion. J. Clin. Invest. 100:855. 14 Stohlman, S. A., Bergmann, C. C., Lin, M. T., Cua, D. J. and Hinton, D. R. 1998. CTL effector function within the central nervous system requires CD41 T cells. J. Immunol. 160:2896.. 15 Lin, X., Pease, L. R., Murray, P. D. and Rodriguez, M. 1998. Theiler’s virus infection of genetically susceptible mice induces central nervous system-infiltrating CTLs with no apparent viral or major myelin antigenic specificity. J. Immunol. 160:5661. 16 Hom, R. C., Finberg, R. W., Mullaney, S. and Ruprecht, R. M. 1991. Protective cellular retroviral immunity requires both CD41 and CD81 immune T cells. J. Virol. 65:220. 17 Murali-Krishna, K., Ravi, V. and Manjunath, R. 1996. Protection of adult but not newborn mice against lethal intracerebral challenge with Japanese encephalitis virus by adoptively transferred virusspecific cytotoxic T lymphocytes: requirement for L3T41 T cells. J. Gen. Virol. 77:705. 18 Hitchcock, E. R. and Morris, C. S. 1988. Mononuclear cell infiltration in central portions of human astrocytomas. J. Neurosurg. 68:432. 19 Dietrich, P.-Y., Walker, P. R., Schnuriger, V., Saas, P., Guillard, M., Gaudin, C. and Caignard, A. 1997. T cell repertoire analysis reveals significant repertoire selection during in vitro lymphocyte culture. Int. Immunol. 9:1073. 20 Miescher, S., Whiteside, T. L., de Tribolet, N. and Von Fliedner, V. 1988. In situ characterization, clonogenic potential, and antitumor cytolytic activity of T lymphocytes infiltrating human brain cancers. J. Neurosurg. 68:438. 21 Moss, P. A., Rowland-Jones, S. L., Frodsham, P. M., McAdam, S., Giangrande, P., McMichael, A. J. and Bell, J. I. 1995. Persistent high frequency of human immunodeficiency virus-specific cytotoxic T cells in peripheral blood of infected donors. Proc. Natl Acad. Sci. USA 92:5773. 22 McMichael, A. J. and O’Callaghan, C. A. 1998. A new look at T cells. J. Exp. Med. 187:1367. 23 Ward, E. S. and Qadri, A. 1997. Biophysical and structural studies of TCRs and ligands: implications for T cell signaling. Curr. Opin. Immunol. 9:97. 24 Garcia, K. C., Degano, M., Pease, L. R., Huang, M., Peterson, P. A., Teyton, L. and Wilson, I. A. 1998. Structural basis of plasticity in T cell receptor recognition of a self peptide–MHC antigen. Science 279:1166. 25 McHeyzer-Williams, M. G., Altman, J. D. and Davis, M. M. 1996. Tracking antigen-specific helper T cell responses. Curr. Opin. Immunol. 8:278. 26 Pannetier, C., Even, J. and Kourilsky, P. 1995. T-cell repertoire diversity and clonal expansions in normal and clinical samples. Immunol. Today 16:176. 27 Levraud, J. P., Pannetier, C., Langlade-Demoyen, P., Brichard, V. and Kourilsky, P. 1996. Recurrent T cell receptor rearrangements in the cytotoxic T lymphocyte response in vivo against the P815 murine tumor. J. Exp. Med. 183:439. 28 Schwab, R., Szabo, P., Manavalan, J. S., Weksler, M. E., Posnett, D. N., Pannetier, C., Kourilsky, P. and Even, J. 1997. Expanded CD41 and CD81 T cell clones in elderly humans. J. Immunol. 158:4493. 29 Allan, W., Tabi, Z., Cleary, A. and Doherty, P. C. 1990. Cellular events in the lymph node and lung of mice with influenza. Consequences of depleting CD41 T cells. J. Immunol. 144:3980. 30 Buller, R. M., Holmes, K. L., Hugin, A., Frederickson, T. N. and Morse, H. C., III. 1987. Induction of cytotoxic T-cell responses in vivo in the absence of CD4 helper cells. Nature 328:77. 31 Lin, Y., Langman, R. and Cohn, M. 1992. The priming of cytotoxic T-cell precursors is strictly helper T cell-dependent. Scand. J. Immunol. 35:621. 32 Jennings, S. R., Bonneau, R. H., Smith, P. M., Wolcott, R. M. and Chervenak, R. 1991. CD4-positive T lymphocytes are required for the generation of the primary but not the secondary CD8positive cytolytic T lymphocyte response to herpes simplex virus in C57BL/6 mice. Cell. Immunol. 133:234. 33 Karupiah, G., Buller, R. M., Van Rooijen, N., Duarte, C. J. and Chen, J. 1996. Different roles for CD41 and CD81 T lymphocytes and macrophage subsets in the control of a generalized virus infection. J. Virol. 70:8301. 34 Zajac, A. J., Murali-Krishna, K., Blattman, J. N. and Ahmed, R. 1998. Therapeutic vaccination against chronic viral infection: the importance of cooperation between CD41 and CD81 T cells. Curr. Opin. Immunol. 10:444..
(12) 1348 CD81 T cell oligoclonal expansions in human astrocytoma 35 Ostrand-Rosenberg, S., Thakur, A. and Clements, V. 1990. Rejection of mouse sarcoma cells after transfection of MHC class II genes. J. Immunol. 144:4068. 36 Yoshimura, A., Shiku, H. and Nakayama, E. 1993. Rejection of an IA1 variant line of FBL-3 leukemia by cytotoxic T lymphocytes with CD41 and CD4–CD8– T cell receptor-alpha beta phenotypes generated in CD8-depleted C57BL/6 mice. J. Immunol. 150:4900. 37 Van den Eynde, B. J. and Van der Bruggen, P. 1997. T cell defined tumor antigens. Curr. Opin. Immunol. 9:684. 38 Topalian, S. L., Gonzales, M. I., Parkhurst, M., Li, Y. F., Southwood, S., Sette, A., Rosenberg, S. A. and Robbins, P. F. 1996. Melanoma-specific CD41 T cells recognize nonmutated HLA-DR-restricted tyrosinase epitopes. J. Exp. Med. 183:1965. 39 Bosch, G. J., Joosten, A. M., Kessler, J. H., Melief, C. J. and Leeksma, O. C. 1996. Recognition of BCR-ABL positive leukemic blasts by human CD41 T cells elicited by primary in vitro immunization with a BCR-ABL breakpoint peptide. Blood 88:3522. 40 Fan, S. T. and Edgington, T. S. 1989. Sufficiency of the CD8 1 T cell lineage to mount an effective tumoricidal response to syngeneic tumor-bearing novel class I MHC antigens. J. Immunol. 143:4287. 41 Townsend, S. E. and Allison, J. P. 1993. Tumor rejection after direct costimulation of CD81 T cells by B7-transfected melanoma cells. Science 259:368. 42 Sampson, J. H., Archer, G. E., Ashley, D. M., Fuchs, H. E., Hale, L. P., Dranoff, G. and Bigner, D. D. 1996. Subcutaneous vaccination with irradiated, cytokine-producing tumors cells stimulates CD81 cell-mediated immunity against tumors located in the ‘immunologically privileged’ central nervous system. Proc. Natl Acad. Sci. USA 93:10399. 43 Bour, H., Horvath, C., Lurquin, C., Cerottini, J. C. and MacDonald, H. R. 1998. Differential requirement for CD4 help in the development of an antigen-specific CD81 T cell response depending on the route of immunization. J. Immunol. 160:5522. 44 Cros, P., Allibert, P., Mandrand, B., Tiercy, J. M. and Mach, B. 1992. Oligonucleotide genotyping of HLA polymorphism on microtitre plates. Lancet 340:870. 45 Sadler, A. M., Petronzelli, F., Krausa, P., Marsh, S. G., Guttridge, M. G., Browning, M. J. and Bodmer, J. G. 1994. Low-resolution DNA typing for HLA-B using sequence-specific primers in alleleor group-specific ARMS/PCR. Tissue Antigens 44:148. 46 Genevee, C., Diu, A., Nierat, J., Caignard, A., Dietrich, P. Y., Ferradini, L., Roman-Roman, S., Triebel, F. and Hercend, T. 1992. An experimentally validated panel of subfamily-specific oligonucleotide primers (V alpha 1-w29/v beta 1-w24) for the study of human T cell receptor variable V gene segment usage by polymerase chain reaction. Eur. J. Immunol. 22:1261. 47 Pannetier, C., Delassus, S., Darche, S., Saucier, C. and Kourilsky, P. 1993. Quantitative titration of nucleic acids by enzymatic amplification reactions run to saturation. Nucleic Acids Res. 21:577. 48 Cochet, M., Pannetier, C., Regnault, A., Darche, S., Leclerc, C. and Kourilsky, P. 1992. Molecular detection and in vivo analysis of the specific T cell response to a protein antigen. Eur. J. Immunol. 22:2639. 49 McHeyzer-Williams, M. G. and Davis, M. M. 1995. Antigenspecific development of primary and memory T cells in vivo. Science 268:106. 50 Even, J., Lim, A., Puisieux, I., Ferradini, L., Dietrich, P. Y., Toubert, A., Hercend, T., Triebel, F., Pannetier, C. and Kourilsky, P. 1995. T-cell repertoires in healthy and diseased human tissues analysed by T-cell receptor beta-chain CDR3 size determination: evidence for oligoclonal expansions in tumours and inflammatory diseases. Res. Immunol. 146:65. 51 Regnault, A., Levraud, J. P., Lim, A., Six, A., Moreau, C., Cumano, A. and Kourilsky, P. 1996. The expansion and selection of T cell receptor alpha beta intestinal intraepithelial T cell clones. Eur. J. Immunol. 26:914. 52 Naumov, Y. N., Naumova, E. N. and Gorski, J. 1996. CD41 and CD81 circulating alpha/beta T-cell repertoires are equally complex and are characterized by different levels of steady-state TCR expression. Hum. Immunol. 48:52. 53 Ebato, M., Nitta, T., Yagita, H., Sato, K. and Okumura, K. 1993. Skewed distribution of TCR V alpha 7-bearing T cells within. 54. 55 56. 57 58 59. 60. 61. 62 63. 64. 65. 66 67. 68 69 70. 71. tumor-infiltrating lymphocytes of HLA-A24(9)-positive patients with malignant glioma. Immunol. Lett. 39:53. Ebato, M., Nitta, T., Yagita, H., Sato, K. and Okumura, K. 1994. Shared amino acid sequences in the NDbetaN and Nalpha regions of the T cell receptors of tumor-infiltrating lymphocytes within malignant glioma. Eur. J. Immunol. 24:2987. Sensi, M. and Parmiani, G. 1995. Analysis of TCR usage in human tumors: a new tool for assessing tumor-specific immune responses. Immunol. Today 16:588. Caignard, A., Dietrich, P. Y., Morand, V., Lim, A., Pannetier, C., Leridant, A. M., Hercend, T., Even, J., Kourilsky, P. and Triebel, F. 1994. Evidence for T-cell clonal expansion in a patient with squamous cell carcinoma of the head and neck. Cancer Res. 54:1292. Owens, T., Renno, T., Taupin, V. and Krakowski, M. 1994. Inflammatory cytokines in the brain: does the CNS shape immune responses? Immunol. Today 15:566. Fabry, Z., Raine, C. S. and Hart, M. N. 1994. Nervous tissue as an immune compartment: the dialect of the immune response in the CNS. Immunol. Today 15:218. Weller, M. and Fontana, A. 1995. The failure of current immunotherapy for malignant glioma. Tumor- derived TGF-beta, T-cell apoptosis, and the immune privilege of the brain. Brain Res. Rev. 21:128. Saas, P., Walker, P. R., Hahne, M., Quiquerez, A.-L., Schnuriger, V., Perrin, G., French, L., Van Meir, E. G., de Tribolet, N., Tschopp, J. and Dietrich, P. Y. 1997. Fas Ligand expression by astrocytoma in vivo: maintaining immune privilege in the brain? J. Clin. Invest. 99:1173. Van der Bruggen, P., Traversari, C., Chomez, P., Lurquin, C., De Plaen, E., Van den Eynde, B., Knuth, A. and Boon, T. 1991. A gene encoding an antigen recognized by cytolytic T lymphocytes on a human melanoma. Science 254:1643. Casanova, J.-L. and Maryanski, J. L. 1993. Antigen-selected T-cell receptor diversity and self-nonself homology. Immunol. Today 14:391. Maryanski, J. L., Jongeneel, C. V., Bucher, P., Casanova, J. L. and Walker, P. R. 1996. Single-cell PCR analysis of TCR repertoires selected by antigen in vivo: a high magnitude CD8 response is comprised of very few clones. Immunity 4:47. Pantaleo, G., Demarest, J. F., Soudeyns, H., Graziosi, C., Denis, F., Adelsberger, J. W., Borrow, P., Saag, M. S., Shaw, G. M., Sekaly, R. P., et al. 1994. Major expansion of CD81 T cells with a predominant V beta usage during the primary immune response to HIV. Nature 370:463. Maccalli, C., Farina, C., Sensi, M., Parmiani, G. and Anichini, A. 1997. TCR beta-chain variable region-driven selection and massive expansion of HLA-class I-restricted antitumor CTL lines from HLA-A*02011 melanoma patients. J. Immunol. 158:5902. Porcelli, S. A., Segelke, B. W., Sugita, M., Wilson, I. A. and Brenner, M. B. 1998. The CD1 family of lipid antigen-presenting molecules. Immunol. Today 19:362. Cibotti, R., Cabaniols, J. P., Pannetier, C., Delarbre, C., Vergnon, I., Kanellopoulos, J. M. and Kourilsky, P. 1994. Public and private V beta T cell receptor repertoires against hen egg white lysozyme (HEL) in nontransgenic versus HEL transgenic mice. J. Exp. Med. 180:861. Lampson, L. A. 1995. Interpreting MHC class I expression and class I/class II reciprocity in the CNS: reconciling divergent findings. Microsc. Res. Tech. 32:267. Xue, S. and Perlman, S. 1997. Antigen specificity of CD4 T cell response in the central nervous system of mice infected with mouse hepatitis virus. Virology 238:68. Pope, J. G., Karpus, W. J., Vander Lugt, C. and Miller, S. D. 1996. Flow cytometric and functional analyses of central nervous system-infiltrating cells in SJL/J mice with Theiler’s virus-induced demyelinating disease. Evidence for a CD41 T cell-mediated pathology. J. Immunol. 156:4050. Schluter, D., Oprisiu, S. B., Chahoud, S., Weiner, D., Wiestler, O. D., Hof, H. and Deckert-Schluter, M. 1995. Systemic immunization induces protective CD41 and CD81 T cell- mediated immune responses in murine Listeria monocytogenes meningoencephalitis. Eur. J. Immunol. 25:2384..
(13) CD81 T cell oligoclonal expansions in human astrocytoma 1349 72 Renno, T., Zeine, R., Girard, J. M., Gillani, S., Dodelet, V. and Owens, T. 1994. Selective enrichment of Th1 CD45RBlow CD41 T cells in autoimmune infiltrates in experimental allergic encephalomyelitis. Int. Immunol. 6:347. 73 Chaux, P., Moutet, M., Faivre, J., Martin, F. and Martin, M. 1996. Inflammatory cells infiltrating human colorectal carcinomas express HLA class II but not B7-1 and B7-2 costimulatory molecules of the T-cell activation. Lab. Invest. 74:975. 74 Ridge, J. P., Di Rosa, F. and Matzinger, P. 1998. A conditioned dendritic cell can be a temporal bridge between a CD41 T-helper and a T-killer cell. Nature 393:474. 75 Cserr, H. F. and Knopf, P. M. 1992. Cervical lymphatics, the. 76 77 78 79. blood–brain barrier and the immunoreactivity of the brain: a new view. Immunol. Today 13:507. Carbone, F. R., Kurts, C., Bennett, S. R. M., Miller, J. F. A. P. and Heath, W. R. 1998. Cross-presentation: a general mechanism for CTL immunity and tolerance. Immunol. Today 19:368. Heath, W. R., Kurts, C., Miller, J. F. A. P. and Carbone, F. R. 1998. Cross-tolerance: a pathway for inducing tolerance to peripheral tissue antigens. J. Exp. Med. 187:1549. Arden, B., Clark, S. P., Kabelitz, D. and Mak, T. W. 1995. Human T-cell receptor variable gene segment families. Immunogenetics 42:455. Chothia, C., Boswell, D. R. and Lesk, A. M. 1988. The outline structure of the T-cell alpha beta receptor. EMBO J. 7:3745..
(14)
Figure


+5


Documents relatifs