ORIGINAL PAPER
A miniature mass analyser for in-situ elemental analysis
of planetary material
–performance studies
M. Tulej&M. Iakovleva&I. Leya&P. Wurz
Received: 13 August 2010 / Revised: 1 November 2010 / Accepted: 2 November 2010 / Published online: 25 November 2010 # Springer-Verlag 2010
Abstract The performance of a laser ablation mass analyser designed for in-situ exploration of the chemical composition of planetary surfaces has been investigated. The instrument measures the elemental and isotopic composition of raw solid materials with high spatial resolution. The initial studies were performed on NIST standard materials using IR laser irradiance (< 1 GW cm−2) at which a high temporal stability of ion formation and sufficiently low sample consumption was achieved. Mea-surements of highly averaged spectra could be performed with typical mass resolution of m/Δm ≈ 600 in an effective dynamic range spanning seven decades. Sensitive detection of several trace elements can be achieved at the ~ ppm level and lower. The isotopic composition is usually reproduced with 1% accuracy, implying good performance of the instrument for quantitative analysis of the isotopic fraction-ation effects caused by natural processes. Using the IR laser, significant elemental fractionation effects were ob-served for light elements and elements with a high ionization potential. Several diatomic clusters of major and minor elements could also be measured, and sometimes these interfere with the detection of trace elements at the same nominal mass. The potential of the mass analyser for application to sensitive detection of elements and their isotopes in realistic samples is exemplified by measurements of minerals. The high resolution and large dynamic range of the spectra makes detection limits of ~100 ppb possible.
Keywords Time-of-flight mass spectrometer . Laser ablation . Elemental analysis . Meteorite composition . Planetary surfaces
Introduction
Exploration of surfaces of a variety of solar bodies will be of primary importance in future planetary missions [1]. Scientific objectives of these missions include discovering the origin and history of the planetary material and searches for possible past and present live activity. Laser ablation time-of-flight mass spectrometry is regarded as an impor-tant analytical technique for investigation of the chemical composition of planetary material [2]. Laser ablation mass analyzers (LA-MA, also known as LAMMA) can measure elemental (isotopic) composition of solids in situ, providing means of quantitative analysis. Application of mass spectrometry in space is steadily increasing with techno-logical developments in construction and detection effi-ciency, and improvements of ion sources. Recently, remarkable miniaturisation of laser ablation mass analysers has been achieved in several laboratories, and satisfies the strict resource limitations of missions landing on solar bodies [3–5]. Performance tests for a few space prototype mass analysers show that the salient features of laboratory systems can be maintained in instruments designed for use in space. The mass spectrometric analysis can be performed with high spatial resolution and sensitivity for detection of almost all elements. Simplicity of operation, low power consumption, and robust design make them advantageous over other analytical instruments considered for planetary exploration (e.g., X and gamma-ray spectroscopy, laser-induced breakdown spectroscopy, LIBS). The instrument can probe the material with high lateral and vertical Published in the special issue Laser Ablation with Guest Editors
Detlef Günther and Jan Fietzke.
M. Tulej (*)
:
M. Iakovleva:
I. Leya:
P. Wurz Space Research and Planetology, Institute of Physics, Sidlerstrasse 5, University Bern,3012 Bern, Switzerland
e-mail: [email protected] DOI 10.1007/s00216-010-4411-3
resolution and the microanalysis of grain-size samples in situ can be performed in a straightforward manner just by optical selection of the region of interest from a camera image of the sample surface. Depth profiling analysis of non-altered material can also be performed, yielding information on the processes differentiating the surface material. Identification of minerals forming the planetary surface can be then performed by means of elemental analysis and comparison with laboratory data bases. Mineralogy of rocks, deposits, and dust can be helpful in interpretation of general geology and planetary climates [6]. Measurements of the trace and rare elements can be performed, in principle, with detection sensitivity better than ppm and can deliver data important for investigation of geological origin and the nature of planetary differentiation. Isotopic composition has rarely been explored so far but measurements in situ can deliver key data enabling study of the origin and evolution of the material by means of isotopic differentiation. Age dating from radiogenic ele-ments [7, 8] or investigation of isotopic fractionation caused by biological activity [9] become feasible, at least at a semi-quantitative level. These are of particular interest in searches for activity indicative of life on other solar system bodies. A miniaturised LA–MS can be used to study the molecular composition of surfaces by application of sufficiently low laser irradiance that molecules can be desorbed/ionised without extended fragmentation [10]. Larger mass resolution than typically used in studies on elements is required and, indeed, can be achieved in miniaturised time-of-flight mass analysers [4]. Studies of molecules and their isotopic counterparts, which could be present in sedimentary deposits or on ice surfaces, can be of key importance in assessing the significance of possible biomarkers [11]. Recent laboratory studies show that mass spectrometry can also be used for rapid characterisation of intact microorganisms [12]. The results obtained by use of LA–MS can provide extended information on both the elemental (isotopic) and molecular composition of solar body surfaces and this knowledge will contribute to our understanding of the origin and evolution of the solar system. The potential of TOF instruments for applications in space research was recognized by selection of a relatively large instrument, LIMA D, in the Soviet PHOBOS missions [13]. In the upcoming PHOBOS-GRUNT mission (scheduled for launch in October 2011), a miniaturised LA–MS, the LAZMA instrument, has been selected for elemental analysis of surface material on Phobos [1,14].
After almost half century of developments, LA–TOF mass spectrometry is now a well established analytical method for investigation of the chemical composition of solid materials and is widely applied in various research fields including metallurgy, geology, and environmental
and biological sciences [15–18]. This method utilises focused laser radiation to release material from the surface into the gas phase and direct mass spectrometric analysis of ions generated in the laser ablation process. The material is locally heated to thousands of Kelvin and ejected from the surface as a plasma plume, which itself interacts with the laser radiation. When sufficiently high irradiance is used (typically 1–10 GW cm−2 for IR lasers), the plasma
contains mostly atomic species and their ions [19]. Quantitative analysis is performed by measurement of a fraction of the ions in the plume, assumed to reflect the composition of the bulk material. For this reason, tests and calibration using standard reference materials (SRM) are usually conducted to establish a range of experimental conditions (e.g., laser pulse duration, irradiance, photon energy) in which the generated ion fraction can yield quantitative information about bulk composition. The results obtained by testing the performance of the proto-types for space research can be found in several recent publications including our report on mass analyser design planned for a potential rover on Mercury and Mars [3–5,
20,21]. These instruments are reflectron-type TOF MS and frequently use an IR laser (actually Nd:YAG lasers) for sample ablation.
Laboratory studies of NIST standard materials and natural samples reveal good instrumental performance in terms of sensitivity and quantitative capabilities. In quan-titative analysis, however, the abundances determined from the spectra must frequently be corrected by use of element-specific calibration factors, referred to as relative sensitivity coefficients (RSC). These must be obtained by extensive investigation of a variety of samples under controlled experimental conditions (detection windows, laser irradi-ance, and sample structure) [3, 21]. The corrections arise from the details of the ion-formation process and the detection method, and may depend on sample structure. Both elemental fractionation in the ion-formation process and because of species-dependent detection efficiency are by far the most important issues. In many current instrument designs, the ions formed in the ablation process enter the time of flight instrument without using extraction fields and travel according to their kinetic energy distribu-tion, which they acquire from the formation process and the plasma expansion [22–24]. In this case, the overall transmission of the LA–MS system will vary from element to element because of variable electrostatic plasma process-es in the ablation plume and dynamic factors (e.g. all elements have similar initial velocity), which depends on laser wavelength and irradiance [25,26]. The variability in the transmission results in elemental and isotopic fraction-ation with regard to the composition of the sample. To achieve a stable detection efficiency for various elements at an acceptable instrumental mass resolution, only ions
within a certain range of kinetic energies are transmitted to the detector, and ions outside this range are removed from the analysis. This so-called detection window is configured to observe a fraction of ions for all elements and is chosen to maintain instrumental resolution at m/Δm ≈ 200–300 [3, 21]. Greater mass resolution can be achieved by narrowing the energy window, which reduces ion transmis-sion and can cause additional elemental fractionation effects. Although this method of detection is not optimum, the measured abundances are close to quoted values and empirically determined correction factors seem to be useful in conducting quantitative analysis. Problems with the optimum detection of elements of very different kinetic energy distributions are also known from measurements by use of large laboratory instruments. Several designs have been proposed to remove these difficulties but only limited success has been achieved [18]. Nevertheless, measure-ments by use of large laboratory instrumeasure-ments show fairly uniform detection efficiencies for most elements using relatively high laser power densities (1–10 GW cm−2)
[27]. Application of lasers of shorter pulse duration and shorter wavelength is, however, preferred when quantitative analysis of the sample is conducted [39, 40]. The quantitative capabilities of miniaturised instruments have been extensively tested by use of standard materials and the abundances of almost all elements were found to be close to the quoted ones, enabling quantitative measurements on realistic samples. The grain-scale, bulk major and minor composition of a variety of minerals and meteor samples can be readily investigated with detection sensitivity of tens of ppm or lower [28,29].
In this contribution we report results from detailed performance tests conducted with our miniaturised reflec-tron TOF mass spectrometer designed for space research [4]. The design of the instrument has the potential for significant reduction of the number of inconvenient properties of existing miniaturised mass analysers. This is achieved by implementation of an ion lens for efficient extraction, confinement, and collimation of the ions produced during the ablation process. Ion transmission could be increased by a few orders of magnitude without losing instrumental resolution. In fact, the latter can be even increased by factor of 3–4 compared with other instruments of similar size, enhancing at the same time the sensitivity of the ion detection. Essentially all ions generated in the ablation process can be detected, because no detection windows are used. This design can be optimally operated at low laser power densities (<1 GW cm−2). At higher laser power densities, the laser-induced plasma can cause severe distortion of the electric field (ion optics) and affect the stability of the ion beam. Space-charge effects also become important, because of the large number of ions transmitted through the instrument. Nevertheless, application of
rela-tively low laser irradiance (0.1–0.7 GW cm−2) enabled
measurement of highly averaged spectra from one sample location. Thus, elemental analysis can be performed with small statistical errors and for well averaged spectra. This is hardly possible when high laser irradiance is used, because of large sample consumption and the variability in the plasma plume inherent to the high-irradiance regime. By implementation of a segmented anode, spatially dependent detection of ions can be achieved, yielding improvements of the mass resolution and dynamic range of the mass spectra. The objective of initial investigations was to characterise the instrument in terms of its sensitivity, mass resolution, and quantitative capabilities using the fundamental frequency of the Nd:YAG laser (pulse duration 4 ns, wavelength 1064 nm), typically applied in laser ablation mass spectrometry. The experimental arrangement provides means for in-debt analysis of experimental factors that affect the quality of mass spectrometric measurements, and gives insight to possible fractionation effects. The measurements are conducted on NIST standard samples for iron and steel to assess instrument sensitivity and quantitative capabilities. The potential of the instrument to study realistic samples is exemplified in studies of minerals and meteoritic material.
Experimental
Experimental setup and principles of operation
Details of the construction of the mass spectrometer used in this study can be found elsewhere [4]. The experimental system consists of a laser ablation ion source and a miniaturised reflectron-time-of-flight mass spectrometer. The dimensions of the instrument are 120 mm×Ø 60 mm. The flight instrument will be slightly larger and will combine laser and electronics. Nevertheless, the weight should not be larger than 1.5 kg. The mass analyser and the solid samples are placed within a large UHV chamber that can be pumped down to the 10–8mbar range. Radiation of a Q-switched Nd:YAG laser system (1064 nm, τ ≈ 4 ns, repetition rate 20 Hz) is used to ablate the material from the solids. The laser beam is focused to a spot of about 10μm diameter at the sample surface. To achieve this, the laser beam is initially expanded about 20 times, then focused on to the sample using a doublet lens ( f/200, NA=4). The laser beam is guided via a mirror system to be co-linear with the ion-optical axis of the TOF mass spectrometer (Fig. 1). After the last folding mirror there is the focussing lens placed just above the reflectron. The laser beam enters the mass analyser through the window mounted on the top of the reflectron and travels through the ion optical system, through the centre of the detector assembly (via a Ø 6.4 mm hole) all the way to the sample surface.
Positive ions generated in the plasma plume enter the mass analyser through the conical nose-piece, and are accelerated, confined, and collimated by an electrostatic immersion lens. Four electric potentials accelerate and focus the ions into the field-free and reflectron regions from which ions are reflected and detected by a pair of multichannel plates (MCP) used in a chevron configuration. The reflectron is a gridless ion mirror constructed from five metal rings at individual potentials and a backplane electrode. The voltage gradient is maintained approximately linear in two stages and enables energy focusing. The optimum ion transmission is achieved by applying exper-imental settings predicted from ion trajectory simulations [4]. The signals generated in the MCP are collected by four concentric anode rings. The ions arrive at the MCP detector in sequence, at times proportional to the square root of their mass-to-charge ratio (m/q).
Initial alignment of the laser beam focus is only made before closing and evacuating the vacuum chamber. Small samples of the NIST standard or just raw pieces of minerals can be placed on the sample holder mounted on a XYZ micro-translation stage. The sample is positioned at a fixed distance (~1 mm) from the entrance (grounded) plate but the measurements can also be performed from distances of
~10 mm after re-adjusting the ion optics potentials. Ablation rate can be optimized by tuning the potentials or tuning the sample position against the laser spot (in the range ±1 mm). The measurements were performed after initial cleaning of the surface by means of a sequence of laser shots. The laser fluence was controlled by use of a polarisation-sensitive attenuator, and laser irradiance in the range 0.1–1 GW cm−2 was usually used. The laser focus
spot diameter is not expected to vary significantly during the measurements.
The introduction of the electrostatic lens improves the ion transmission efficiency by a few orders of magnitude by collecting most of the ions generated in the laser ablation process. The absence of an energy window makes the efficiency of the ion detection of various species similar and reduces possible spatial and kinematic effects, which would otherwise contribute to elemental fractionation effects. In previous investigations we found application of separate anode rings, rather than a single anode plate, to be very useful for study of the spatial variation of transmission and mass resolution. The different ion transmission associ-ated with each of the four rings is used to increase the dynamic range of the instrument. The mass spectra presented here are collected using signals generated by #2 and #3 anode rings, respectively [4]. Tuning of the instrumental settings is started at the initial potentials predicted by the ion trajectory simulations [4]. The optimum operation of the system (ion optics, ion mirror) is at low potentials (usually lower than 500 V) and only for the MCP detector is a high voltage used (2 kV). Typical electrical potentials used for the ion optics can be found in Ref. [4]. These values are usually tuned in the range of 10% of their nominal values. Once the settings are optimised, the instrument could, in principle, be operated without any further adjustments for many weeks.
The laser system initiates the experimental cycle and triggers data acquisition. TOF mass spectra were acquired by two channels of a PCI standard high speed ADC-card (Agilent, U1082A, AP240 with averager firmware) from two of the four concentric, 50-Ω impedance-matched anodes of the MCP detector. In single-channel mode, this card supports 2 GS s−1 with an analogue bandwidth of 1 GHz and vertical resolution of 8 bits for a single shot. Typically, the spectra were recorded in the mass range 0–250 amu q−1,
which corresponds to flight times up to ~17 μs. In this acquisition mode, the card digitises the signal for 30μs.
The averager firmware with up to 64,000 triggers per segment enables total vertical resolution of 24 bits, corresponding, theoretically, to seven decades of dynamic range. In standard acquisition mode, the spectra from 64,000 sequences of laser shots are recorded and added on line for the two channels kept at different gain levels. The high-gain (HG) channel overlaps the first several bits Fig. 1 Schematic diagram of a laser ablation mass analyser. The laser
beam is introduced through the window on the top of the reflector and focused on the sample by means of an optical lens. The ions generated in the ablation process are collimated by an ion lens, separated according to their mass-to-charge ratio in the mass analyser, and detected by the MCP detector
of the low gain (LG) channel to maintain linearity. The effective dynamic range is increased by combining these two channels and supports ~7 decades. The LG channel is maintained at the gain at which major elements can be measured at full dynamic range supported by this channel and care is taken to avoid detection saturation effects. In the HG channel, the minor and trace species can be recorded in an extended dynamic range at the expense of saturation of the acquisition electronics by major elements.
Evaluation of mass spectra
The TOF mass spectra are measured on a linear time scale t. Transformation into the mass scale is achieved by use of fixed scaling factors and the relationship m=c(t – t0)
2
, where m is mass (amu q−1), t (ns) is the time of flight, and c and t0are calibration constants determined experimentally
[30]. These constants depend in general on instrument settings (e.g., potential on reflectron and lenses) and can be subject to change. The c and t0constants are obtained by
fitting the flight times for elements clearly identified in the spectrum. For example, for standard reference material 661 (SRM 661) we find for the constants c=(9.1345±0.0014)× 10–7and t0=−115.4±1.19.
The peak intensities are determined by direct integration of the peak area with a background correction which considers the signal baseline next to the individual mass peak. Direct integration is preferred to curve fitting, because asymmetric peak shapes can be observed for some of the intense isotopic components of the major and minor elements. The curve-fitting procedure (e.g., Gauss function) would underestimate the abundances of these species. For less intense mass peaks of minor and trace elements peak shapes are fairly symmetric, and results from direct integration and curve fitting are comparable. Effects caused by signal ringing are minimised but a periodic high-frequency noise can sometimes be observed in highly accumulated spectra. Numerical filtering of these effects, if necessary, is straightforward.
The mass spectrum could be measured within seven decades of dynamic range for each LG and HG channel but three decades are frequently covered by background noise in averaged spectra. By combining the LG and HG spectra an effective dynamic range of seven decades could be achieved, with a gain factor of ~140 and the error of this value is typically within 5%. The increased detection sensitivity for measurements performed using the HG channel is achieved at the expense of saturation of the most intense mass peaks in the spectrum (e.g., K, Ti, Cr, and Fe in the mass spectra of NIST standards for iron and steel). This sometimes makes analysis of abundances of major and minor elements from the HG spectrum alone difficult and less certain. In such cases, the calculations are
made using the LG spectrum and scaled by the gain factor. An independent check is made by calculations of abundan-ces from unsaturated mass peaks in the HG spectrum by applying the isotopic normalisation procedure. The isotopic normalisation procedure is also used to determine the abundances of elements in the event of isobaric interfer-ences, and the abundances of the trace elements from their intense isotopic mass peaks. In cases of more than one independent peak, a check on the reproducibility of this procedure could be performed. For mass peaks corresponding to masses larger than 63 amu, an additional contribution of cluster species is observed, and the isotopic patterns of elements and clusters must be considered to identify unambiguous mass peaks. If contamination by intense mass peaks of clusters was severe, elemental analysis was not conducted. For comparison with mass spectrometric results, the abundances of elements quoted by NIST as % w/w are transformed to the atomic percentages and referenced against the Fe abundance. Comparison of the measurements and NIST data yields the relative sensitivity coefficients (RSC), which are a measure of elemental fractionation effects. To check the reproducibility of the sensitivity for detection of individual elements, the RSC coefficients determined for two NIST standards were compared. For both NIST standards, the abundances of elements are scaled to iron, the most abundant element in the sample.
Results and discussion
NIST: SRM 661 and 664 steel standards
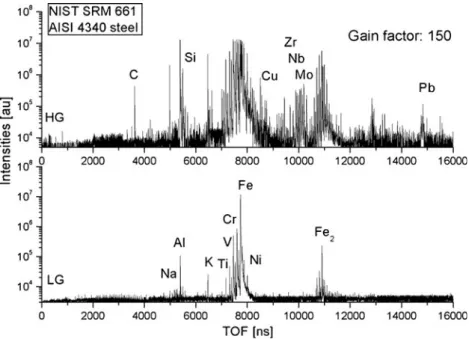
Two standard reference materials for steel, SRM 661 and 664, were investigated to establish the mass resolution, detection limits, and quantitative capabilities of the instru-ment. Figure 2 shows typical LG and HG mass spectra of SRM 661 obtained by summing 64,000 waveforms from one sample location recorded from a Ø≈ 10 μm laser spot. The entire mass spectrum spans approximately 15 μs, the time-of-flight range in which all elements are measured. Typically, a set of 5–10 pairs of spectra were recorded for one spot of the surface. High reproducibility of the spectral features in terms of relative peak intensities and shapes was observed even if the surface was exposed over hours to the laser irradiance. Iron isotopic peaks and almost all minor elements quoted by NIST are identified in the LG spectrum. In addition, in the HG spectrum mass peaks corresponding to trace elements are measured together with less intense isotopic components of major and minor elements.
For measurement of highly averaged spectra the mass resolution of the instrument is usually optimised at m/Δm ≈ 600–800 to satisfy conditions for optimum ion transmission
[4]. Studies with higher mass resolution are, however, possible and were predicted from the ion trajectories simulation. Analysis of a single-shot mass spectrum showed that mass resolution can be higher than 1000 and is only limited by laser pulse duration (τ≈4 ns). Thus, improvements in mass resolution are expected if shorter laser pulses are used. By summing 64,000 single-shot
spectra, the mass resolution decreases to approximately 500–700, as determined for the 56
Fe mass peak. Small, random shifts in time-of-flight are observed between individual spectra, causing effective broadening of the resulting averaged peak. The magnitude of this “jittering effect” becomes larger with increased laser irradiance. On application of higher power densities the laser-induced Fig. 2 Typical mass spectra of
SRM 641 measured in the LG and HG channels. The spectra can be measured within 4 or better decades and gain between channels is ca 150. Sensitivity of detection is at the sub-ppm level. In the spectrum recorded in the HG channel mass peaks of major and some minor ele-ments are saturated. The entire spectrum of the elements is recorded on the 16μs time scale
Fig. 3 HG mass spectrum of SRM 661 plotted on the mass scale. Mass peaks of major and some minor elements are saturated but the mass peaks of some minor and trace elements can be clearly identified. The clusters formed during the ablation process could also be identified in the mass ranges 100–130 and 154–170. The mass peak at 72 is likely to be FeO and the mass peaks at 83, 84, and 86 are the
species VO2, CrO2, and FeO2. Their intensities are so low that only
the main isotopic component could be measured. Cluster interferences inhibit the detection of Ag, Sn, Sb, and Te. The elemental abundances of trace elements are derived from isolated mass peaks corresponding to the most abundant isotopic components. These are marked as bold vertical bars
plasma distorts the electric field and space-charge effects also become important, causing extensive broadening of the intense mass peaks. Space-charge effects can also contribute substantially to mass peak broadening. These
effects are usually more pronounced for major and minor elements in the spectrum. The peak broadening and an asymmetric structure are observed, for example, for Na, K, Ti, Cr, and Fe elements whereas fairly symmetric Table 1 Elemental abundance ratios given by NIST for SRM 664
steel and measured by laser ablation mass spectrometry. Given the percentage w/w values, the atom percentages were calculated for
comparison with the experimental results. The relative sensitivity coefficients (RSC) were obtained by dividing measured by given values. Standard errors are given in parentheses
Element % w/w Atom % NIST element/Fe×10–3 Experiment element/Fe (±σ)×10–3 RSC IP (eV)
H 0.0005 (1) 0.02695 0.286 – – 13.598 B 0.011 (1) 0.05565 0.588 Weak 8.298 C 0.87 (1) 3.935 418.3 0.60 (0.014) 0.0014 11.260 N 0.003 (1) 0.01164 0.124 – – 14.534 O 0.0017 (1) 0.00577 0.061 – – 13.618 Na – – – 0.114 (0.028) – 5.139 Mg 0.0001 (1) 0.000224 0.0024 Weak – 7.646 Al 0.008 (1) 0.01611 0.171 0.199 (0.018) 1.17 5.986 Si 0.066 (1) 0.12766 1.36 0.009 (0.003) 0.007 8.151 P 0.010 (1) 0.01754 0.186 – – 10.486 S 0.025 (1) 0.04235 0.450 – – 10.360 K – – – 4.82 – 4.341 Ca 0.0001 (1) 0.000136 0.0014 0.0013 (0.001) 0.93 6.113 Ti 0.23 (1) 0.26103 2.770 2.55 (0.03) 0.92 6.82 V 0.10 (6) 0.10664 1.13 1.16 (0.02) 1.03 6.74 Cr 0.060 (6) 0.06269 0.666 0.675 (0.03) 1.01 6.766 Mn 0.250 (8) 0.24721 2.630 2.62 (0.02) 1 7.435 Fe 96.7 (1) 94.06809 1000 1000 (10) 1 7.870 Ni 0.14 (2) 0.12958 1.38 0.615 (0.03) 0.45 7.653 Co 0.150 (1) 0.13827 1.47 0.342 (0.09) 0.24 7.86 Cu 0.250 (1) 0.21372 2.27 0.472 (0.09) 0.21 7.726 Zn 0.0010 (5) 0.000831 0.0088 Cluster – 9.394 Ge 0.003 (1) 0.00224 0.0239 0.006 (0.0021) 0.25 7.899 As 0.050 (2) 0.03625 0.039 0.001 (0.0008) 0.026 9.81 Se 0.0003 (1) 0.000204 0.0022 Weak – 9.752 Zr 0.069 (1) 0.04109 0.44 0.485 (0.09) 1.11 6.84 Nb 0.150 (7) 0.08771 0.932 0.185 (0.03) 0.31 6.88 Mo 0.49 (1) 0.27746 2.95 3.07 (0.034) 1.04 7.099 Ag 0.00002 (1) 0.00001 0.00011 Cluster – 7.576 Sn 0.005 (1) 0.00229 0.024 Cluster – 7.344 Sb 0.035 (1) 0.01562 0.166 Cluster – 8.641 Te 0.0002 (1) 0.000085 0.0009 Cluster – 9.009 La 0.00007 (1) 0.000027 0.00029 Weak – 5.577 Ce 0.00025 (1) 0.000497 0.001 0.0012 1.2 5.47 Pr 0.000038 (1) 0.000015 0.0001 – – 5.42 Nd 0.00012 (1) 0.000045 0.00048 0.0002 (0.0001) 0.43 5.49 Hf 0.005 (1) 0.00152 0.016 0.0092 (0.002) 0.575 7.0 Ta 0.11 (1) 0.033 0.35 0.004 (0.001) 0.011 7.89 W 0.10 (2) 0.02955 0.31 0.005 (0.004) 0.016 7.98 Au 0.00010 (1) 0.0000276 0.00029 – – 9.225 Pb 0.024 (1) 0.00629 0.0669 0.271 (0.08) 4.05 7.416 Bi 0.0009 (1) 0.000234 0.0025 0.0016 (0.006) 0.7 7.289
Gaussian shapes are measured for other minor and trace elements.
Figure3shows the HG mass spectrum of the SRM 661 standard after transformation from the time to mass axes.
Assignment of species to the mass peaks is straightforward for masses smaller than 63 amu. For heavier elements one must consider possible interferences because of detection of clusters. The characteristic isotopic pattern of Fe2 species
Table 2 Elemental abundance ratios given by NIST for SRM 661 steel and measured by laser ablation mass spectrometry. Given the percentage w/w values, the atom percentages were calculated for
comparison with the experimental results. The relative sensitivity coefficients (RSC) were obtained by dividing measured by given values. Standard errors are given in parentheses
Element % w/w Atom % NIST element/Fe ×10–3 Experiment element/Fe (±σ)×10–3 RSC IP (eV)
H 0.0005 (1) 0.0266 0.290 – 13.598 B 0.516 (15) 2.5565 27.880 0.005 (0.003) 8.298 C 0.392 (5) 1.7483 19.070 0.05 (0.0015) 0.00131 11.260 N 0.0037 (1) 0.0142 0.154 – 14.534 O 0.0009 (1) 0.00301 0.033 – 13.618 Na – 1.1 (0.074) 5.139 Mg 0.0001 (1) 0.0002204 0.0024 0.007 (0.0024) 3.125 7.646 Al 0.021 (5) 0.042 0.455 1.225 (0.022) 2.69 5.986 Si 0.223 (1) 0.4253 4.640 0.3 (0.022) 0.016 8.151 P 0.015 (1) 0.0259 0.283 – – 10.486 S 0.015 (1) 0.0251 0.273 – – 10.316 K – 4.4 (0.081) – 4.341 Ca 0.00018 (1) 0.000134 0.0015 0.0012 (0.001) 0.83 6.113 Ti 0.020 (1) 0.02238 0.244 0.347 (0.017) 1.42 6.82 V 0.011 (1) 0.01157 0.126 0.212 (0.0056) 1.69 6.74 Cr 0.69 (1) 0.71086 7.75 8.14 (0.08) 1.05 6.766 Mn 0.66 (1) 0.6435 7.02 3.37 (0.27) 0.48 7.435 Fe 95.6 (1) 91.7017 1000 1000 (40) 1 7.870 Ni 1.99 (1) 1.8162 19.81 2.5 (0.09) 0.13 7.653 Co 0.032 (1) 0.02909 0.317 0.047 (0.002) 0.15 7.86 Cu 0.042 (1) 0.03541 0.386 0.06 (0.001) 0.13 7.726 Zn 0.00010 (5) 0.000082 0.0009 cluster 9.394 Ge 0.006 (1) 0.0044 0.0048 0.002 (0.001) 0.41 7.899 As 0.017 (1) 0.01215 0.133 0.001 (0.0009) 0.0015 9.81 Se 0.004 (1) 0.0027 0.029 0.0003 (2) 0.011 9.752 Zr 0.009 (1) 0.00528 0.058 0.058 (0.009) 1 6.84 Nb 0.022 (1) 0.01268 0.138 0.103 (0.003) 0.74 6.88 Mo 0.19 (1) 0.106 1.16 0.785 (0.023) 0.68 7.099 Ag 0.0004 (1) 0.000198 0.0022 cluster – 7.576 Sn 0.011 (5) 0.0050 0.054 cluster – 7.344 Sb 0.0042 (5) 0.00185 0.020 cluster – 8.641 Te 0.0006 (1) 0.000252 0.0027 cluster – 9.009 La 0.0004 (1) 0.00015 0.0017 0.001 (0.001) 0.59 5.577 Ce 0.0013 (5) 0.000497 0.0054 0.003 (0.0015) 0.56 5.47 Pr 0.00014 (1) 0.0000532 0.00058 0.001 (0.001) 1.72 5.42 Nd 0.0003 (1) 0.00011 0.0012 0.001 (0.001) 0.83 5.49 Hf 0.0002 (1) 0.00006 0.00065 0.001 (0.001) 1.5 7.0 Ta 0.020 (1) 0.0059 0.065 0.0180 (0.0016) 0.27 7.89 W 0.017 (5) 0.00495 0.054 0.0015 (0.0008) 0.03 7.98 Au 0.00005 (1) 0.000014 0.00015 – 9.225 Pb 0.000025 (5) 0.0000064 0.00007 0.0052 (0.0011) 71.4 7.416 Bi 0.0004 (1) 0.0001 0.001 0.005 (0.004) 5 7.289
can be already observed in the LG spectrum. By inspection of the HG spectra, the diatomic clusters of minor elements including Ti, V, Cr, Mn, and Ni were also identified in measurements of both SRM 661 and 664 samples. Application of larger laser irradiance only slightly reduces cluster abundance, but substantial enhancement of their intensities could be achieved by application of much lower laser irradiance (<0.1 GW cm−2). The plasma chemistry induced by the laser ablation process has been the subject of extensive theoretical and experimental studies. Recent studies have attempted to clarify the importance of recombination processes and indicate rich plasma synthesis for irradiance up to 10 GW cm−2 [31]. A contribution of clusters desorbed directly from the surface is also possible. The measurements showed that clusters generated in the plasma chemistry and those desorbed directly from the surface have very different kinetic energy distributions and can be well discriminated from shot-by-shot mass spectra because of the distinct kinetic energies of the ions [32].
To perform quantitative analysis, the mass peaks in both LG and HG spectra were integrated and scaled by the gain factor calculated from unsaturated Na, Al, K, Ti, V, Cr, and Mn mass peaks. The absolute atomic abundances for iron and some of the minor elements are determined from the LG spectra and multiplied by the gain factor. The reproducibility of these results is checked by calculation of independent and unsaturated peaks in the HG spectrum. In the analysis care was taken in processing signals from mass peaks affected by isobaric interferences by overlap with other elements or clusters. For example two or more elements have to be evaluated for mass peaks 50, 58, 64, 70 or 92, 94, and 96. The reproducibility of the isotopic procedure can in some cases be checked from the presence
of two or more unambiguous peaks (e.g., Ti, Cr, Mo). Doubly charged species and residual atmospheric gases were not observed under the experimental conditions used. Detection of the elements Ag, Sn, Sb, and Te could not be confirmed because of severe interference by the intense mass peaks of diatomic clusters observed within the 100– 130 amu q−1 mass range. Although abundances for mass peaks smaller than 63 amu q−1 could be determined in a relatively straightforward manner, analysis of heavier elements Zn, Zr, Ni, Mo, Ce, La, Pr, Nd, Hf, Ta, W, Pb, and Bi must be performed with more caution, considering isotopic patterns of elements and clusters. In most cases, however, unambiguous elemental peaks could be identified and determination of abundance could follow after appli-cation of the standard isotopic normalisation procedure. Mass spectra at low laser irradiance were also useful for checking for possible cluster contamination. In principle, the mass peaks corresponding to elements could be extracted from spectra contaminated by diatomic clusters by subtracting the cluster isotopic pattern modelled from the terrestrial isotopic composition of the corresponding element. The isotopic abundances of the Fe2 cluster
calculated from the spectra and that obtained by modelling from natural isotopic abundance for iron were found to differ by no more than 4%. One must be aware, however, that fractionation effects due to chemical recombination reactions in plasma may be large and are species and cluster-specific. The quantitative abundances of the ele-ments detected in this study are given in Tables1and2and the unambiguous peaks selected for the quantitative elemental analyses are marked in the Fig.3. The integration errors for the major and minor elements rarely exceed 10%, and typically are 3–5 %. For the trace elements Ce, La, Pr, Fig. 4 RSC values determined
from measurements of two steel standards. Low RSC values are obtained for the elements with high IP. The effects with satura-tion of the detector are correlat-ed with the measurements of Ni, Co, and Cu. RSC values larger than 1 are determined in the detection of Mg, Al, Pb, and Bi (see Tables1and2for details)
Nd, Ta, Hf, W, and Bi the errors are larger, because of low signal-to-noise ratios for their mass peaks. For B, C, W, and Si, exceptionally low abundances were determined and abundances of Al and Pb were found to be slightly larger than the quoted values. The abundance of B was deter-mined to be a factor of 5–10 lower than that of C. Its peak intensity was also observed to fluctuate from one measure-ment to another. For laser power densities larger than 1 GW cm−2, the abundance ratio B/C could be stabilised. Quantitative analysis under these conditions is rather difficult because of extensive mass peak broadening of other more abundant elements. H, N, O, S, and P are not clearly observed in the spectra and identification of the mass peaks of Ag, Se, Sn, Sb, Te, and Au was difficult because of interferences with intense mass peaks of the clusters. Detection efficiency for Ni, Co, and Cu was affected by detector-saturation effects, because these peaks lie on the tail of the intense Fe signal (Fig.3). The results for the minor elements can also be affected by non-uniform baseline, which will contribute to the integration if not modelled accurately. The RSC factors are included in tables and their plot is presented in Fig.4. The intensities of the mass peaks of trace elements tend to fluctuate. Particularly striking are fluctuations of peak intensities for Pb, which can be as high as 10, but intensities for Zr and Nb also are observed to vary for measurements made from different surface spots. These intensity changes are not correlated with the major and minor mass peaks and are assumed to be the result of surface heterogeneity. Most of the trace elements detected in these studies are abundant at some few tens of ppm, e.g., the elements Ce, Pr, Nd, Hf, Pb, and Bi are at ppm and sub-ppm abundance. Fractionation effects are substantial for some elements, as can be seen from the range of RSC values (Tables1 and2). The RSC values are larger for lower laser irradiance, and detection efficiency correlates to some extent with the ionisation potential of the elements (Fig. 4). The laser irradiance applied in these studies is in the range 0.1–1 GW cm−2.
Under these conditions, hot plasma should be still gener-ated and relatively uniform ionisation efficiency is to be expected for elements heavier than iron; for elements such as Zn, As, Se, Te, and Au, however, detection efficiency is low or uncertain. Results from studies conducted by laser ablation combined with inductively coupled mass spec-trometry (LA–ICP MS) show that relatively sharp RSC dependence on laser irradiance is expected for irradiance <1 GW cm−2and that the detection efficiency of an element is critically dependant on its IP [33]. In fact in the test performed at higher laser irradiance <1 GW cm−2, enhancement of the intensities of mass peaks of B and C was observed but quantitative measurements were not possible because of severe space-charge broadening for other more intense mass peaks. The data reported by other
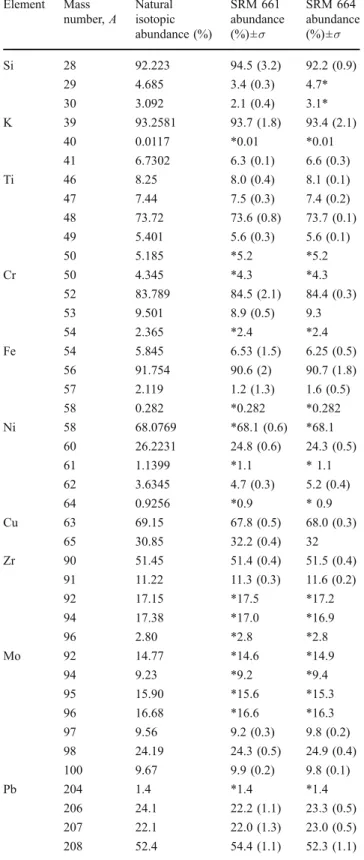
Table 3 Isotopic abundance ratios (%) determined from measure-ments of SRM 661 and SRM 664 samples and natural isotopic abundances. The standard errors (σ) are given in parentheses. The isotopic percentage ratios are determined from the independent components, not affected by isobaric interferences. In the calculation other components are assumed to have terrestrial isotopic percentages and are marked“*”
Element Mass number, A Natural isotopic abundance (%) SRM 661 abundance (%)±σ SRM 664 abundance (%)±σ Si 28 92.223 94.5 (3.2) 92.2 (0.9) 29 4.685 3.4 (0.3) 4.7* 30 3.092 2.1 (0.4) 3.1* K 39 93.2581 93.7 (1.8) 93.4 (2.1) 40 0.0117 *0.01 *0.01 41 6.7302 6.3 (0.1) 6.6 (0.3) Ti 46 8.25 8.0 (0.4) 8.1 (0.1) 47 7.44 7.5 (0.3) 7.4 (0.2) 48 73.72 73.6 (0.8) 73.7 (0.1) 49 5.401 5.6 (0.3) 5.6 (0.1) 50 5.185 *5.2 *5.2 Cr 50 4.345 *4.3 *4.3 52 83.789 84.5 (2.1) 84.4 (0.3) 53 9.501 8.9 (0.5) 9.3 54 2.365 *2.4 *2.4 Fe 54 5.845 6.53 (1.5) 6.25 (0.5) 56 91.754 90.6 (2) 90.7 (1.8) 57 2.119 1.2 (1.3) 1.6 (0.5) 58 0.282 *0.282 *0.282 Ni 58 68.0769 *68.1 (0.6) *68.1 60 26.2231 24.8 (0.6) 24.3 (0.5) 61 1.1399 *1.1 * 1.1 62 3.6345 4.7 (0.3) 5.2 (0.4) 64 0.9256 *0.9 * 0.9 Cu 63 69.15 67.8 (0.5) 68.0 (0.3) 65 30.85 32.2 (0.4) 32 Zr 90 51.45 51.4 (0.4) 51.5 (0.4) 91 11.22 11.3 (0.3) 11.6 (0.2) 92 17.15 *17.5 *17.2 94 17.38 *17.0 *16.9 96 2.80 *2.8 *2.8 Mo 92 14.77 *14.6 *14.9 94 9.23 *9.2 *9.4 95 15.90 *15.6 *15.3 96 16.68 *16.6 *16.3 97 9.56 9.2 (0.3) 9.8 (0.2) 98 24.19 24.3 (0.5) 24.9 (0.4) 100 9.67 9.9 (0.2) 9.8 (0.1) Pb 204 1.4 *1.4 *1.4 206 24.1 22.2 (1.1) 23.3 (0.5) 207 22.1 22.0 (1.3) 23.0 (0.5) 208 52.4 54.4 (1.1) 52.3 (1.1)
groups show that even for large laser irradiance in the range 1–10 GW cm−2, fully quantitative detection of these species
cannot be accomplished. It seems that instead of increasing the laser irradiance, application of shorter laser wavelengths would be preferred for improvement of the quantitative capabilities of such an instrument. One usually prefers application of a UV laser source to an IR source to improve the ionisation efficiency for all elements [34, 39,40]. The mechanism of elemental fractionation in LA–MS can be complex. It may occur in the ablation region and can be affected by laser characteristics (wavelength, laser irradi-ance, laser energy distribution, pulse repetition rate, focal length of the focusing lens, and even focus position relative to the sample). Formation of clusters or small particles directly by laser–solid interaction or later, by condensation in the expanding plume, is also known to contribute to the fractionation. In addition, shielding effects of the target surface because of the presence of particles in the vapour plume may also contribute to less effective plasma generation. During the ablation process elemental and isotopic fractionation may occur because of volatilization of lighter elements but also because of partial re-condensation of analyte melt on to the ablation surface and the crater walls (melting rims). These effects are thought to be the main reason for the fractionation when ns-lasers are used for ablation of the sample.
Other possible fractionation effects including sample-specific (matrix effects), kinematic, and spatial effects in the source are minimised in this study. Instrumental fractionation is substantially reduced by efficient ion detection supported by implementation of the ion lens.
Furthermore, the analysis was performed on highly aver-aged spectra (64,000) and statistical fluctuations are expected to be negligible. Long averaging of the spectrum can also lead to elemental/isotopic fractionation if the elements have significantly different fractionation behav-iour during ablation of the sample. Evidence for these effects can be obtained by analysis of the intensity ratios for different elements during acquisition of the spectrum [40]. Some variations of peak intensities were noticed for major and minor elements in measurements conducted within ~0.5 h of irradiation of the sample. Detailed investigation of these effects are planned in subsequent experiments.
For analysis of isotopic abundances, two or more independent peaks of an element are measured. Table 3
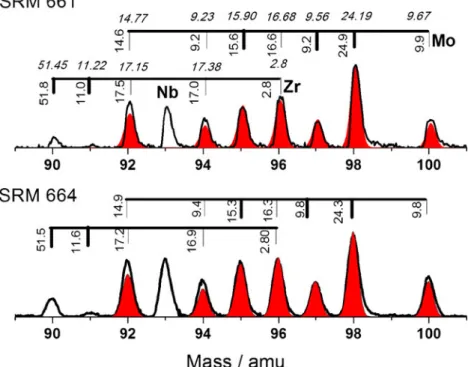
shows results from analysis of the isotopic patterns of Mg, K, Si, Ti, V, Cr, Fe, Ni, Cu, Zr, and Mo. The differences between terrestrial values and measured ones are usually smaller than 1%. Figure 5 shows portions of the mass spectra of Zr, Nb, and Mo recorded for SRM 661 and 664. The contribution of isotopic components can be fairly well estimated after determination of the contribution from the independent peaks. These data can be compared with those from measurement of the isotopic pattern for pure Mo. The results show good performance in quantitative investigation of isotopic abundances and the capabilities of the instru-ment for analysis of the natural isotopic fractionation effects. In combination with a high dynamic range of the spectra, the application to age determination by measure-ment of radiometric isotopes seems possible at the present stage of development of our instrument.
Fig. 5 Isotopically resolved mass spectra of Zr, Nb, and Mo recorded for the SRM 661 and 664 samples. The elemental composition for Mo and Zr can be obtained from unambiguous mass peaks, Nb has only one isotope. The isotopic abundan-ces determined from the spectra are compared with the terrestrial isotopic distribution of these elements (annotation in italics)
Minerals and meteoritic material Galenite
In our preliminary studies of realistic planetary samples, we examined crystallised galenite (PbS) mineral from Katanga (Congo). It is the most important ore mineral of lead and occurs in many different types of environments including hydrothermal veins. This mineral contains mainly Pb (86.5% w/w), S (13.31% w/w), Cu (0.07% w/w), and Ag (sometimes up to 1% w/w) [35]. Trace elements such as Mn, Fe, Zn, Se, Bi, As, Sb, Mo, U, Au, Cd, and Pt can also be measured and their abundance depends on the origin of the sample.
The mass spectrometric measurements were conducted on raw samples of galenite. The typical HG spectrum is shown in Fig.6. The isotopic pattern of the element Pb is by far the most intense in the LG spectrum. Other identified elements are Na, K, Ca, Cr, Fe, and Ag. In addition, the HG spectrum revealed the presence of Mg, Ca, S, Si, Mn, Cu, and Zn. The portions of the spectrum showing isotopic peaks of S and Pb are depicted as the insets in Fig. 6. In Table 4 the elemental abundance ratios determined from analysis of the LG and HG mass spectra are compared with quoted values for a galenite sample (Katanga, Congo) for Pb, S, and Cu [35]. The Ag element abundance is not quoted because it can vary from sample to sample. The measurements show that our sample contains
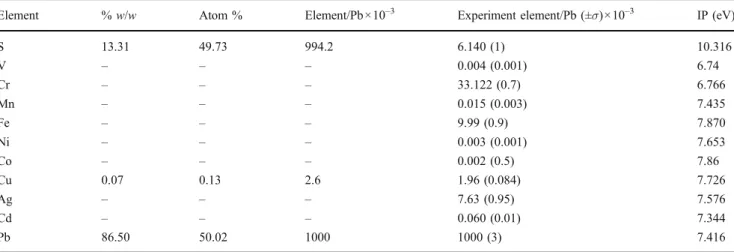
approximate-Table 4 Elemental abundance ratios determined for galenite sample (Katanga, Congo) compared with quoted values for Pb, S, and Cu. The Ag element abundance can vary from sample to sample and could be as high as 1%. A number of trace elements including Cr, Fe, V, Mn,
Cd, and Co were measured and the values for Cr and Fe were found to be higher than those for Cu and Ag. Percentage w/w values are adopted from Ref. [35] and the atom percentages are calculated for comparison with the experimental results
Element % w/w Atom % Element/Pb×10–3 Experiment element/Pb (±σ)×10–3 IP (eV)
S 13.31 49.73 994.2 6.140 (1) 10.316 V – – – 0.004 (0.001) 6.74 Cr – – – 33.122 (0.7) 6.766 Mn – – – 0.015 (0.003) 7.435 Fe – – – 9.99 (0.9) 7.870 Ni – – – 0.003 (0.001) 7.653 Co – – – 0.002 (0.5) 7.86 Cu 0.07 0.13 2.6 1.96 (0.084) 7.726 Ag – – – 7.63 (0.95) 7.576 Cd – – – 0.060 (0.01) 7.344 Pb 86.50 50.02 1000 1000 (3) 7.416
Fig. 6 HG spectrum of galenite (PbS). Detection sensitivity is at the few tens of ppm level. Measurements of Pb isotopic abundance can be performed with high sensitivity and the spectrum can be built up to six decades of dynamic range
ly five times more Ag than Cu by weight. A number of trace elements including Cr, Fe, V, Mn, Cd, and Co were measured and the values for Cr and Fe were found to be higher than those for Cu and Ag. The percentage w/w values are adopted from Ref. [35] and the atomic percentages are calculated for comparison with the experimental results. Despite the expected large abundance of S, its detection efficiency is rather limited, which has already been observed for NIST standard samples. Additional tests show that improved detection sensitivity for this element can be achieved at higher laser irradiance but at the expense of saturation effects and broadening of other mass peaks, rendering quantitative analysis inac-curate. The elemental abundances determined in this study must be regarded as semi-quantitative, taking into account conclusions reached from studies on the NIST standards.
The isotopic abundance (%) analysis was performed for a number of species and is compared with terrestrial isotopic abundances in Table 5. The isotopic percentages are typically close to their terrestrial values, with an exception of Pb. The ratios of its isotopic components vary by a few percent and are expected to be caused by natural processes rather than by instrumental fractionation. Mea-surements of Pb can be performed in a large dynamic range, enabling highly accurate determination of abundances of its all isotopic components and, in principle, enabling estima-tion of the age of the galenite samples [8].
Figure7shows the portion of the spectrum recorded for masses larger than 208 amu q−1 at enhanced mass resolution m/Δm ≈ 1000 (FWHM) at a lower laser irradiance of 0.1 GW cm−2. A number of Pb-bearing clusters can be identified in the spectrum in the mass range 200–1000 amu. Both laser desorption and the rich plasma chemistry may contribute to the mechanism of their formation. All features recorded up to mass 500 amu q−1 are clearly resolved and unambiguous assignment, despite high spectral congestion, can be performed by means of analysis of the isotopic patterns. The measurements demonstrate high sensitivity over a relatively large mass range. The cluster abundances estimated from the spectra are at tens of ppm, abundance levels expected, for example, for organics deposited in planetary rocks or clays. High detection sensitivity and high mass resolution in the extended mass range achieved in this study is promising for application of our instrument to study the molecular composition of the samples by laser desorption. Recently, the instrument was used for the detection of organic material deposited on a diamond surface [36].
The instrumental performance established by measure-ment of the galenite mineral is quite encouraging, given the low abundances of elements other than Pb, S, Cu, and Ag and the ability to use a small laser spot to investigate the
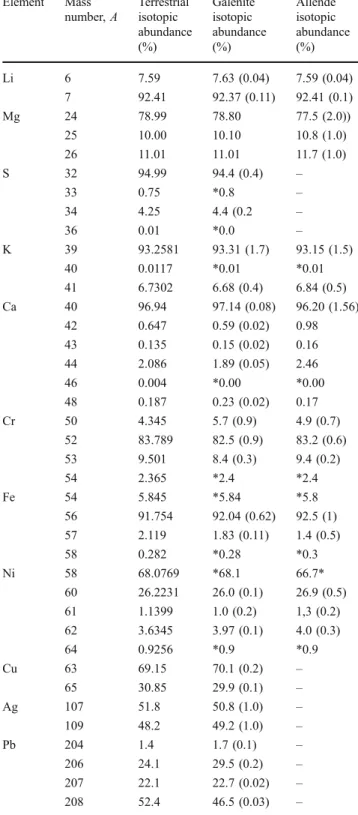
Table 5 Isotopic abundance (%) determined from measurements of galenite and Allende samples compared with terrestrial isotopic abundances. The standard errors(s) are given in parentheses. The isotopic percentage ratios are determined from the independent components, not affected by isobaric interferences. In the calculation other components are assumed to have terrestrial isotopic percentages and are marked“*”
Element Mass number, A Terrestrial isotopic abundance (%) Galenite isotopic abundance (%) Allende isotopic abundance (%) Li 6 7.59 7.63 (0.04) 7.59 (0.04) 7 92.41 92.37 (0.11) 92.41 (0.1) Mg 24 78.99 78.80 77.5 (2.0)) 25 10.00 10.10 10.8 (1.0) 26 11.01 11.01 11.7 (1.0) S 32 94.99 94.4 (0.4) – 33 0.75 *0.8 – 34 4.25 4.4 (0.2 – 36 0.01 *0.0 – K 39 93.2581 93.31 (1.7) 93.15 (1.5) 40 0.0117 *0.01 *0.01 41 6.7302 6.68 (0.4) 6.84 (0.5) Ca 40 96.94 97.14 (0.08) 96.20 (1.56) 42 0.647 0.59 (0.02) 0.98 43 0.135 0.15 (0.02) 0.16 44 2.086 1.89 (0.05) 2.46 46 0.004 *0.00 *0.00 48 0.187 0.23 (0.02) 0.17 Cr 50 4.345 5.7 (0.9) 4.9 (0.7) 52 83.789 82.5 (0.9) 83.2 (0.6) 53 9.501 8.4 (0.3) 9.4 (0.2) 54 2.365 *2.4 *2.4 Fe 54 5.845 *5.84 *5.8 56 91.754 92.04 (0.62) 92.5 (1) 57 2.119 1.83 (0.11) 1.4 (0.5) 58 0.282 *0.28 *0.3 Ni 58 68.0769 *68.1 66.7* 60 26.2231 26.0 (0.1) 26.9 (0.5) 61 1.1399 1.0 (0.2) 1,3 (0.2) 62 3.6345 3.97 (0.1) 4.0 (0.3) 64 0.9256 *0.9 *0.9 Cu 63 69.15 70.1 (0.2) – 65 30.85 29.9 (0.1) – Ag 107 51.8 50.8 (1.0) – 109 48.2 49.2 (1.0) – Pb 204 1.4 1.7 (0.1) – 206 24.1 29.5 (0.2) – 207 22.1 22.7 (0.02) – 208 52.4 46.5 (0.03) –
heterogeneity of the sample. Although full quantitative elemental analysis is not yet possible, the results enable sensitive detection of elements and clusters. Highly accurate determination of isotopic abundances demonstrat-ed in measurements of SRM standards is also achievdemonstrat-ed in measurements of galenite.
Allende
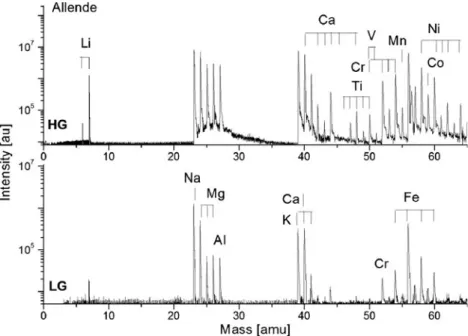
Application of the instrument to studies of realistic planetary samples is demonstrated in measurements of the Allende meteorite. Allende belongs to the carbonaceous chondrites (CV3) with highly heterogeneous structures, including chondrules, calcium–aluminium-rich inclusions (CAIs), fine grained regions, and several mineral phases. The chondrules and CAIs can be identified by visual inspection of the surface of the sample and our instrument can support spatially resolved investigation of these regions when the sample stage control software is fully operational. In our initial studies, mass spectra were measured at different sample locations across the meteor surface. Portions of LG and HG mass spectra are shown in Fig.8. The elements Li, Na, K, Mg, Ca, Al, Cr, Fe, and Ni can be identified in the LG spectrum. The HG spectrum reveals the presence of mass peaks of Ti, V, Mn, and Co. The alkali metals are very abundant in the sample; this is likely to be because of terrestrial sample contamination rather than their natural abundance. C, Si, and S are not detected in these measurements, most likely because of their low abundance and/or our low detection efficiency for these species. The analysis of the high mass elements is difficult because both clusters and molecular interference are possible (section“
NIST: SRM 661 and 664 steel standards”). Some reduction of cluster abundances can be achieved by application of higher laser irradiance but at the expense of spectral quality. An overview of spectra recorded at different spatial locations shows some small fluctuations of peak intensities; their analysis is beyond the scope of this paper. Because of semi-quantitative performance of the instrument, tentative results from analysis of the elemental abundances of Ti, Cr, V, Mn, Fe, Ni, and Co are shown in Table 6. The RSC factors are expected to be no larger than 1–3 for these species and detection efficiency for Ni and Co is also less problematic (see “Introduction”). The results were com-pared with literature values [29, 37, 38]. Ratios of the atomic percentages are close to the literature values for most elements. Abundances for Cr and Ni were, however, a few times higher than quoted values, and abundances for Ti and Co were clearly lower than quoted values. In addition, a small abundance was measured for vanadium, which has not been reported in the literature for the Allende meteorite, although typical values for this type of meteorite are 70 ppm. These abundances are characteristic of the Allende meteorite and the results could be used for diagnostic purposes. The isotopic abundances determined from the spectra are also shown in Table5. The isotopic abundance ratios are generally close to terrestrial isotope values.
Summary
Detailed laser ablation mass spectrometric test studies were conducted to establish the performance of our mass analyser design for space research. Stable ion formation Fig. 7 HG mass spectrum of Pb
clusters. The Pb mass peak is at saturation and the gain factor between LG and HG spectra is ~100, implying cluster abun-dances at the tens of ppm level. The spectrum indicates rich plasma chemistry exemplified by the formation of several cluster species. The inset shows a portion of the spectrum recorded at high mass resolution (~1000). The characteristic iso-topic pattern of Pb remains and unambiguous assignment of mass peaks can be readily achieved by considering the patterns of the Pb and S isotopes in the respective clusters
was achieved with laser irradiance slightly lower than usually used in laser ablation mass spectrometry. Low sample consumption and long-term stability of the ion beam enabled acquisition of highly averaged spectra with the typical mass resolution of m/Δm ≈ 600. By combining two acquisition channels of different gains an effective dynamic range of seven decades could be achieved, enabling abundance analysis at the ppm level or lower. Quantitative capabilities are limited under the experimental conditions used in this study. The main reason for this is probably the application of low laser irradiance and an IR laser source, which may cause competing fractionation. The instrument supports detection of almost all ions generated in the plasma, significantly reducing the fractionation effects caused by the kinetic energy distribution observed in other instruments. Matrix effects should not be impor-tant, because of the structural similarity of the NIST standards. Furthermore statistical effects are negligible in our analysis because the analysis is performed on highly averaged spectra. Isotopic fractionation effects are found to be small, typically lower than 1%, indicating good
quantitative performance of the instrument for applications in which quantitative information about isotopic composi-tion is of interest.
The results of this study indicate that further improve-ment of quantitative performance can be achieved by application of short wavelength and/or short-pulse laser sources. These offer the possibility of enhancing detection efficiency and thus reduction of elemental fractionation effects in the plasma plume. A further increase in the mass resolution of the instrument is expected when using shorter laser pulses. A shorter time for recombination processes in the plasma achieved by use of a short-pulse laser may also reduce the abundance of the interfering clusters. These investigations are currently in progress in our laboratory. In future developments we believe that detection limits at ppb levels are realistic. Further increase of the dynamic range of recorded signals seems possible, taking into account developments in detection technology. The effective dy-namic range of the measured spectra can still be improved by application of more sensitive detectors and multichannel detection. This is of substantial interest for in situ Table 6 Elemental abundance for metallic elements determined for the Allende sample compared with literature values [29,36,37]. Abundances of Cr and Ni are a few times higher than quoted values whereas abundances of Ti and Co are clearly lower than measured previously Element Atom % [29,36,37] Quoted element/Fe Exp. element/Fe (±σ) Scaling factor IP (eV)
Ti 0.045 0.0044 0.0013 (0.0005) 0.3 6.82 V – – 0.0003 (0.0001) – 6.74 Cr 0.16 0.016 0.05416 (0.008) 3.3 6.766 Mn 0.061 0.0059 0.0052 (0.0007) 0.9 7.435 Fe 10.25 1.0 1,0 (0.040) 1 7.870 Ni 0.57 0.056 0.1817 (0.03) 3.1 7.653 Co 0.025 0.0025 0.00154 (0.0081) 0.5 7.86
Fig. 8 Portion of HG and LG mass spectra of a heterogeneous sample of the Allende meteorite. The Ti, Cr, V, Fe, Co, and Ni composition is similar to that given in the literature [29,37,
38]. The elements S and Si are not detected because of the low detection efficiency for these species
quantitative measurements of radiogenic isotopes, trace levels of rare earth elements, and bio-organic fractionation. Acknowledgements This work is supported by the Swiss National Science Foundation.
References
1. Zelenyi LM, Zakharov AV, Ksanfomality LV (2009) Phys Usp 52:1056
2. Wurz P, Whithby JA, Managadze GG (2009) AIP Conf Proc 144:70
3. Brinckerhoff WB, Managadze GG, McEntire RW, Cheng AF, Green WJ (2000) Rev Sci Instrum 71:536
4. Rohner U, Whitby JA, Wurz P (2003) Meas Sci Technol 14:2159 5. Managadze GG, Shutyaev IY (1993) In: Vertes A, Gijebels R, Adams F (eds) Laser ionization mass analysis. Wiley, New York 6. Ehlmann BL (2008) Science 322:1828
7. Zinner E, Göpfel C (2002) Meteorit Planet Sci 37:1001 8. Allègre CJ, Manhès G, Göpel C (1995) Geochim Cosmochim
Acta 59:1445
9. Chela-Flores J (2010) Int J Astrobiol 9:101
10. Corrigan CM, Brinckerhoff WB, Cornish T, Ecelberger S (2007) Meteor Planet Sci 42:33
11. Spencer MK, Hammond MR, Zare RN (2008) PNAS 105: 18096
12. Demirev PA, Fenselau C (2008) Anal Rev Anal Chem 1:71 13. Sagdeev RZ, Zakharov AV (1990) Sov Astron Lett 16:125 14. Managadze GG, Wurz P, Sagdeev RZ, Chumikov AE, Tuley M,
Yakovleva M, Managadze NG, Bondarenko AL (2010) Sol Syst Res 44:376
15. Fenner NC, Daly NR (1966) Rev Sci Instrum 37:1068 16. Bernal E, Levine LP, Ready JF (1966) Rev Sci Instrum 37:938 17. Hercules DM (1988) Microchem J 38:3
18. Quan Y, Chen L, Huang R, Hang W, He J, Huang B (2009) Trends Anal Chem 28:1174–1185
19. Pipps CR, Dreyfus RW, Adams F (1993) In: Vertes A, Gijbels R (eds) Laser ionisation mass analysis. Wiley, New York
20. Brinckerhoff WB (2003) Acta Astronaut 52:397
21. Woll DM, Wahl M, Oechsner H (1999) J Anal Chem 36:70 22. Knight AK, Scherbarth NL, Cremers DA, Ferris MJ (2000) Appl
Spectrosc 54:331
23. Vertes A, Gijebels R, Adams F (eds) (1993) Laser ionization mass analysis. Wiley, New York
24. Cotter RJ (1987) Anal Chim Acta 195:45
25. Amoruso S, Berardi V, Bruzzese R, Spinell N, Wang X (1998) Appl Surf Sci 127–129:953
26. Buchsbaum A, Rauchbauer G, Varga P, Schmid M (2008) Rev Sci Instrum 79:043301
27. Dietze HJ, Becker JS (1993) In: Vertes A, Gijbels R, Adams F (eds) Laser ionisation mass analysis. Wiley, New York
28. Brinckerhoff WB (2004) Appl Phys A 79:953 29. Brinckerhoff WB (2005) Planet Sp Sci 53:817
30. Scherer S, Altwegg K, Balsiger H, Fischer J, Jäckel A, Korth A, Mildner M, Piazza D, Rème H, Wurz P (2010) Int J Mass Spectr 251:73
31. Burakov VS, Tarasenko NV, Savasenko NA (2001) Spectrochim Acta B 56:961
32. Managadze GG, Brinckerhoff WB, Chumikov AE (2003) Geo-phys Res Lett 30:1247
33. Becker JS (2007) Inorganic mass spectrometry. Principles and applications Springer, Berlin/Heidelberg
34. Günther D, Jackson SE, Longerich HP (1999) Spectrochim Acta B 54:381
35.www.handbookofmineralogy.org/pdfs/galena.pdf
36. Riedo A, Wahlström P, Scheer JA, Wurz P, Tulej M (2010) J Appl Phys 108: in press
37. Jarosevich E (1990) Meteoritics 25:323
38. Jarosevich E, Nelson JA, Norberg JA (1980) Geostandards News 14:43
39. Heinrich CA, Pettke T, Halter WE, Aigner-Torres M, Audétat A, Günther D, Hattendorf B, Bleiner D, Guillong M, Horn I (2003) Geochim Cosmochim Acta 67:3473
40. Russo RE, Mao X, Gonzalez JJ, Mao SS (2002) J Anal At Spectrom 17:1072