Abstract This paper introduces a new long-duration travel diary survey undertaken in a small town and rural environment, which complements the existing urban Mobidrive survey of 1999. Policy-making is dominated by the 1-day view of the world provided by the usual diaries. Long-duration surveys can balance this by highlighting the strong intrapersonal variance in choices, modes used and other aspects of travel behaviour. They also allow us to gain an understanding of the activity space of the travellers. The new 2003 Thurgau data followed the protocol of the earlier study, but developed the set of questions further. These new questions concerned the social context of respondents as well as trip-related items, such as planning horizon of the activity, previous frequency of visits or the groups involved in the trip or activity. The descriptive and model-based analysis of the data showed that respondent fatigue is not an issue in either survey. Where significant deviations from a steady number of reported trips were found, they showed positive tendencies, i.e. learning. The skill accrued in the intensive round of contacts between respondent and interviewer is significant. Papers on travel diaries tend not to report interviewer effects, although their impacts are clearly discernable. The analysis shows that the four interviewers employed in this survey had a substantial effect on the number of reported trips.
Keywords Fatigue Æ Mobidrive Æ Switzerland Æ Thurgau Æ Travel behaviour Æ 6-Week travel diary
K. W. Axhausen (&) Æ M. Lo¨chl
IVT, ETH Zu¨rich, Zu¨rich 8093, Switzerland e-mail: [email protected]
R. Schlich
SBB, Bern 3003, Switzerland T. Buhl Æ P. Widmer
Bu¨ro Widmer, Bahnhofsplatz 76, Frauenfeld 8500, Switzerland DOI 10.1007/s11116-006-9106-4
O R I G I N A L P A P E R
Fatigue in long-duration travel diaries
K. W. Axhausen Æ M. Lo¨chl Æ R. Schlich Æ T. Buhl Æ P. WidmerPublished online: 21 October 2006
1 Introduction: Long-duration surveys and observational studies
Recent years have seen a flurry of long-duration surveys and observational studies. Some were motivated by policy concerns, others by methodological and theoretical issues. The usual 1-day diaries mislead the decision maker or the analyst in overestimating the stability of the behaviour under study; for example, with respect to mode or destination choice. Only multiple-day surveys or observations provide an insight into the amount of intrapersonal variability and, therefore, into the possibilities of how to reinforce desired behaviour already undertaken or how to develop new levers to affect behaviour. Two approaches have been employed for such multiple-day data collection: global positioning system (GPS)-based tracking of cars and persons, and long-duration diaries. Well-known examples of the former include GPS-based observational studies of speed choice by drivers whose cars are equipped with speed advisory systems (Va¨g-verket 2000) or the recent GPS-based studies of simulated road pricing schemes in Copenhagen (Nielsen and Jovicic 2003) or Atlanta (Li et al. 2004). Some surveys have been a combination of GPS-based studies with the traditional 1-day diaries to verify the reported levels of trip making, improve estimates of trip length and duration and add exact route choice information (see, for example, Wolf 2000). New theoretical issues, such as the stability of human travel behaviour (Joh 2004; Joh et al. 2002; Schlich 2004; Schlich and Axhausen2003), the rhythms of activity participation (Bhat et al. 2003, 2004; Scho¨nfelder and Axhausen 2000), innovation rates (Scho¨nfelder and Axhausen 2004) or the size and shape of human activity spaces (Scho¨nfelder and Axhausen 2003a, b), have motivated a series of travel diary studies (Axhausen et al. 2002; Schlich et al. 2004 and the surveys reported below).
In each case, the objectives of the study in question required reporting or observation periods of multiple days (GPS-based supplements to one-day travel diaries), multiple weeks (travel diary studies) or multiple months (GPS-based studies). Second to the recruitment of representative samples, the most important concern of the respective study was the question of reporting (observation) fatigue. While fatigue is usually associated with travel diaries, it can occur in GPS-based studies, when the participant has to install or switch on the device each day or for each trip. Only studies where the device is permanently installed can avoid this issue, but this expense is only warranted when a very long observation period is planned. Fatigue (and its extreme form – attrition) systematically reduces (1) the number of reported mobile days and (2) the number of trips (tours) reported for each mobile day (to be discussed below). The recent availability of a new 6-week travel diary (see below) offers the opportunity to verify the previous results which indicate that fa-tigue is not an issue in well-conducted long-duration diaries. This conclusion was based on the analysis of the 6-week 1999 Mobidrive travel diary (Axhausen et al. 2002) and a 12-week leisure activity diary (Schlich et al.2003). If this result holds up, the field could employ similar surveys readily, when such data are required.
The section immediately following the Introduction describes the new 2003 Thurgau survey in detail, including substantive results derived from the numerous new items tested in it; this is followed by the models estimated here to test individual respondents’ fatigue from the Mobidrive and Thurgau surveys. The final section offers an outlook and conclusions.
2 Thurgau 2003
2.1 Motivation and field work experience
The success of the German Mobidrive1survey encouraged the Swiss Association of Transportation Engineers (SVI) to suggest a similar study for Switzerland aimed at investigating the rhythms of daily travel behaviour and the patterns of space use and innovation within the framework of a long-duration survey. The tender was won by the IVT, ETH Zu¨rich in collaboration with the Bu¨ro Widmer, Frauenfeld, which was responsible for the fieldwork.
The scope and protocol of the Mobidrive survey were maintained in principle, but adjusted to reflect recent experiences and new interests. The one major change was the choice of a small town and its rural hinterland for respondent recruitment; this is in contrast to the large towns of Karlsruhe and Halle, both with over 200,000 inhabitants, which were the locations of the Mobidrive survey.
The protocol involved an announcement letter to randomly chosen residents of Frauenfeld, (the capital of the canton Thurgau, with about 25,000 residents) and villages on the Seeru¨cken, a rural area north of Frauenfeld, south of the Rhine, which delineates the boundary between Germany and Switzerland in this region. Quotas were set for single households, couple households and families (with children over 10 years of age), with each category comprising one third of the overall group. All respondents, including the children, were asked to fill out the questionnaires themselves. The financial incentives were set at 80, 120 and 150 SFr (about 65, 95 and 120 US$), respectively. An effort was made to include commuters, defined as per-sons not working in their residential municipality, but no explicit quota was set (See Tables1 and 2). While not absolutely exact, the quotas were met within an acceptable band. The share of households with commuters is, as expected, sub-stantially higher in the rural villages outside Frauenfeld.
When respondents agreed to participate during a telephone recruitment interview, they were subsequently visited by a member of fieldwork staff, who conducted a 1-h interview that covered the socio-demographics of the household and its members, the home and work relocation history of the persons and the locations of their friends and relatives. The diary was also explained in detail, and the first weekly diary handed over together with a pre-paid return envelope. The respondents received a new diary each week for the next 5 weeks. They were asked to return the diaries at the end of each week, which allowed the fieldwork staff to check the diary and to clarify any errors, omissions and questions shortly after the reporting period. All contact with a particular respondent or household was allocated to one designated interviewer. The respondents received a letter asking them for their account details in week 5, which reminded them of the promised incentive. The field work staff used a large share of the call-backs to obtain detailed address information. The geocoding itself was per-formed separately after the survey had been completed (Machgut and Lo¨chl2004; Machgut et al.2004), as was the addition of information on non-chosen alternatives. Of those contacted and eligible, 16% completed the 6-week diary (Table3). A small number of households recruited toward the end of the survey period (August to December 2003) are counted as complete, although they were given permission 1 The Mobidrive survey is described in detail by Axhausen et al. (2002). A reference list for the research undertaken with it can be found at : http://www.ivt.ethz.ch/vpl/research/mobidrive/index_EN.
not return the forms covering the weeks of Christmas and New Year. This response rate is comparable to those observed in the Mobidrive and SVI 12-week leisure (Schlich et al.2004) surveys. The share of respondents who refused after recruitment during the initial interview, or who did not complete the 6-week diary, is slightly higher than in the earlier surveys but, at 2.5%, it is still acceptable. There is an obvious trade-off between the time spent explaining the survey during the recruit-ment interview and loss of respondents during later stages. There are no substantial differences between the two areas, except the slightly higher rate of non-contact in rural area with higher share of commuters.
Table 1 Number of participating households by category and area
Household type Area Total
Frauenfeld Seeru¨cken
Singles 18 15 33
Couples 19 16 35
Families 11 20 31
Total 48 51 99
Table 2 Number of participating households by presence of commuters and area
Household type Area Total
Frauenfeld Seeru¨cken
Commuter present 21 39 60
No commuter present 27 12 39
Total 48 51 99
Table 3 Response behaviour by area
Area Total
Frauenfeld Seeru¨cken Number Share of letters sent (%)
Share of contacted, eligible households (%)
Announcement letters sent 433 648 1082 100
No valid telephone number 5.5% 3.9% 49 4.5
No telephone contact madea 13.9% 17.3% 172 15.9 Did not match quota criteria 5.1% 5.7% 59 5.5
No contact attemptb 18.9% 19.1 206 19.1
Contacted, eligible households 56.6% 54.0% 596 55.1
Refused by calling in 7.4% 6.9% 77 7.1 12.9
Refused when called 32.1% 31.5% 343 31.7 57.6
Quota already exhausted 3.9% 6.8% 61 5.6 10.2
Recruited on the phone 13.2% 8.8% 114 10.7 19.3
Refused during the initial interview
1.2% 0.6% 9 0.8 1.5
Discontinued after starting 0.9% 0.3% 6 0.6 1.0
Full participation 11.1% 7.9% 99 9.2 16.1
a Not reached after five contact attempts spread over the whole day and a number of days b Not contacted, as all quotas had been filled
Using the CASRO standard the response rate (unknowns allocated to eligible and ineligible status) is 13.2% (see http://www.home.clara.net/sisa/resprhlp.htm for the calculations).
To place the participants in the context of the local population, we asked the persons who had refused to participate to answer a small set of questions about their household. A total of 212 persons answered these questions for their households, while an additional 49 persons answered for households that were, in one way or another, not eligible for participation in the survey. Therefore, information on 261 households was available for a selectivity analysis. Using the binary logistic proce-dure ofSPSS 12.0 (SPSS, Chicago, Ill.), we estimated a logit model using the
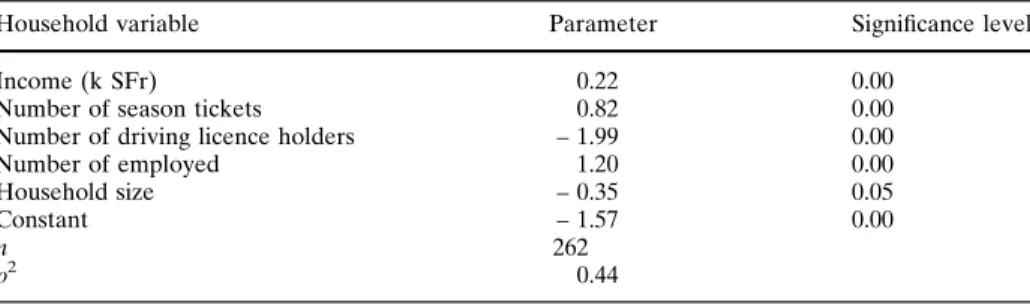
log-likelihood ratio test forward entry method to identify relevant variables. The Expectation Maximisation method was used to impute any missing value on that short interview, employing all available variables. The fit of the model is good, identifying 84% of the households correctly with a q2of 0.44 (See Table4).
In contrast to the Mobidrive experience, there are many variables influencing participation in the 2003 Thurgau survey. Income, number of public transport season tickets and number of employed increased participation significantly, while licence ownership and household size decreased it. Location, household tenure and number of children had no significant impact. Like other recent Swiss surveys with sub-stantial response burdens, higher-income, employed public transport users are more likely to participate in such exercises [see Axhausen et al. 2004; Ko¨nig 2004 or a recent (not yet reported) SP survey].
2.2 The new variables
While the study used the same protocol as the earlier Mobidrive study, it did adjust the contents in various areas. In the person questionnaire, two innovative elements were added. People were asked to report their home and work locations on April 1st(a traditional moving/relocation day in Switzerland) of each of the preceding 10 years and to provide details on the availability of their car and/or possession of a season ticket for each of those days. This biographical element, which had been tested in an earlier study (Axhausen et al.2004), adds depth to the analysis of the activity spaces (see above for references), as it describes the level of local knowledge. Activity spaces should be influenced by the locations of the most important friends and rel-atives (see Axhausen2005,2006). Using a simple name generator, the respondents reported the names, addresses and frequency of visits to up to four non-resident family members and up to five friends and acquaintances whom they see regularly.
Table 4 Results of selectivity analysis (base: households completing the interview against non-participating households; excluding non-eligible households)
Household variable Parameter Significance level
Income (k SFr) 0.22 0.00
Number of season tickets 0.82 0.00
Number of driving licence holders – 1.99 0.00
Number of employed 1.20 0.00
Household size – 0.35 0.05
Constant – 1.57 0.00
n 262
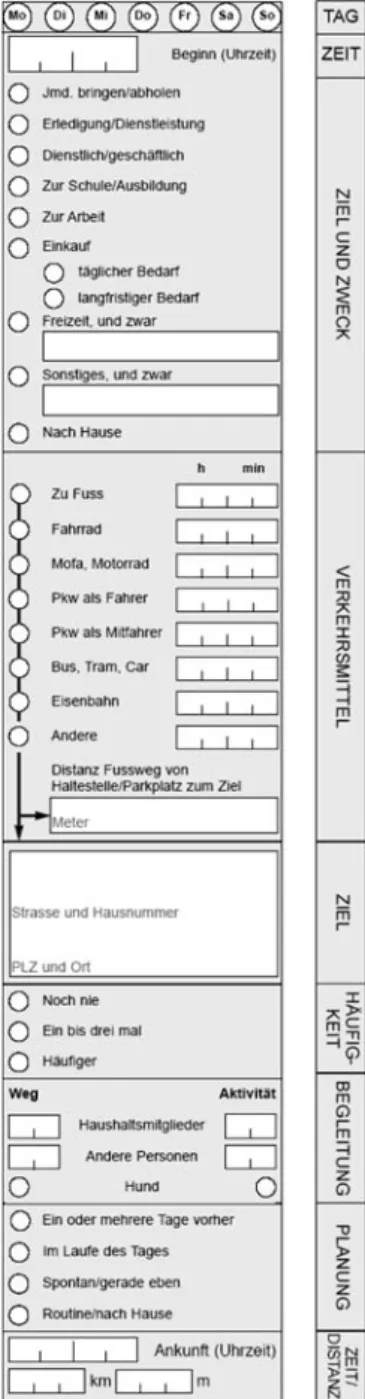
The design of the weekly diary was left unchanged (Fig.1), but the Mobidrive questions about trip and activity expenditures were changed, and the question about the size of the party was modified. The expenditure questions were deemed too
Day of week (tick circles for each day) Departure time (military time)
Purpose
Dropping off or picking up, private business, work related business, school or training, work (at work place), shopping (grocery/daily or longer term goods)
Leisure (pleases pecify) Other (please specify) Return home
Mode, indicating the minutes spent travelling with each
Walking, bicycling, motorcycle, car as driver, car as passenger, local public transport, heavy rail, other
Distance walked from the stop or parking space
Exact street address of destination Frequency of visit
Never before Once to three times More often
Number of people travelling with
respondents/joining them during the activity Household members
Other persons Household dog
Time since the activity was planned One or more days in advance During the course of the day Spontaneous/right now Routine/return home Arrival time (military time) Distance travelled (km and meters)
sensitive and less interesting (in the Swiss context) than the new ones. The new or adapted questions were:
• What is the walking distance from the point where you left the last vehicle used to reach your destination?
• How often have you visited this location before (never, one to three times, more often)?
• When did you plan this activity (one or more days in advance, during the day, spontaneous, routine/returning home)?
• How many people travelled with you (number of household members, others, dog)?
• How big was the group with which you performed the activity (number of household members, others, dog)?
The second question is prompted by our interest in behavioural innovation (Scho¨nfelder and Axhausen 2004). In earlier surveys, it had been possible to determine whether a location was new to the observing researcher, but not whether it was new to the respondent. This question filled that gap and created no problems for the respondents. The third question was adapted from work on activity sched-uling pioneered by Doherty and Miller (2000). When evaluated together with the second new question, it provides more insight into the stability of travel behaviour. While many surveys in the past have asked about travel group size, fewer have divided it by household and non-household members. The importance of the dog’s presence was established in the Mobidrive and the 12-week leisure activity surveys. Most time budget diaries tend to query the presence of others in a purely qualitative fashion. Given the importance of the social element of leisure travel in particular, this double question fills a gap, indicating the group size while travelling and while performing the activity. It reveals the number of the persons met.
Because this paper is directed toward the analysis of fatigue aspects of a respondent’s reports, it contains no in-depth analysis of new variables. However, a number of descriptive analyses will be presented below to indicate their possibilities.
The respondents reported having no difficulty in naming significant relatives and contacts and the frequency of contact with them (Fig.2). The more detailed rela-tionships were grouped into nine categories; two of these were dropped as their occurrence was too insignificant for further analysis (neighbours and non-residential partners). While the range of family contacts is predictable, categories of personal contacts are surprising. Acquaintances and ‘‘Kollegen’’, (a Swiss-German term which includes co-workers and classmates, but implies a less intensive form of friendship), figure prominently. The mean and median (not shown here) distances between the homes of the respondents and their contacts vary systematically with the frequency of contact.
Equally surprising is the importance of activities planned substantially in advance for ‘never-before-visited’ locations (Table5). The numbers are threefold higher than for the other two relevant categories. The share of never-before-visited locations is quite substantial – 4%, or about one completely new location per week. Routine and long-planned activities dominate, while spontaneous activities comprise 10% of the total. Comparisons are difficult, as other surveys asking this question chose different categorisations.
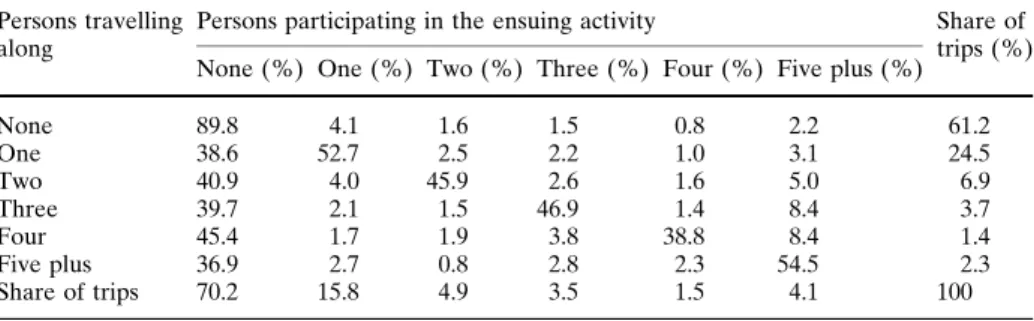
There seems to be pervasive ‘‘lift-giving’’ in this sample of trips, but the bulk is associated with trips returning home, where the group seems to dissolve, largely because the diary does not ask about in-home activities (Table6). Still, the data highlight the importance of meeting those with whom the respondent had not travelled before for an activity.
3 Modelling fatigue effects
The key problem for any survey is first winning the commitment of the respondents at the recruitment stage and then maintaining it while the respondents perform the tasks requested by the survey. This arc from the first contact until the respondent returns the questionnaire, puts down the phone after the last answer, logs out from
Meeting frequency
Up to more than year Once a month
More than monthly Once a week
More than weekly
Mean distance between homes
60 50 40 30 20 10 0 Relationsship Friend "Kollege" Acquaintance Children Parents Siblings Other family
Fig. 2 Distance between homes of the respondents and their contacts by type
Table 5 Share of trips by timing of planning and frequency of previous visits to the visited location (row percentages)
Frequency of visit to this location
When planned Share of
trips (%) One or more days in advance (%) During the day (%) Spontaneous (%) Routine/return home (%) Never before 60.8 16.7 22.5 4.1
One to three times 53.2 23.0 23.8 6.4
More often 14.3 8.6 9.7 67.5 89.5
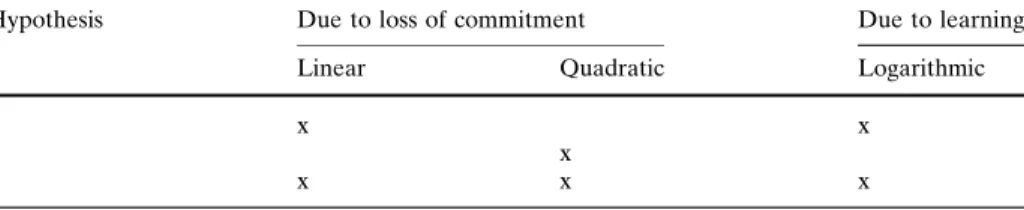
the website or says good-bye to the interviewer requires the full attention of the survey designer. The protocol, tools and forms used can irritate the respondents in various ways – to the point where they discontinue the interaction. In long-duration surveys, boredom with the task can reinforce this process. As the literature available on survey methods (e.g. Dillman1978,2000; Groves1989) highlights such pitfalls, we will not explore the ’fatigue’ effects at this point. Equally problematic for the survey designer is the partial loss of commitment, which manifests itself in item non-response, random answers or episode non-response.2In this case, the most-affected category is trips, which the respondents are asked to report daily in varying numbers. In many shorter diaries (2–7 days), this loss of commitment was demonstrated in a systematic reduction in the number of reported trips as the reporting period went on (e.g. Golob and Meurs1986; Kitamura and Bovy1987; Van Wissen and Meurs1989; Zumkeller 1999). The a priori assumption postulates that this loss of commitment (or survey fatigue) should manifest itself as a steadily decreasing number of reported trips as a function of the duration of the reporting period. This function might be linear or non-linear. In the protocol described above, two countervailing processes are at work: the respondent learns about his task to a degree that a respondent in a 2-, 3- or 7-day survey never does. One would assume that this makes the task easier and less error-prone. In addition, the participant’s commitment is reinforced by a steady stream of interactions with the assigned fieldwork staff: weekly mailings, regular call-backs to clarify errors and problems and a growing recognition of each other as an individual person. For example, on one hand, the interviewer asks about trips which he/she would have expected to have been reported, as has been done in previous weeks and, on the other hand, the importance of the study to the staff becomes obvious to the respondent. One would expect that learning and mainte-nance of the commitment level should increase the number of reported trips. As there is a natural maximum, this increase reaches a limit, implying, for example, a logarithmic shape of the functional relationship. Thus, any model of fatigue has to test a number of different hypotheses on the impact of the reporting period, which combine these processes, while being aware of the strong correlations between the linear and transformed variables:
Table 6 Share of trips as catagorised by number of persons travelling along and participating in the ensuing activity (row percentages)
Persons travelling along
Persons participating in the ensuing activity Share of trips (%) None (%) One (%) Two (%) Three (%) Four (%) Five plus (%)
None 89.8 4.1 1.6 1.5 0.8 2.2 61.2 One 38.6 52.7 2.5 2.2 1.0 3.1 24.5 Two 40.9 4.0 45.9 2.6 1.6 5.0 6.9 Three 39.7 2.1 1.5 46.9 1.4 8.4 3.7 Four 45.4 1.7 1.9 3.8 38.8 8.4 1.4 Five plus 36.9 2.7 0.8 2.8 2.3 54.5 2.3 Share of trips 70.2 15.8 4.9 3.5 1.5 4.1 100
2 The literature available on survey methods does not offer a good term for non-response at episode level, such as trips in travel diaries, times of unemployment in life course calendars, hospital stays in health questionnaires, among others. Item non-response is specific to the individual variable describing an episode or unit, while the term unit non-response is reserved for person or household non-response.
Hypothesis Due to loss of commitment Due to learning
Linear Quadratic Logarithmic
1 x x
2 x
3 x x x
3.1 Descriptive results
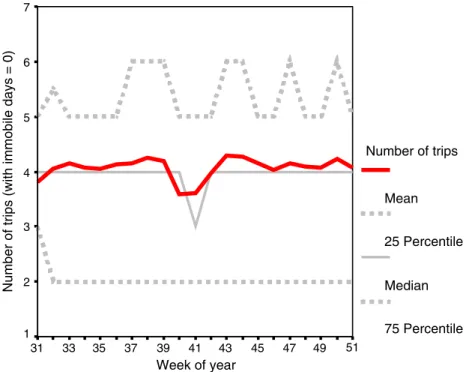
Next to the impact of the on-going reporting period, one would expect that seasons have an impact on the level of trip making, as well as the interaction with the interviewer (see for example Christensen2004for an analysis of the Danish National Travel Survey). A more detailed analysis of socio-demographic and household factors influencing the level of trip making is not required here and will be reported elsewhere. As Figs.3and4make clear, there is no prima-facie evidence of fatigue at the aggregate level. A school holiday week has the biggest impact.
The impact of school holiday weeks and the reporting holiday of the households starting in weeks 46 and 47, mentioned above, is visible in Fig.5. Here, the shares of four possible returns for each day are shown by starting week of the reporting period, i.e. when the respondents began their participation. While there is variation, there is no trend, particularly for the shares of immobile days and the days without any report.
Week of reporting period
6 5 4 3 2 1
Number of trips (with immobile days = 0)
7 6 5 4 3 2 1 Number of trips Mean 25 Percentile Median 75 Percentile
Week of year 51 49 47 45 43 41 39 37 35 33 31
Number of trips (with immobile days = 0)
7 6 5 4 3 2 1 Number of trips Mean 25 Percentile Median 75 Percentile
Fig. 4 Number of reported trips as a week of year function
Starting week of reporting period
47 43 39 35 31 Share 1.0 .8 .6 .4 .2 0.0 Mobile Immobile w/o report Holiday absence
3.2 Interviewer effects
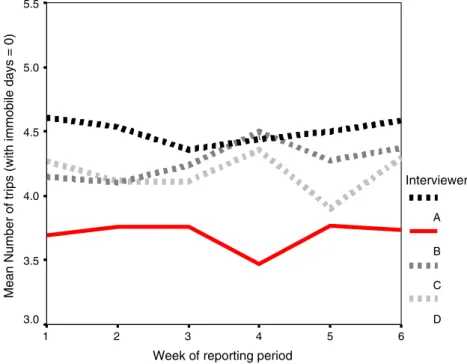
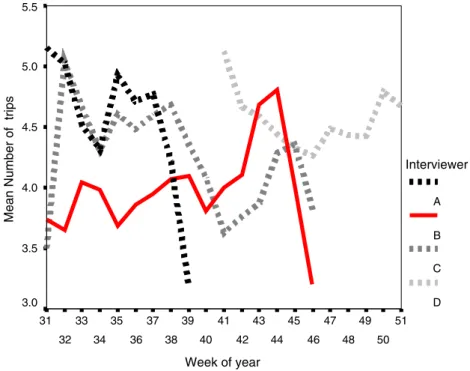
Interviewers’ impacts are much more substantial and interesting. Interviewer B’s mean impact is clearly visible in Fig.6, but Fig.7puts this in perspective. It is clear that interviewer B ‘learned on the job’, but that he (like the others) flagged towards the end of his engagement. He was the only male. A univariate analysis of trip number variance revealed a more differentiated picture. Controlling for home location, income, age (in decades), sex, interaction of car and season ticket ownership, we realized that interviewer B’s respondents reported significantly fewer trips – independent of their sex – than those of interviewer D. In comparison with interviewer D, interviewers A and C received significantly more trips from male respondents.
The analysis also showed that the effects of the interviewer remained stable over the reporting period. The initial contact experience – perhaps sympathy between respondent and interviewer – seems to be the prime determinant.
3.3 Regression results
In an analysis of fatigue, one is not interested in the mean levels; the crucial factor is whether the individual respondents show signs of fatigue. Consequently, the analysis was performed for each individual separately after standardising the reported numbers of trips to a mean of zero and standard deviation of one. This also removes interviewer impacts (but see below). Using the Generalised Linear Model procedure ofSPSS 12 and the SAS PROC GENMOD (SAS Institute, Cary, N.C.) for a Poisson
regression, the hypotheses outlined above were estimated for each respondent –
Week of reporting period
6 5 4 3 2 1
Mean Number of trips (with immobile days = 0)
5.5 5.0 4.5 4.0 3.5 3.0 Interviewer A B C D
while controlling for day-of-week effects, which were estimated to be equal for all respondents. To put the 2003 Thurgau data in perspective, the same analysis was performed with the 1999 Mobidrive data, which extends the fatigue modelling re-ported for this dataset in Axhausen et al.2002. For space reasons, only hypotheses 1 and 3 results will be presented in the following discussions.
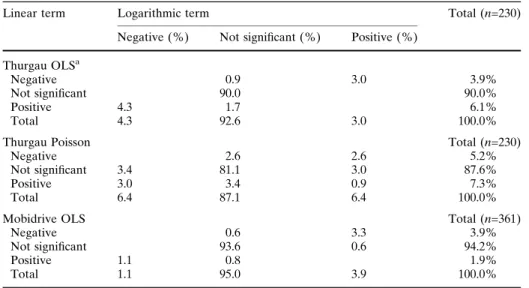
The results in Tables7–10confirm the impression of the descriptive analysis. No significant effects can be detected in the vast majority of respondents. In 85–95% of the cases one or both of the parameters are insignificant. In cases where significant effects are detectable, they indicate a continuing increase in the reporting of trips (only positive effects) or mixed effects, where the direction of the total effect is determined by the size of the parameter estimates. We found no case where both or all three parameters were significant and negative. The Thurgau and the Mobidrive results are similar in this respect, even if the Mobidrive data are less affected by time trends, in both a positive (learning) or negative way (fatigue). As the log and the linear terms are strongly correlated, the Ordinary Least Squares (OLS) analysis was repeated with only the linear or the logarithmic term. The number of significant results was even smaller than those reported so far.
Linear regression is not ideal for the count data, such as the number of trips, con-sidered here. The models were therefore re-estimated using Poisson regression using SASPROC GENMOD. Again, the regressions were calculated for each person, but
day-of-week effects were estimated here at the person level. As the count data were not standardized for the Poisson regression, the mean trip rate was characterised through a constant. The results of the analysis were the same as above. There were few significant effects, and most of those that are significant are also positive, indicating learning.
Week of year 51 50 49 48 47 46 45 44 43 42 41 40 39 38 37 36 35 34 33 32 31
Mean Number of trips
5.5 5.0 4.5 4.0 3.5 3.0 Interviewer A B C D
Table 7 Results for hypothesis 1 (significance level = 0.05)
Linear term Logarithmic term Total (n=230)
Negative (%) Not significant (%) Positive (%) Thurgau OLSa
Negative 0.9 3.0 3.9%
Not significant 90.0 90.0%
Positive 4.3 1.7 6.1%
Total 4.3 92.6 3.0 100.0%
Thurgau Poisson Total (n=230)
Negative 2.6 2.6 5.2%
Not significant 3.4 81.1 3.0 87.6%
Positive 3.0 3.4 0.9 7.3%
Total 6.4 87.1 6.4 100.0%
Mobidrive OLS Total (n=361)
Negative 0.6 3.3 3.9%
Not significant 93.6 0.6 94.2%
Positive 1.1 0.8 1.9%
Total 1.1 95.0 3.9 100.0%
Table 8 Results for hypothesis 3: Thurgau OLS (significance level = 0.05)
Linear term Quadratic term Logarithmic term Total (n=230)
Negative (%) Not significant (%) Positive (%) Negative Negative
Not significant
Positive 0.4 5.7 6.1%
Not significant Negative 0.9 0.9%
Not significant 87.0 0.9 87.9% Positive 0.9 0.9% Positive Negative 2.6 2.6% Not significant 1.7 1.7% Positive Total 4.3 89.1 6.5 100.0%
Table 9 Results for hypothesis 3: Thurgau Poisson (significance level = 0.05)
Linear term Quadratic term Logarithmic term Total (n=230)
Negative (%) Not significant (%) Positive (%) Negative Negative
Not significant 0.9 0.9%
Positive 1.3 5.2 6.5%
Not significant Negative 1.3 1.3%
Not significant 0.9 79.1 1.7 81.7% Positive 2.2 2.2% Positive Negative 2.6 3.5 6.1% Not significant 1.3 1.3% Positive Total 4.8 88.3 7.0 100.0%
In summary, the results clearly indicate the absence of fatigue effects for these two samples. It would appear that the learning effects predominate. The well-doc-umented fatigue in the other multiple day diaries should therefore be attributed to the lack of interaction with the survey fieldworkers, the lack of an incentive to accomplish the survey task better and a too short time horizon, which made such learning unattractive.
4 Outlook and conclusions
This paper presents a new long-duration travel diary survey covering a small town and rural environment, which complements the existing 1999 Mobidrive survey. The 2003 Thurgau survey followed the protocol of the earlier study but developed the set of questions further. These new questions aimed at assessing the social context of the respondents as well as trip-related items, such as the planning horizon of the activity, previous frequency of visit or the number of persons involved in the trip or activity. The selectivity analysis showed that the participants are significantly different from the participants in the recruitment interview and by extension different from the population as whole. Nevertheless, the overall pattern of trip making is not unusual. The level of days without travel is as expected (See Madre et al.2006).
The descriptive and model-based analyses of the data show that respondent fa-tigue is not an issue in either survey. Where significant deviations from a steady number of reported trips were found, they showed positive tendencies. The skills accrued in the intensive round of contacts between respondent and interviewer are significant and help to counteract any boredom and fatigue.
Papers on travel diaries tend not to report interviewer effects, although their potential impacts are clearly discernable and well known from the general survey literature. The analysis of these effects presented here shows that the four inter-viewers employed in this survey have a substantial effect on the number of reported trips, even after correcting for the socio-demographics of the respondents. The size of the effect raises the question of whether the missing trips and journeys should be imputed. The results of numerous comparisons between GPS-based observations and parallel diaries raise the same issue – a substantial underreporting of trips and journeys – although possibly for other reasons. This challenge will be the subject of later work.
Table 10 Results for hypothesis 3: Mobidrive OLS (significance level = 0.05)
Linear term Quadratic term Logarithmic term Total (n=230)
Negative (%) Not significant(%) Positive(%) Negative Negative
Not significant 1.4 1.4%
Positive 1.4 3.9 5.3%
Not significant Negative 0.3 0.3%
Not significant 88.1 1.1 89.2% Positive Positive Negative 2.8 0.8 3.6% Not significant 0.3 0.3% Positive Total 2.8 90.9 6.4 100.0%
The availability of the fully geocoded Thurgau dataset allows a wide variety of further analyses. Choice models can be estimated to highlight mode and destination choice, both at the trip and tour levels (see Cirillo et al.2004 and Cirillo and Ax-hausen 2006 for a possible approach). More importantly, the dataset allows the investigation of factors not visible in 1- or 2-day diaries: rhythms of activity parti-cipation by type and location, and interactions between household members over time, or the size and structure of activity spaces (for some initial results see Lo¨chl et al.2005). Finally, the data could be used to calibrate activity scheduling models, as long-duration information about planning horizons is now available for the first time.
Acknowledgements The study was supported by a grant of the Swiss Department for Environment, Transport, Energy and Telecommunications, and was administered and initiated by the Swiss Association of Transport Engineers (SVI). This and the support and suggestions of the Advisory Group chaired by Dr. G. Abay are gratefully acknowledged. We are also grateful for the careful comments of the anonymous referees.
References
Axhausen, K.W.: Social networks and travel: some hypotheses. In: Donaghy, K., Poppelreuter, S., Rudinger, G. (eds.) Social Dimensions of Sustainable Transport: Transatlantic Perspectives. pp. 90–108, Ashgate, Aldershot (2005)
Axhausen, K.W.: Social factors in future travel: A qualitative assessment, IEE Proceedings Intelli-gent Transport Systems (2006, in press)
Axhausen, K.W., Beige S., Martinovits, A.: Vertiefte Auswertungen zur langfristigen ra¨umlichen Mobilita¨t, Forschungsprogramm UNIVOX 2003 Teil I G Verkehr, Vertiefungsbericht, Arbeitsberichte Verkehrs- und Raumplanung, 238, Institut fu¨r Verkehrsplanung und Trans-portsysteme (IVT), ETH Zu¨rich, Zu¨rich (2004)
Axhausen, K.W., Ko¨nig, A., Abay, G., Bates, J.J., Bierlaire, M.: Swiss value of travel time savings, paper presented at the 2004 European Transport Conference, Strasbourg, October 2004 (2004) Axhausen, K.W., Zimmermann, A., Scho¨nfelder, S., Rindsfu¨ser, G., Haupt, T.: Observing the
rhythms of daily life: a six-week travel diary. Transportation 29, 95–124 (2002)
Bhat, C.R., Srinivasan, S., Axhausen, K.W.: An analysis of multiple interactivity durations using a unifying multivariate hazard model, Arbeitsberichte Verkehrs- und Raumplanung, 191, Institut fu¨r Verkehrsplanung und Transportsysteme (IVT), ETH Zu¨rich, Zu¨rich (2003)
Bhat, C.R., Frusti, T., Zhao, H., Scho¨nfelder, S., Axhausen, K.W.: Intershopping duration: An analysis using multi-week data. Transport. Res. 38B, 39–60 (2004)
Christensen, L.: Busy people are hard to reach, paper presented at the Seventh International Conference on Travel Survey Methods, Costa Rica, August 2004 (2004)
Cirillo, C., Koppelman, F., Axhausen, K.W.: Modelling activity travel scheduling for workers, paper presented at the Workshop Activity-based Analysis, Maastricht, May 2004 (2004)
Cirillo, C., Axhausen, K.W. Evidence on the distribution of values of travel time savings from a six-week diary, Transport. Res. A 40A:444–457 (2006)
Dillman, D.A.: Mail and Telephone Surveys: The Total Design Method. John Wiley and Sons, New York (1978)
Dillman, D.A.: Mail and Internet Surveys: The Tailored Design Method. John Wiley and Sons, New York (2000)
Doherty, S.T., Miller, E.J.: A computerized household activity scheduling survey. Transportation 27 75–97 (2000)
Golob, T.F., Meurs, H.J.: Biases in response over time in a seven-day travel diary. Transportation 13 163–181 (1986)
Groves, R.M.: Survey Errors and Survey Costs. John Wiley & Sons, New York (1989)
Joh, C.H.: Measuring and predicting adaptation in multidimensional activity-travel patterns, bouwstenen faculteit bouwkunde, vol. 79, PhD thesis, Technical University of Eindhoven, The Netherlands (2004)
Joh, C.H., Arentze, T.A., Hofman, F., Timmermans, H.J.P.: Activity pattern similarity: a multidi-mensional alignment method. Transportation Research B 36:385–403 (2002)
Kitamura, R., Bovy, P.H.L.: Analysis of attrition biases and trip reporting errors for panel data. Transport. Res. 21A:287–302 (1987)
Ko¨nig, A.: Bewertung der Verla¨sslichkeit: Experiment mit Schweizer Befragten. PhD thesis, ETH Zu¨rich, Zu¨rich (2004)
Li, H., Guensler, R., Ogle, J., Wang, Jun.: Using GPS data to understand day-to-day dynamics of morning commute behaviour, paper presented at the 83rd Annual Meeting of the Transporta-tion Research Record, Washington, DC, January 2004 (2004)
Lo¨chl, M., Scho¨nfelder, S., Schlich, R., Buhl, T., Widmer, P., Axhausen, K.W.: Untersuchung der Stabilita¨t des Verkehrsverhaltens, final report for SVI 2001/514, Schriftenreihe, vol. 1120, Bundesamt fu¨r Strassen, UVEK, Bern (2005)
Machguth, H., Lo¨chl, M.: Geokodierung 6-Wochenbefragung Thurgau 2003, Arbeitsberichte Ver-kehrs- und Raumplanung, vol. 219, IVT, ETH Zu¨rich, Zu¨rich (2004)
Machguth, M., Lo¨chl, M., Bu¨rgle, M.: Berechnung von Routen- und Verkehrsmittelalternativen fu¨r den Datensatz Thurgau 2003, Arbeitsberichte Verkehrs- und Raumplanung, vol. 231, IVT, ETH Zu¨rich, Zu¨rich (2004)
Madre, J.-L., Axhausen, K.W., Bro¨g W.: Immobility in travel diary surveys, Transportation (2006, in press)
Nielsen, O.A., Jovicic, G.: The AKTA road pricing experiment in Copenhagen, paper presented at the 10th International Conference on Travel Behaviour Research, Lucerne, August 2003 (2003) Schlich, R.: Verhaltenshomogene Gruppen in La¨ngsschnitterhebungen, PhD thesis, ETH Zu¨rich,
Zu¨rich (2004)
Schlich, R., Axhausen, K.W.: Habitual travel behaviour – evidence from a six week travel diary. Transportation 30, 13–36 (2003)
Schlich, R., Simma, A., Axhausen, K.W.: Determinanten des Freizeitverkehrs: Modellierung und empirische Befunde, Forschungsauftrag SVI 2000/443, Schriftenreihe, vol. 1071, Bundesamt fu¨r Strassen, UVEK, Bern (2003)
Scho¨nfelder, S., Axhausen, K.W.: On the variability of human activity spaces. In M. Koll-Schret-zenmayr, M. Keiner and G. Nussbaumer (eds.) The Real and Virtual Worlds of Spatial Planning, pp. 237–262, Springer, Heidelberg (2003a)
Scho¨nfelder, S., Axhausen, K.W.: Activity spaces: Measures of social exclusion?. Transport. Policy 10, 273–286 (2003b)
Scho¨nfelder, S., Axhausen, K.W.: Periodizita¨t im Verkehrsverhalten: Erste Ergebnisse mit U¨ berle-benszeitmodellen. Stadt Region Land 69, 131–144 (2000)
Va¨gverket: ISA Intelligent Speed Adaptation, Va¨gverket, unpublished, Va¨gverket, Borla¨nge (2000) Van Wissen, L.J.G., Meurs, H.J.: The Dutch mobility panel: experiences and evaluation.
Trans-portation 16, 99 – 119 (1989)
Wolf, J.: Using GPS Data Loggers to Replace Travel Diaries in the Collection of Travel Data, PhD thesis, Georgia Institute of Technology, School of Civil and Environmental Engineering, Atlanta (2000)
Zumkeller, D.: Das Mobilita¨t Panel (MOP): Eine neue aktuelle Datenbasis fu¨r integrierte Ver-kehrsplanung, IVF – Report, vol. 99–1, IfV, Universita¨t Karlsruhe, Karlsruhe (1999)
Authors Biography
Dr. Kay W. Axhausen is Professor of Transport Planning at the Eidgeno¨ssische Technische Ho-chschule (ETH) Zu¨rich. Prior to his appointment to the ETH, he worked at the Leopold-Franzens Universita¨t, Innsbruck, Imperial College London and the University of Oxford. He has been in-volved in the measurement and modelling of travel behaviour for the last 25 years, contributing especially to the literature on stated preferences, microsimulation of travel behaviour, valuation of travel time and its components, parking behaviour, activity scheduling and travel diary data col-lection.
Michael Lo¨chl is a regional planner and PhD candidate at the Institute of Transport Planning and Systems, ETH Zurich. His research interests include urban simulation models, road pricing effects as well as urban and regional economics.
Paul Widmer holds degrees in civil engineering from ETH Zu¨rich (dipl.-ing) and transportation from MIT (Msc). Following 6 years with the Canton Thurgau, he set up an independent consultancy in 1983.
Thomas Buhl is a civil and environmental engineer (dipl.-ing ETH Zu¨rich). He has been working for the last 10 years as a transport planner and traffic engineer focusing on transport planning, infrastructure design and research at Bu¨ro Widmer, Frauenfeld.
Dr. Robert Schlich a regional planner, works for the Swiss Federal Railroads, Bern in their longer term demand modelling department. His PhD thesis at ETH Zu¨rich analysed the variability and stability of travel behaviour using the 6-week Mobidrive travel diary.