Lars Husmann Hatem Alkadhi Thomas Boehm Sebastian Leschka Tiziano Schepis Pascal Koepfli Lotus Desbiolles Borut Marincek Philipp A. Kaufmann Simon Wildermuth Received: 13 September 2005 Revised: 21 November 2005 Accepted: 29 November 2005 Published online: 28 January 2006 # Springer-Verlag 2006
Influence of cardiac hemodynamic parameters
on coronary artery opacification with 64-slice
computed tomography
Abstract The purpose of this study was to evaluate the influence of ejection fraction (EF), stroke volume (SV), heart rate, and cardiac output (CO) on coronary artery opacification with 64-slice computed tomography (CT). Sixty patients underwent, retro-spectively, electrocardiography-gated 64-slice CT coronary angiography. Left ventricular EF, SV, and CO were calculated with semi-automated software. Attenuation values were measured and contrast-to-noise ratios (CNRs) were calculated in the proximal right coronary artery (RCA) and left main artery (LMA). Mean EF during scanning was 61.5±12.4%, SV was 63.2±15.6 ml, heart rate was 62.5±11.8 beats per minute (bpm), and CO was 3.88±1.06 l/min. There was no significant correlation between the EF and heart rate and the attenu-ation and CNR in either coronary
artery. A significant negative correla-tion was found in both arteries between SV and attenuation (RCA r=−0.26, P<0.05; LMA r=−0.34, P<0.01) and between SV and CNR (RCA r=−0.26, P<0.05; LMA r=−0.26, P<0.05). Similarly, a significant negative cor-relation was found between the CO and attenuation (RCA r=−0.42, P<0.05; LMA r=−0.56, P<0.001) and between the CO and CNR (RCA r=−0.39, P<0.05; LMA r=−0.44, P<0.001). The actual hemodynamic status of the patient influences the coronary artery opacification with 64-slice CT, in that vessel opacification decreases as SV and CO increase.
Keywords 64-Slice computed tomography . Cardiac .
Coronary artery . Opacification . Hemodynamic status
Introduction
Current data suggest that 64-slice computed tomography (CT) is highly accurate for the diagnosis of significant coronary artery stenoses [1,2]. As compared with previous 4-detector and 16-detector row CT scanners, 64-slice CT enables faster scanning, owing to an increased number of detector elements and faster gantry rotation, and provides, at the same time, higher spatial resolution due to smaller detector collimation widths [3]. Despite these advance-ments of CT technology, degradation of image quality of coronary CT angiography still occurs and has several causes. For example, patient-related factors, such as high heart rates [1, 2, 4–6], arrhythmia [7], high body mass index
(BMI) [2,8], and a high calcium load [1,2,6] are known to negatively affect image quality of coronary CT angiogra-phy. Furthermore, CT-related factors, such as artifacts deriving from misregistration with the electrocardiography (ECG) signal [9] or coronary motion beyond the temporal resolution of the scanner [1, 2, 5, 6, 10], may also con-tribute to decreased image quality. Finally, factors related to the contrast material regimen, such as the type and iodine concentration of the contrast material [11], the technique for bolus timing [12], and the injection volume and rate [13], have been shown to affect the attenuation of coronary arteries and thus the overall image quality.
For optimal coronary artery attenuation, accurate syn-chronization between the arterial passage of the contrast
L. Husmann . H. Alkadhi (*) . T. Boehm . S. Leschka . L. Desbiolles . B. Marincek Department of Medical Radiology, Institute of Diagnostic Radiology, University Hospital of Zurich, Raemistrasse 100,
8091 Zurich, Switzerland e-mail: [email protected] Tel.: +41-1-2551111
Fax: +41-1-2554443
T. Schepis . P. Koepfli . P. A. Kaufmann . S. Wildermuth
Cardiovascular Center, University Hospital of Zurich, Zurich, Switzerland
P. A. Kaufmann
Center for Integrative Human Physiology, University of Zurich,
agent bolus in relation to the start of CT data acquisition is required [12]. An additional important factor affecting the timing of contrast medium enhancement is cardiac output (CO) [14]. It has been clinically observed that reduced CO results in delayed and increased vascular enhancement [15]. Despite the importance of cardiac function for vessel opa-cification, to our knowledge, no study has investigated the influence of cardiac hemodynamic parameters on coronary artery attenuation. Optimal vessel attenuation, however, is essential for the detection of stenoses and atherosclerotic plaques and to ensure reliable results during image post-processing [16]. The purpose of this study was to evaluate the effect of ejection fraction (EF), stroke volume (SV), heart rate, and CO on coronary artery opacification with 64-slice CT.
Materials and methods
Patients
Between April and August 2005, 60 patients (22 women, 38 men; mean age 61.9±10.5 years; age range 38 years to 81 years; mean BMI 25.0±2.9 kg/m2) were prospectively enrolled for coronary CT angiography. Patients had symp-toms of angina pectoris (n=41), atypical chest pain and high risk for coronary artery disease (n=14), or recurrent symptoms after previous balloon angioplasty (n=5). Thirty-nine patients (65%) were receiving oralβ-receptor block-ing treatment as part of their baseline medication at the time of the CT scan; no additional intravenously administered β-blockers were administered prior to CT. Exclusion cri-teria for CT were allergy to iodine-containing contrast medium, renal insufficiency (creatinine level >120μmol/l), pregnancy, arrhythmia, hemodynamic instability, previous stent graft or bypass surgery, cardiac valve disorders, and abnormal coronary origins or ostial stenoses. Furthermore, patients that were underweight (i.e., BMI <18.5 kg/m2) or obese (i.e., BMI >30 kg/m2) were not included in this study to avoid possible interference of body weight on contrast-to-noise ratio (CNR) calculations. The study protocol was approved by the local ethics committee, and written in-formed consent was obtained from all patients.
CT data acquisition and post-processing
All CT scans were performed with a 64-slice CT scanner (Somatom Sensation 64, Siemens Medical Solutions, Forch-heim, Germany). Scanning parameters were: detector col-limation of 32 mm × 0.6 slice colcol-limation of 64 × 0.6 mm, tube rotation time of 330 ms, pitch of 0.24, tube potential of 120 kV, and tube current of 650 mAs. A bolus of 80 ml of iodixanol (Visipaque 320, 320 mg/ml, Amersham Health, Buckinghamshire, UK), followed by 30 ml saline solution, was continuously injected into a right antecubital
vein via a 18-20-gauge catheter at a flow rate of 5 ml/s. Bolus tracking was performed with a region of interest (ROI) placed into the ascending aorta, and image acquisition was automatically started 5 s after the signal attenuation reached a pre-defined threshold of 140 Hounsfield units (HU). Syn-chronized to the ECG data, CT data sets were retrospectively reconstructed throughout the cardiac cycle in 10% steps of the R–R interval. The adaptive cardio-volume approach was used for image reconstruction, which automatically switches between one- and two-segment reconstruction depending on the patient’s heart rate [17]. Using a medium soft-tissue convolution kernel (B30f), axial images for CNR calcula-tions were reconstructed with a slice thickness of 0.75 mm and an increment of 0.5 mm. Images for calculations of hemodynamic parameters were reconstructed with the same kernel in the short axis of the left ventricle (LV) with a slice thickness of 3 mm and an increment of 3 mm.
CT data analysis
Reconstructed images were transferred to an external work-station (Leonardo, Siemens Medical Solutions). LV end diastolic and end systolic volumes were determined by one reader with 2 years of experience in cardiovascular radiol-ogy using semi-automated software (Syngo Argus, Sie-mens) as previously published [18–20]. Briefly, basal and apical reconstructions in diastole and systole were visually identified and manually marked. Subsequently, endocardial borders were semi-automatically traced. Contours were visually checked for correctness and were manually ad-justed to endocardial contours if considered necessary. Papillary muscles were included in the LV cavity. The analysis software provided calculations of end diastolic and end systolic volumes, of the SV (end diastolic minus end systolic volume), and the EF (stroke volume divided by end diastolic volume times 100%). The mean heart rate [in beats per minute (bpm)] during the CT scan was obtained from the recorded ECG data, and CO was calculated as the product of SV and heart rate.
Calculations of the CNR in the proximal right coronary artery (RCA) and the left main artery (LMA) were per-formed as previously published [21,22] and comprised the following steps: first, calculation of the vessel contrast as the difference in the mean attenuation (in Hounsfield units) between the contrast-enhanced vessel lumen and the mean attenuation in the adjacent perivascular tissue. Attenuations were measured in a ROI in the proximal segment of the RCA and in the LMA, and were defined as large as pos-sible, with careful avoidance of calcifications, plaques, and stenoses. Second, determination of image noise as the standard deviation of the attenuation value in a ROI placed in the ascending aorta. Third, calculation of the CNR as the quotient of the measurement values from steps 1 and 2. An example for ROI positions in the LMA, in adjacent peri-vascular tissue, and in the ascending aorta is given in Fig.1.
Statistical analysis
Statistical analysis was performed with commercially avail-able statistical software (SPSS 12.0.1 for Windows, SPSS, Chicago, Ill., USA). Quantitative variables were expressed as mean±standard deviation, and categorical variables as frequencies or percentages. The Wilcoxon two-sample test was used for comparing the EF, SV, heart rate, and CO in the group of patients with β-blockers and the group withoutβ-blockers and to compare the CNR calculations between the LMA and RCA. Pearson correlation analysis was performed to compare each functional hemodynamic parameter (i.e., the EF, SV, heart rate, and CO) with the attenuation and the CNR of the LMA and the RCA. A P value of <0.05 was considered to indicate a statistically significant difference.
Results
CT was successfully performed on all patients without complications. The CT protocol was well tolerated by all patients, and all were able to hold their breath during data acquisition (mean 11.3±0.4 s, range 9.5–12.1 s).
Hemodynamic parameters and coronary opacification Mean EF during scanning was 61.6%±12.4% (range 32– 83%) with 52 patients (87%) having a normal EF (>50%) and eight patients (13%) having a reduced EF (below 50%).
The mean SV during scanning was 63.2±15.6 ml (range 26.4–100.4 ml). All patients had a sinus rhythm during scanning with an average heart rate of 62.5±11.8 bpm (range 45–93 bpm). The mean CO during scanning was 3.88±1.06 l/min (range 1.72–7.28 l/min). There was no significant difference between the group of patients with β-blockers and the group withoutβ-blockers with regard to the EF, SV, heart rate and CO.
Fig. 1 Axial 64-slice coronary CT angiography section illustrating placement of the ROIs in the ascending aorta, the left main artery, and the adjacent perivascular soft tissue. The ROIs were defined as large as possible, while partial volume effects and the inclusion of calcifications, plaques, and stenoses were avoided
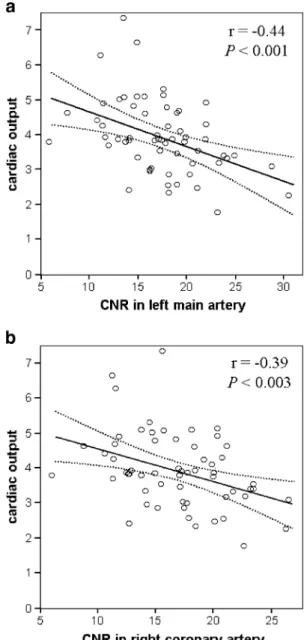
Fig. 2 a Linear regression plot of CNR calculations in the left main artery in the 60 patients (x-axis) against the CO during CT scan (y-axis). Dotted lines represent 95% confidence limits. Linear cor-relation indicates significant negative dependency between CNR in the left main artery and CO (Pearson correlation; r=−0.44, P<0.001). b Linear regression plot of CNR calculations in the right coronary artery in the 60 patients (x-axis) against CO during CT scan (y-axis). Dotted lines represent 95% confidence limits. Linear correlation indicates significant negative dependency between CNR in the right coronary artery and CO (Pearson correlation; r=−0.39, P<0.003)
Mean attenuation of the LMA was 341±71 HU, and that of the RCA was 322±73 HU. Mean attenuation of the perivascular tissue adjacent to the LMA was−129±24 HU and was−133±26 HU adjacent to the RCA. The standard deviation of the attenuation in the ascending aorta was 27.8±6.9 HU (range 18.5–56.7 HU). The calculated CNR in the LMA was 17.8±4.6 (range 6.2–30.9) and in the RCA was 17.2±4.4 (range 6.3–26.8), with no significant difference between the vessels (P=0.06).
No significant correlation was found between EF and attenuation in the LMA (r=−0.10) and RCA (r=−0.10) or between EF and CNR in the LMA (r=−0.14) and RCA (r=−0.20). Similarly, there was no correlation between mean heart rate and attenuation in the LMA (r=−0.23) and RCA (r=−0.22) or with CNR in the LMA (r=−0.20) and RCA (r=−0.14).
A significant negative correlation was found between SV and attenuation in the LMA (r=−0.34, P<0.01) and RCA (r=−0.26, P<0.05) and between SV and CNR in the LMA (r=−0.26, P<0.05) and RCA (r=−0.26, P<0.05). Similarly, a significant negative correlation was found between CO and attenuation in the LMA (r=−0.56, P<0.001) and the RCA (r=−0.42, P<0.002) and between CO and CNR in the LMA (r=−0.44, P<0.001) and RCA (r=−0.39, P<0.003) (Fig.2).
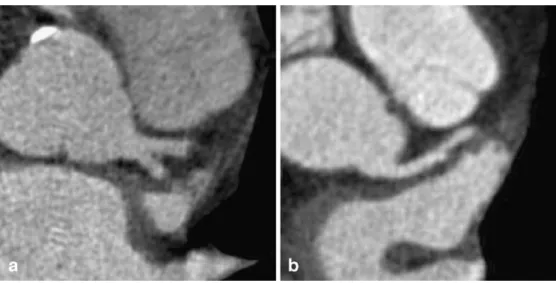
Figure 3shows examples of coronary artery opacifica-tion in two patients with high and low CO.
Discussion
Congestive heart failure is usually associated with low CO but may also occur in a number of so-called high output states, when the CO is normal or greater than normal. A high CO state may occur in various conditions such as pregnancy, muscular exercise, hypoxia and anemia, hyper-thyroidism, systemic arterio-venous fistula or multiple small arteriovenous shunts as in Paget’s bone disease, some
forms of severe hepatic or renal disorders, and, acutely, in septic shock [23]. CO depends on the interactions of intrinsic myocardial contractility with the prevailing con-ditions of myocardial loading. Although an interaction between tissue perfusion rate and contrast-medium en-hancement with CT has been assumed, no controlled anal-ysis of the constituting parameters with regard to coronary artery attenuation has been reported. In this 64-slice CT study we found a significant effect of hemodynamic status on coronary artery opacification, as an increase in CO was paralleled by a decrease in attenuation and CNR in the epicardial coronary arteries.
Hemodynamic parameters and coronary opacification Bae et al. [14] investigated the effect of a reduced CO on aortic enhancement in a porcine model and could dem-onstrate that a progressive decrease in CO produced a substantial increase in the magnitude of peak aortic en-hancement. The results of this experimental study have been substantiated in a clinical report on patients with a reduced CO due to hypovolemic shock and systemic hypotension, where CT showed an unusually dense opacification of ar-teries, bowel walls, and kidneys [15]. Fleischmann et al. [24] reported in patients with abdominal aortic aneurysms a correlation between the enhancement in the abdominal aorta and the contrast agent transit time, indicating an increase in vessel enhancement with lower CO. Together, these studies corroborate the hypothesis that lower CO is associated with greater arterial enhancement.
Generally, attenuation of vessels depends on the intra-luminal concentration of contrast material, i.e., the number of contrast material molecules in a given vessel volume. The coronary artery volume in which the molecules are dissolved depends on LV hemodynamic parameters. Be-cause EF is defined as the percent of blood that is ejected from the LV into the aorta with each heart beat, the
Fig. 3 a Axial image in a 68-year-old male patient (BMI 25.4 kg/m2) with an EF of 68%, heart rate of 68 bpm, SV of 85.6 ml, and CO of 5.8 l/min during CT. The left main artery showed an attenuation of 302 HU and a CNR of 13.2. The decreased attenuation of the coronary artery with increasing SV and CO can be qualitatively appreciated. b Axial image in a 56-year-old male patient (BMI 24.2 kg/m2) with an EF of 58%, heart rate of 58 bpm, SV of 67.4 ml, and CO of 3.9 l/min during CT. The left main artery showed an attenuation of 355 HU and a CNR of 17.4
parameter is independent of the absolute volume or number of molecules. For example, two patients with divergent SV can have an identical EF. It seems, therefore, reasonable that, in our study, the relative parameter, EF, showed no influence but that the absolute parameters, SV and CO, had a substantial effect on coronary artery opacification. The negative correlation between the hemodynamic status and vessel opacification is explained by a prolonged circulation time and the lack of contrast material dilution in coronary arteries with decreased CO.
Becker and co-workers [16] considered vessel attenua-tion of 250–300 HU to be optimal for coronary CT angiography, because higher vessel attenuation would possibly obscure coronary vessel wall calcification and thus would lead to a decline in diagnostic accuracy. In an attempt to determine optimal contrast agent protocols with different iodine concentrations with 4-detector row CT angiography, this group found no significant difference in coronary attenuation between a group of patients with low concentration injected at high flow rate and a group of patients with high concentration injected at low flow rate [16]. Cademartiri et al. [11] compared the effect of different contrast material concentrations on coronary attenuation using 16-detector row CT and found a significant dif-ference between a group of patients receiving iodine con-centrations of 300 mg/ml and a group receiving 400 mg/ml, both concentrations injected at the same flow rate. On the other hand, no significant difference in coronary opacifi-cation was found for the groups receiving 320 mg/ml and 350 mg /ml iodine concentration. It is possible that the actual hemodynamic status of the patients in both studies [11,16], which was not taken into account, had interfered with the attenuation measurements and might have been a confounding variable for the results.
Limitations
The LV functional parameters used for our analyses were assessed with CT, which is not considered the gold
standard method. On the other hand, correlation studies of different CT scanner generations with ventriculography [19], echocardiography [25], and magnetic resonance imaging [18,20] have shown high concordance between the methods, indicating CT to be a reliable means for quantifying those parameters. Furthermore, quantifying LV function and coronary attenuation using the same CT examination enabled us to have the best approximation to the actual cardiac status of the patient, a fact that would not have been the case had we taken data from other modalities performed at different time-points.
Coronary attenuation and CNR were evaluated in only the proximal right and left coronary arteries. Distal seg-ments were not evaluated, as the small diameters of distal segments do not allow placement of a ROI without in-cluding parts of the vessel wall and adjacent tissue, thus causing partial-volume effects.
Conclusions
We conclude from our findings that coronary artery opa-cification with 64-slice CT depends on the actual cardiac hemodynamic status of the patient. Reduction of SV, and, particularly, of the CO is associated with an increase in coronary artery opacification with 64-slice CT angiogra-phy. Knowledge of this effect can be helpful in developing optimal scanning strategies in patients with alterations of cardiac function, since the CO and SV could be non-invasively determined with a test bolus technique [26] immediately prior to coronary CT angiography. An adap-tation of the contrast material regimen to the actual pa-tient’s hemodynamic condition, especially in cases of high CO, may be of potential benefit and thus deserves further evaluation.
Acknowledgment This research was supported by the National Center of Competence in Research, Computer Aided and Image Guided Medical Interventions (NCCR CO-ME) of the Swiss National Science Foundation.
References
1. Leschka S et al (2005) Accuracy of MSCT coronary angiography with 64-slice technology: first experience. Eur Heart J 26:1482–1487
2. Raff GL, Gallagher MJ, O’Neill WW, Goldstein JA (2005) Diagnostic accuracy of noninvasive coronary an-giography using 64-slice spiral computed tomography. J Am Coll Cardiol 46:552–557
3. Flohr T, Stierstorfer K, Raupach R, Ulzheimer S, Bruder H (2004) Performance evaluation of a 64-slice CT system with z-flying focal spot. Rofo Fortschr Geb Rontgenstr Neuen BildgebVerfahr 176:1803–1810
4. Hoffmann MH et al (2005) Noninvasive coronary angiography with 16-detector row CT: effect of heart rate. Radiology 234:86–97
5. Zhang SZ, Hu XH, Zhang QW, Huang WX (2005) Evaluation of computed tomography coronary angi-ography in patients with a high heart rate using 16-slice spiral computed tomography with 0.37-s gantry rotation time. Eur Radiol 15:1105–1109
6. Hamoir XL et al (2005) Coronary arteries: assessment of image quality and optimal reconstruction window in retrospective ECG-gated multislice CT at 375-ms gantry rotation time. Eur Radiol 15:296–304
7. Nieman K et al (2002) Non-invasive coronary angiography with multislice spiral computed tomography: impact of heart rate. Heart 88:470–474
8. Stanford W, Burns TL, Thompson BH, Witt JD, Lauer RM, Mahoney LT (2004) Influence of body size and section level on calcium phantom measurements at coronary artery calcium CT scanning. Radiology 230:198–205
9. Choi HS et al (2004) Pitfalls, artifacts, and remedies in multi- detector row CT coronary angiography. Radio-graphics 24:787–800
10. Kopp AF et al (2001) Coronary arteries: retrospectively ECG-gated multi-detector row CT angiography with selective optimization of the image reconstruction window. Radiology 221:683–688
11. Cademartiri F et al (2005) Intravenous contrast material administration at helical 16-detector row CT coronary angiography: effect of iodine concentration on vascular attenuation. Radiology 236:661–665
12. Cademartiri F et al (2004) Intravenous contrast material administration at 16-detector row helical CT coronary angiography: test bolus versus bolus-tracking technique. Radiology 233:817–823
13. Cademartiri F, van der Lugt A, Luccichenti G, Pavone P, Krestin GP (2002) Parameters affecting bolus geometry in CTA: a review. J Comput Assist Tomogr 26:598–607
14. Bae KT, Heiken JP, Brink JA (1998) Aortic and hepatic contrast medium enhancement at CT. Part II. Effect of reduced cardiac output in a porcine model. Radiology 207:657–662 15. Sivit CJ, Taylor GA, Bulas DI, Kushner
DC, Potter BM, Eichelberger MR (1992) Posttraumatic shock in children: CT findings associated with
hemodynamic instability. Radiology 182:723–726
16. Becker CR et al (2003) Optimal contrast application for cardiac 4-de-tector-row computed tomography. Invest Radiol 38:690–694
17. Flohr T, Ohnesorge B (2001) Heart rate adaptive optimization of spatial and temporal resolution for electrocar-diogram-gated multislice spiral CT of the heart. J Comput Assist Tomogr 25:907–923
18. Juergens KU et al (2004) Multi-detector row CT of left ventricular function with dedicated analysis soft-ware versus MR imaging: initial experience. Radiology 230:403–410 19. Boehm T et al (2004)
Time-effective-ness, observer-dependence, and accu-racy of measurements of left ventricular ejection fraction using 4-channel MDCT. Rofo Fortschr Geb Rontgenstr Neuen BildgebVerfahr 176:529–537 20. Juergens KU, Fischbach R (2005) Left
ventricular function studied with MDCT. Eur Radiol DOI 10.1007/ s00330-005-2888-5
21. Lembcke A et al (2004) Image quality of noninvasive coronary angiography using multislice spiral computed tomography and electron-beam computed tomogra-phy: intraindividual comparison in an animal model. Invest Radiol 39:357–364 22. Achenbach S et al (2003) Comparison of image quality in contrast-enhanced coronary-artery visualization by electron beam tomography and retro-spectively electrocardiogram-gated multislice spiral computed tomography. Invest Radiol 38:119–128
23. Anand IS, Florea VG (2001) High output cardiac failure. Curr Treat Options Cardiovasc Med 3:151–159 24. Fleischmann D, Rubin GD, Bankier
AA, Hittmair K (2000) Improved uniformity of aortic enhancement with customized contrast medium injection protocols at CT angiography. Radiology 214:363–371 25. Salm LP et al (2005) Global and
regional left ventricular function as-sessment with 16-detector row CT: Comparison with echocardiogra-phy and cardiovascular magnetic reso-nance. Eur J Echocardiogr (in press) 26. Mahnken AH et al (2003) Measurement
of cardiac output from a test-bolus in-jection in multislice computed tomog-raphy. Eur Radiol 13:2498–2504