HAL Id: hal-01310581
https://hal.archives-ouvertes.fr/hal-01310581
Submitted on 10 Nov 2016
HAL is a multi-disciplinary open access
archive for the deposit and dissemination of
sci-entific research documents, whether they are
pub-lished or not. The documents may come from
teaching and research institutions in France or
abroad, or from public or private research centers.
L’archive ouverte pluridisciplinaire HAL, est
destinée au dépôt et à la diffusion de documents
scientifiques de niveau recherche, publiés ou non,
émanant des établissements d’enseignement et de
recherche français ou étrangers, des laboratoires
publics ou privés.
Computerized advice on drug dosage to improve
prescribing practice
Florence Gillaizeau, Ellis Chan, Ludovic Trinquart, Isabelle Colombet, Rt
Walton, Myriam Rège-Walther, Bernard Burnand, Pierre Durieux
To cite this version:
Florence Gillaizeau, Ellis Chan, Ludovic Trinquart, Isabelle Colombet, Rt Walton, et al..
Computer-ized advice on drug dosage to improve prescribing practice. The Cochrane Collaboration. John Wiley
& Sons, Ltd, 2013. �hal-01310581�
Computerized advice on drug dosage to improve prescribing
practice (Review)
Gillaizeau F, Chan E, Trinquart L, Colombet I, Walton RT, Rège-Walther M, Burnand B,
Durieux P
This is a reprint of a Cochrane review, prepared and maintained by The Cochrane Collaboration and published in The Cochrane Library 2013, Issue 11
http://www.thecochranelibrary.com
Computerized advice on drug dosage to improve prescribing practice (Review) Copyright © 2013 The Cochrane Collaboration. Published by John Wiley & Sons, Ltd.
T A B L E O F C O N T E N T S 1 HEADER . . . . 1 ABSTRACT . . . . 2 PLAIN LANGUAGE SUMMARY . . . .
4 SUMMARY OF FINDINGS FOR THE MAIN COMPARISON . . . .
7 BACKGROUND . . . . 7 OBJECTIVES . . . . 8 METHODS . . . . 12 RESULTS . . . . Figure 1. . . 13 Figure 2. . . 19 Figure 3. . . 20 Figure 4. . . 23 Figure 5. . . 24 Figure 6. . . 24 Figure 7. . . 25 Figure 8. . . 28 Figure 9. . . 28 Figure 10. . . 29 Figure 11. . . 31 Figure 12. . . 31 Figure 13. . . 32 Figure 14. . . 33 Figure 15. . . 34 Figure 16. . . 35 Figure 17. . . 36 Figure 18. . . 37 Figure 19. . . 38 Figure 20. . . 38 Figure 21. . . 40 41 ADDITIONAL SUMMARY OF FINDINGS . . . .
52 DISCUSSION . . . . 53 AUTHORS’ CONCLUSIONS . . . . 53 ACKNOWLEDGEMENTS . . . . 54 REFERENCES . . . . 67 CHARACTERISTICS OF STUDIES . . . . 170 DATA AND ANALYSES . . . .
172 WHAT’S NEW . . . . 172 CONTRIBUTIONS OF AUTHORS . . . . 172 DECLARATIONS OF INTEREST . . . . 173 INDEX TERMS . . . . i Computerized advice on drug dosage to improve prescribing practice (Review)
[Intervention Review]
Computerized advice on drug dosage to improve prescribing
practice
Florence Gillaizeau1, Ellis Chan2, Ludovic Trinquart1, Isabelle Colombet3, RT Walton4, Myriam Rège-Walther5, Bernard Burnand5, Pierre Durieux6
1French Cochrane Center, Hôpital Hôtel-Dieu, Paris, France.2Centre d’Epidémiologie Clinique, Hôpital Hôtel-Dieu, Paris, France. 3Medical Informatics Department, Georges Pompidou European Hospital, Paris Descartes University, INSERM U872 eq20, Paris, France.4Centre for Health Sciences, Barts and the London Medical School, London, UK.5Cochrane Switzerland, Institute of Social and Preventive Medicine, Lausanne University Hospital, Lausanne, Switzerland.6Department of Public Health and Medical Informatics, Georges Pompidou European Hospital, Paris Descartes University, INSERM U872 eq 22, Paris, France
Contact address: Pierre Durieux, Department of Public Health and Medical Informatics, Georges Pompidou European Hospital, Paris Descartes University, INSERM U872 eq 22, 20 rue Leblanc, Paris, 75015, [email protected]@gmail.com.
Editorial group: Cochrane Effective Practice and Organisation of Care Group.
Publication status and date: New search for studies and content updated (no change to conclusions), published in Issue 11, 2013. Review content assessed as up-to-date: 12 December 2012.
Citation: Gillaizeau F, Chan E, Trinquart L, Colombet I, Walton RT, Rège-Walther M, Burnand B, Durieux P. Computerized advice
on drug dosage to improve prescribing practice. Cochrane Database of Systematic Reviews 2013, Issue 11. Art. No.: CD002894. DOI: 10.1002/14651858.CD002894.pub3.
Copyright © 2013 The Cochrane Collaboration. Published by John Wiley & Sons, Ltd.
A B S T R A C T Background
Maintaining therapeutic concentrations of drugs with a narrow therapeutic window is a complex task. Several computer systems have been designed to help doctors determine optimum drug dosage. Signi cant improvements in health care could be achieved if computer advice improved health outcomes and could be implemented in routine practice in a cost-effective fashion. This is an updated version of an earlier Cochrane systematic review, first published in 2001 and updated in 2008.
Objectives
To assess whether computerized advice on drug dosage has beneficial effects on patient outcomes compared with routine care (empiric dosing without computer assistance).
Search methods
The following databases were searched from 1996 to January 2012: EPOC Group Specialized Register, Reference Manager; Cochrane Central Register of Controlled Trials (CENTRAL), MEDLINE, Ovid; EMBASE, Ovid; and CINAHL, EbscoHost. A “top up” search was conducted for the period January 2012 to January 2013; these results were screened by the authors and potentially relevant studies are listed in Studies Awaiting Classification. The review authors also searched reference lists of relevant studies and related reviews.
Selection criteria
We included randomized controlled trials, non-randomized controlled trials, controlled before-and-after studies and interrupted time series analyses of computerized advice on drug dosage. The participants were healthcare professionals responsible for patient care. The outcomes were any objectively measured change in the health of patients resulting from computerized advice (such as therapeutic drug control, clinical improvement, adverse reactions).
1 Computerized advice on drug dosage to improve prescribing practice (Review)
Data collection and analysis
Two review authors independently extracted data and assessed study quality. We grouped the results from the included studies by drug used and the effect aimed at for aminoglycoside antibiotics, amitriptyline, anaesthetics, insulin, anticoagulants, ovarian stimulation, anti-rejection drugs and theophylline. We combined the effect sizes to give an overall effect for each subgroup of studies, using a random-effects model. We further grouped studies by type of outcome when appropriate (i.e. no evidence of heterogeneity).
Main results
Forty-six comparisons (from 42 trials) were included (as compared with 26 comparisons in the last update) including a wide range of drugs in inpatient and outpatient settings. All were randomized controlled trials except two studies. Interventions usually targeted doctors, although some studies attempted to influence prescriptions by pharmacists and nurses. Drugs evaluated were anticoagulants, insulin, aminoglycoside antibiotics, theophylline, anti-rejection drugs, anaesthetic agents, antidepressants and gonadotropins. Although all studies used reliable outcome measures, their quality was generally low.
This update found similar results to the previous update and managed to identify specific therapeutic areas where the computerized advice on drug dosage was beneficial compared with routine care:
1. it increased target peak serum concentrations (standardized mean difference (SMD) 0.79, 95% CI 0.46 to 1.13) and the proportion of people with plasma drug concentrations within the therapeutic range after two days (pooled risk ratio (RR) 4.44, 95% CI 1.94 to 10.13) for aminoglycoside antibiotics;
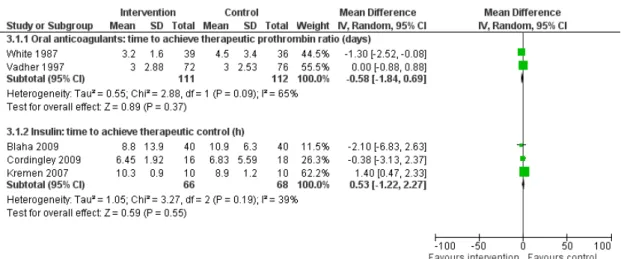
2. it led to a physiological parameter more often within the desired range for oral anticoagulants (SMD for percentage of time spent in target international normalized ratio +0.19, 95% CI 0.06 to 0.33) and insulin (SMD for percentage of time in target glucose range: +1.27, 95% CI 0.56 to 1.98);
3. it decreased the time to achieve stabilization for oral anticoagulants (SMD -0.56, 95% CI -1.07 to -0.04);
4. it decreased the thromboembolism events (rate ratio 0.68, 95% CI 0.49 to 0.94) and tended to decrease bleeding events for anticoagulants although the difference was not significant (rate ratio 0.81, 95% CI 0.60 to 1.08). It tended to decrease unwanted effects for aminoglycoside antibiotics (nephrotoxicity: RR 0.67, 95% CI 0.42 to 1.06) and anti-rejection drugs (cytomegalovirus infections: RR 0.90, 95% CI 0.58 to 1.40);
5. it tended to reduce the length of time spent in the hospital although the difference was not significant (SMD -0.15, 95% CI -0.33 to 0.02) and to achieve comparable or better cost-effectiveness ratios than usual care;
6. there was no evidence of differences in mortality or other clinical adverse events for insulin (hypoglycaemia), anaesthetic agents, anti-rejection drugs and antidepressants.
For all outcomes, statistical heterogeneity quantified by I2statistics was moderate to high.
Authors’ conclusions
This review update suggests that computerized advice for drug dosage has some benefits: it increases the serum concentrations for aminoglycoside antibiotics and improves the proportion of people for which the plasma drug is within the therapeutic range for aminoglycoside antibiotics.
It leads to a physiological parameter more often within the desired range for oral anticoagulants and insulin. It decreases the time to achieve stabilization for oral anticoagulants. It tends to decrease unwanted effects for aminoglycoside antibiotics and anti-rejection drugs, and it significantly decreases thromboembolism events for anticoagulants. It tends to reduce the length of hospital stay compared with routine care while comparable or better cost-effectiveness ratios were achieved.
However, there was no evidence that decision support had an effect on mortality or other clinical adverse events for insulin (hypogly-caemia), anaesthetic agents, anti-rejection drugs and antidepressants. In addition, there was no evidence to suggest that some decision support technical features (such as its integration into a computer physician order entry system) or aspects of organization of care (such as the setting) could optimize the effect of computerized advice.
Taking into account the high risk of bias of, and high heterogeneity between, studies, these results must be interpreted with caution.
P L A I N L A N G U A G E S U M M A R Y
2 Computerized advice on drug dosage to improve prescribing practice (Review)
Computerized advice on drug dosage to improve prescribing practice Background
Physicians and other healthcare professionals often prescribe drugs that will only work at certain concentrations. These drugs are said to have a narrow therapeutic window. This means that if the concentration of the drug is too high or too low, they may cause serious side effects or not provide the benefits they should. For example, blood thinners (anticoagulants) are prescribed to thin the blood to prevent clots. If the concentration is too high, people may experience excessive bleeding and even death. In contrast, if the concentration is too low, a clot could form and cause a stroke. For these types of drugs, it is important that the correct amount of the drug be prescribed. Calculating and prescribing the correct amount can be complicated and time-consuming for healthcare professionals. Sometimes determining the correct dose can take a long time since healthcare professionals may not want to prescribe high doses of the drugs initially because they make mistakes in calculations. Several computer systems have been designed to do these calculations and assist healthcare professionals in prescribing these types of drugs.
Study characteristics
We sought clinical trial evidence from scientific databases to evaluate the effectiveness of these computer systems. The evidence is current to January 2012. We found data from 42 trials (40 randomized controlled trials (trials that allocate people at random to receive one of a number of drugs or procedures) and two non-randomized controlled trials).
Key results
Computerized advice for drug dosage can benefit people taking certain drugs compared with empiric dosing (where a dose is chosen based on a doctor’s observations and experience) without computer assistance. When using the computer system, healthcare professionals prescribed appropriately higher doses of the drugs initially for aminoglycoside antibiotics and the correct drug dose was reached more quickly for oral anticoagulants. It significantly decreased thromboembolism (blood clotting) events for anticoagulants and tended to reduce unwanted effects for aminoglycoside antibiotics and anti-rejection drugs (although not an important difference). It tended to reduce the length of hospital stay compared with routine care with comparable or better cost-effectiveness. There was no evidence of effects on death or clinical side events for insulin (low blood sugar (hypoglycaemia)), anaesthetic agents, anti-rejection drugs (drugs taken to prevent rejection of a transplanted organ) and antidepressants.
Quality of evidence
The quality of the studies was low so these results must be interpreted with caution.
3 Computerized advice on drug dosage to improve prescribing practice (Review)
S U M M A R Y O F F I N D I N G S F O R T H E M A I N C O M P A R I S O N [Explanation]
Computerized advice on drug dosage for leading serum concentrations within therapeutic range Patient or population: patients with leading serum concentrations within therapeutic range Settings: outpatient/inpatient
Intervention: computerized advice on drug dosage
Outcomes Illustrative comparative risks* (95% CI) Relative effect (95% CI)
No of participants (studies)
Quality of the evidence (GRADE)
Comments
Assumed risk Corresponding risk Control Computerized advice on
drug dosage Serum concentrations
-aminoglycoside antibi-otics: peak concentra-tion
Follow-up: 2 days
- The mean serum concen-trations - aminoglycoside antibiotics: peak concen-tration in the intervention groups was 0.79 standard deviations higher (0.46 to 1.13 higher) - 372 (4 studies) ⊕⊕ low1,2,3 SMD 0.79 (95% CI 0.46 to 1.13) Serum concentrations -theophylline
- The mean serum
con-centrations - theophylline in the intervention groups was 0.41 standard deviations higher (0.2 lower to 1.02 higher) - 201 (4 studies) ⊕⊕ low3,4,5 SMD 0.41 (95% CI -0.2 to 1.02) Proportion of partici-pants within therapeutic range - aminoglycoside antibiotics: % of partici-pants with peak
concen-Study population RR 4.44 (1.94 to 10.13) 72 (2 studies) ⊕⊕⊕ moderate3,6 -C o m p u te ri z e d a d v ic e o n d ru g d o sa g e to im p ro v e p re sc ri b in g p ra c ti c e (R e v ie w ) C o p y ri g h t © 2 0 1 3 T h e C o c h ra n e C o lla b o ra ti o n . P u b lis h e d b y Jo h n W ile y & S o n s, L td .
trations adequate after 2 days Follow-up: 2 days 135 per 1000 600 per 1000 (262 to 1000) Moderate 151 per 1000 670 per 1000 (293 to 1000) Proportion of partici-pants with toxic drug lev-els - theophylline Study population RR 0.53 (0.25 to 1.13) 109 (2 studies) ⊕⊕⊕ moderate3,7 -273 per 1000 145 per 1000 (68 to 308) Moderate 217 per 1000 115 per 1000 (54 to 245)
*The basis for the assumed risk (e.g. the median control group risk across studies) is provided in footnotes. The corresponding risk (and its 95% confidence interval) is based on the assumed risk in the comparison group and the relative effect of the intervention (and its 95% CI).
CI: confidence interval; RR: risk ratio; SMD: standardized mean difference.
GRADE Working Group grades of evidence
High quality: Further research is very unlikely to change our confidence in the estimate of effect.
Moderate quality: Further research is likely to have an important impact on our confidence in the estimate of effect and may change the estimate. Low quality: Further research is very likely to have an important impact on our confidence in the estimate of effect and is likely to change the estimate. Very low quality: We are very uncertain about the estimate.
1Lack of blinding of participants and personnel in all studies. Incomplete outcome data in three studies. Random sequence generation
and allocation concealment unclear in one study.
2I2= 51%.
3No funnel plot was performed since the validity conditions were not met.
4No blinding of participants and personnel in the two studies. Random sequence generation and allocation concealment unclear in one
study. 5I2= 76% 5 C o m p u te ri z e d a d v ic e o n d ru g d o sa g e to im p ro v e p re sc ri b in g p ra c ti c e (R e v ie w ) C o p y ri g h t © 2 0 1 3 T h e C o c h ra n e C o lla b o ra ti o n . P u b lis h e d b y Jo h n W ile y & S o n s, L td .
6Lack of blinding of participants and personnel, incomplete outcome data in all studies. Participants were not similar at baseline in one
study.
7No blinding of participants and personnel in the two studies. Random sequence generation and allocation concealment unclear in one
study. xxxxxxxxxxxxxxxxxxxxxxxxxxxxxxxxxxxxxxxxxxxxxxxxxxxxxxxxxxxxxxxxxxxxxxxxxxxxxxxxxxxxxxxxxxxxxxxxxxxxxxxxxxxxxxxxxxxxxxxxxxxxxxxxxxxxxxxxxxxxxxxxxxxxxxxxxxxxxxxxxxxxxxxxxxxxxxxxxxx C o m p u te ri z e d a d v ic e o n d ru g d o sa g e to im p ro v e p re sc ri b in g p ra c ti c e (R e v ie w ) C o p y ri g h t © 2 0 1 3 T h e C o c h ra n e C o lla b o ra ti o n . P u b lis h e d b y Jo h n W ile y & S o n s, L td .
B A C K G R O U N D
Medication mistakes still represent 20% of all medical errors al-though many efforts have focused in recent years on reducing the risk of drug errors (Brennan 1991). Maintaining therapeutic con-centrations of drugs is a complex task requiring knowledge of ev-idence-based clinical guidelines, clinical pharmacology and skills in dose calculation. The potential for error is great since many of the drugs commonly used have a narrow ’window’ within which therapeutic benefits can be obtained with a low risk of unwanted effects.
Description of the condition
Monitoring drug therapy to optimize effects and minimize dan-gers can be very time consuming. Practitioners may need access to a large amount of information to make an appropriate dose adjustment in situations such as prevention of deep vein throm-bosis or management of people with renal insufficiency (Durieux 2005). Under these conditions, healthcare professionals make er-rors of judgement because their ability to process information is finite (McDonald 1976a).
For example, in ambulatory settings, general practitioners (GP) re-ported difficulties with drug dosing, especially for children, elderly people and people with renal impairment (Franke 2000). More-over, physicians’ computational abilities are often insufficient to perform calculations for drug dosage (Baldwin 1995). For exam-ple, 82 out of 150 hospital doctors were unable to calculate how many milligrams of lidocaine were in a 10 mL ampoule of 1% solution (Rolfe 1995).
Description of the intervention
Clinical decision support systems (CDSS), either computerized or not, have been proposed to improve clinical practice (Kawamoto 2005). Ideally, decision support, integrated in the electronic med-ical record as the platform, can provide physicians with tools mak-ing it possible to improve practice and patient safety (Bates 2003). An effective decision support system would anticipate needs and deliver information quickly in real time, adapted to the user’s work-flow (Bates 2003).
How the intervention might work
Computers are very good at collecting information and perform-ing repetitive calculations. Moreover, the drugs that cause the most problems have often been in use for many years. The pharmacol-ogy of the drugs is, therefore, well understood and thus computer models can be used to generate advice on dosage. Several types of computer systems have been designed to help doctors in the
task of determining the optimum dosage of drugs. Significant im-provements in health could be achieved if computer advice was shown to be beneficial and was provided by the computers that clinicians now use for their everyday work.
In addition, the logistics by which the advice on drug dosage is delivered to the healthcare professional is critical to its effectiveness and to the transferability of this effectiveness in other settings. Computer physician order entry (CPOE) systems, which allow physicians to enter orders directly into a computer rather than hand writing them, have the potential to incorporate CDSS into daily practice (Kuperman 2003). According to three systematic reviews (Garg 2005;Kawamoto 2005;Nieuwlaat 2011a), CDSSs are more often associated with improvement of practice when the decision aid is automatically prompted, integrated in clinicians’ workflow, and provided at time and location of decision making. This review focuses on advice with a personalized dosage for a specific participant. Two other Cochrane systematic reviews were interested in computer-generated reminders: one evaluated the effects of on-screen computer reminders delivered to clinicians at the point of care (Shojania 2009), and one considered reminders delivered on paper to healthcare professionals (Arditi 2012).
Why it is important to do this review
This is an updated version of two earlier Cochrane systematic re-views (Walton 2001; Durieux 2008).Those earlier reviews pro-vided some evidence to support the use of computer assistance in determining drug dosage but concluded that further clinical trials were necessary to confirm those results.
O B J E C T I V E S
The primary objective of this systematic review was to examine whether computerized advice on drug dosage given to healthcare professionals is beneficial when compared with routine care (em-piric dosing without computer assistance). The secondary objec-tive was to determine whether any technical features of comput-erized systems or organizational aspects concerning their imple-mentation influence their effectiveness.
Hypothesis tested
In previous versions of this review, we tested the benefit in terms of effects on process of care (healthcare professional oriented) and on outcome of care (patient oriented). The effect on process of care was any change in drug dose as a process measure. However, there are problems with this approach since a higher dose may, in some circumstances, be beneficial and, in others, be disadvan-tageous. Thus, in this review we have removed this outcome and 7 Computerized advice on drug dosage to improve prescribing practice (Review)
only reported effects on dosage where we judged the changes to be meaningful. We examined six hypotheses on patient-oriented outcomes (most of them measuring surrogate outcomes).
Effect on outcome of care (patient-oriented outcomes)
1. Decisions on drug dosage based on computer advice lead more often to drug levels within the therapeutic range.
2. Decisions on drug dosage based on computer advice lead more often to a physiological parameter being maintained within the desired range (e.g. blood pressure or prothrombin (PT) time). 3. Decisions on drug dosage based on computer advice lead to more rapid therapeutic control, assessed by a physiological parameter.
4. Decisions on drug dosage based on computer advice lead to greater clinical effectiveness, assessed by clinical improvement.
5. Decisions on drug dosage based on computer advice lead to fewer unwanted effects than conventional dose adjustment.
6. Computer advice reduces the cost of health care or the use of resources (e.g. length of hospital stay).
Unlike the previous update of this review, we decided to analyze the results individually for each drug because of a high clinical and statistical heterogeneity between drugs (each drug has its specific outcomes).
Other hypotheses address our secondary objectives and reflect a series of subgroup analyses.
Effect of decision support logistics and organization of care
1. Computer advice given in real time is more effective than that given by delayed feedback.
2. Computer advice integrated in CPOE system is more effective than other systems.
3. System-initiated computer advice is more effective than user-initiated computer advice.
4. Direct intervention (system delivers advice directly to the provider) is more effective than indirect intervention (advice is made available to the provider by the intermediate of a third party actor, i.e. system is not directly used by the provider).
5. The impact of computer advice depends on the setting where it is implemented (inpatient versus outpatient care).
6. Computer advice given as a recommendation is more effective than a calculated dose proposed without possibility of change and which does not take into account the healthcare professional’s experience).
M E T H O D S
Criteria for considering studies for this review
Types of studies
We considered for inclusion all types of study designs that met Effective Practice and Organization of Care Group (EPOC) in-clusion criteria:
• Randomized controlled trials (RCTs) where the unit of randomization was:
1. the participant or
2. the cluster: healthcare professionals (doctors, nurses or pharmacists) or groups of professionals (practices or hospitals);
• Non-randomized controlled trials (NRCTs); • Controlled before-and-after (CBA) studies with: 1. the same pre- and postintervention periods for study and control sites;
2. comparable study and control sites with respect to level of care, setting of care and baseline characteristics;
3. two intervention sites and two control sites; • Interrupted time series (ITS) studies with:
1. a clearly defined point in time when the intervention occurred;
2. at least three data points before and three after the intervention.
See the EPOC checklist for definition of designs (EPOC 2012).
Types of participants
The participants were healthcare professionals with responsibility for patient care.
Types of interventions
We sought to identify all comparative studies comparing comput-erized advice on drug dosage given to routine care (empiric dosing without computer assistance). We defined computerized advice on drug dosage as a recommendation provided to the healthcare professional on the drug dosage needed for a specific participant and a specific drug and calculated by a computer.
Computer program
The computer program was a software model or an application integrated into a laptop, a smartphone, a tablet computer, the CPOE, or a website (online calculator). We did not consider in-terventions where the recommended drug dose was not calculated by a computer, for example an equation or a nomogram not im-plemented in a computer device.
8 Computerized advice on drug dosage to improve prescribing practice (Review)
Nature of advice
The advice included a dosage personalized for a specific partici-pant. We did not include studies reporting a popup with general advice on the dosage required for a specific condition (most fre-quently dose of medication, dose interval, maximum total daily dose).
Content of recommendation and calculation of drug dose
The recommendation could be evidence-based, a clinical practice guideline developed by expert bodies (government, professional) or local clinicians, or population pharmacokinetic/pharmacody-namic models. The participant’s drug dose was computed using an equation including participant’s characteristics (participant’s age, weight, previous drug levels…). Alternatively, a more complex mathematical model was used, which was generally a pharmacoki-netic model of the relationship between administered doses of the drug and observed concentrations in the participant’s body.
Advice delivery and timing
The computerized advice could be delivered to clinicians when they are writing their prescription (point of care delivery) or it could be delivered at a later time. In addition, the computerized advice could be delivered to another healthcare professional (e.g. a pharmacist or a pharmacokinetic unit) and passed to the clin-ician. Unlike the review on the effect of point-of-care computer reminders on physician behaviour (Shojania 2009), we included systems that were not encountered during routine performance of the activities of interest, for example a dedicated computer used only for performing dose calculation for anticoagulants. These systems require clinicians to depart from their usual workflow in order to avail themselves of the reminder or decision support.
Control of the healthcare professional
We included studies where advice was given as a recommendation so that the healthcare professional was able to accept or refuse it. We did not include studies reporting non-specific advice given to a healthcare professional to adjust drug dosage or when the healthcare professional was not in charge of every adjustment of the drug, for example studies reporting the direct administration of a drug to the participant by means of a computer supervised device (closed-loop system) or through self dosing devices (one Cochrane review addresses the evaluation of anticoagulant self management (Garcia-Alamino 2010)).
Starter
The advice could be system-initiated (advice appears without user intervention) or user-initiated (the computer program must be started by the user to obtain an advice).
Control group
The control group included empiric dosing without computer assistance, in general routine care.
Types of outcome measures
All outcome measures included were patient-oriented outcomes. 1. Proportion of participants or time for which the plasma drug concentrations was within the therapeutic range.
2. Proportion of participants or time for which the studied physiological parameter was maintained within the target range.
3. Time to achieve therapeutic control.
4. Proportion of participants with toxic drug levels. 5. Proportion of participants with clinical improvement. 6. Proportion of participants with adverse effects of drug therapy.
7. Proportion of deaths. 8. Length of hospital stay. 9. Total cost per participant.
We excluded the outcomes for which reporting was incomplete (e.g. no numerical values reported, no measure of dispersion) and excluded studies whose only relevant outcomes were death or ad-verse effects requiring monitoring and which did not explicitly report such outcomes as primary.
For serum concentrations, we also considered peak, trough and steady-state concentrations. The measurement of drug levels in the blood, called therapeutic drug monitoring (TDM), is required for some drugs to ensure that the participants maintain the con-centration of drug within the established therapeutic range (drug effective without toxicity). Blood for peak level is collected at the drug’s highest concentration within the dosing period. Trough levels (occasionally called residual levels) are measured just prior to administration of the next dose, and are the lowest concentra-tion in the dosing interval. Most therapeutic drugs have a narrow trough to peak difference (therapeutic range), and, therefore, only trough levels are needed to detect blood levels that are too low or too high. Peak levels are needed for some drugs, especially amino-glycoside antibiotics: a concentration below the therapeutic range will not resolve the bacterial infection so high peak concentrations are necessary for optimal efficacy; however, too high a level can cause damage such as nephrotoxicity so it is important that the trough concentration be allowed to fall in order to avoid accu-mulation. The steady-state concentration is defined as the point at which the amount of drug administered (drug intake) and the amount of drug excreted (drug elimination) reach an equilibrium. The goal of TDM is to optimize the drug dose so that the partic-ipant’s drug concentrations remain within the therapeutic range.
Search methods for identification of studies
Updates to Cochrane systematic reviews usually entail executing previously used search strategies for the update period or, in other 9 Computerized advice on drug dosage to improve prescribing practice (Review)
words, from the date of the last search, to present. In some cases, however, search strategies must be assessed and revised in order to optimize the identification of evidence. When this occurs, it is advisable to search retrospectively--that is, to re-search previously searched time periods, in order to discover whether or not studies have been missed. This update represents a review where search strategies have been revised significantly (by M. Fiander, Infor-mation Scientist, and Trials Search Co-ordinator for the EPOC Group) and where, consequently, searching has been conducted not only from the date of last search in 2006, but retrospectively from 1996 to January 2012, where 1996 to 2006 represents a pre-viously searched time period.
The revised search strategies had an impact on the review since the strategies identified a number of studies which should have been found during previous searches:Ageno 2000,Claes 2005,Claes 2006,Mitra 2005,Plank 2006,Poller 2002,Poller 2003. For the initial review, the databases listed below were searched from database start date to 1996; for the first update, the search period was 1996 to 2006; for this, the second, update, searches were run from 1996 to January 2012. Two methodological search filters were used to limit retrieval to appropriate study designs: the Cochrane Highly Sensitive Search Strategy (sensitivity- and pre-cision-maximizing version, 2008 revision) to identify randomized trials; and an EPOC methodology filter (Appendix 1) to identify non-RCT designs. Related reviews were identified by searching the Database of Abstracts of Reviews (DARE). All databases were searched from their start date forward; start date represents the date the database began to index journals. Note that database start dates vary by database (Medline, EMBASE, etc.) and provider (OVID, Ebsco, etc.). Start dates are provided in the list of databases, below. A top-up search was conducted for the period January 2012 to January 2013; the authors screened the titles and abstracts of these results and added potentially relevant studies toStudies awaiting classification.
The original MEDLINE search strategies used until 2006 are in Appendix 2. The revised search strategies used for this update are in Appendices 2 to 6 as follows: MEDLINE, Appendix 3; EMBASE, Appendix 4; CINAHL, Appendix 5; Cochrane Central Register of Controlled Trials, Appendix 6; EPOC Specialised Register, Ap-pendix 7.
Databases searched
• Cochrane Central Register of Controlled Trials (CENTRAL), Issue 12, 2012, OvidSP EBM Reviews
• MEDLINE, including In-Process & Other Non-Indexed Citations, OvidSP, 1946-January 2013
• EMBASE, 1947 to January 2013, OvidSP
• CINAHL (Cumulative Index to Nursing and Allied Health Literature), 1980-January 2013, EbscoHost
• EPOC Group, Specialised Register
Searching other resources
The review authors handsearched reference lists from primary ar-ticles and relevant reviews identified, and conference proceedings. We contacted experts in the field.
We also:
• Screened (hand searched) the following journals: ◦ Therapeutic Drug Monitoring journal (1979 to December 2006).
◦ Journal of the American Medical Informatics Association (January 1996 to March 2007).
• Reviewed reference lists of all included studies, relevant systematic reviews and primary studies.
• Contacted authors of relevant studies/ reviews to clarify reported published information and to seek unpublished results/ data.
• Contacted researchers with expertise relevant to the review topic/ EPOC interventions.
Data collection and analysis
Selection of studies
We merged the search results using Reference Manager 5 (RevMan 2011), and removed duplicate records. We examined all titles and abstracts.
Two review authors (FG, PD) examined independently each title and abstract to exclude obviously irrelevant reports (mainly ther-apeutic trials and genetic research). We retrieved full texts, which were independently screened. We then randomly allocated each selected study to two pairs of review authors (IC and FG, MR and PD) who reviewed it and extracted data independently. We resolved disagreements by group discussion with the four review authors. We reported reasons for excluding full papers.
Data extraction and management
We reviewed the data abstraction form for the previous update of the review. We adapted a checklist to the specific subject to extract the decision support technical features by which the advice on drug dosage was delivered to the healthcare professional.
• Was the computerized advice delivered in real time (at the moment of the practitioners decision making) or by delayed feedback?
• Was the computerized advice integrated in a CPOE? • Was the computerized advice user-initiated or system-initiated?
• Was the intervention direct or indirect (a third party brought advice from computer and transfers it to user)? An additional feature was added:
• Was the information of the calculated dose given as a recommendation to the healthcare professional who prescribed
10 Computerized advice on drug dosage to improve prescribing practice (Review)
through the computer or through another healthcare professional (the healthcare professional had the possibility to accept or refuse the advice)?
The review authors abstracted the data independently and resolved disagreements by discussion. A statistician (FG) reviewed all data and contacted authors of included studies for additional informa-tion.
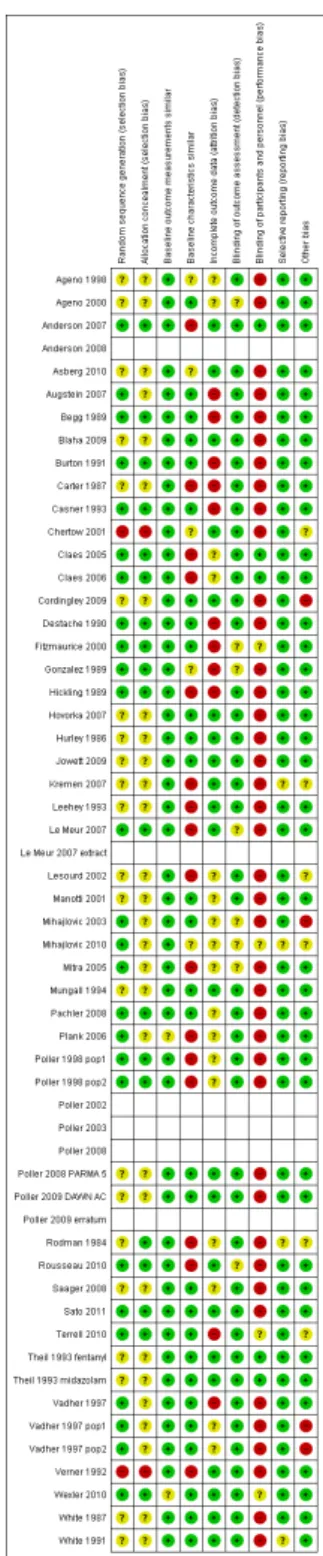
Assessment of risk of bias in included studies
We assessed the risk of bias of the studies using the ’Risk of bias’ criteria described by the EPOC group and extracted data using the EPOC checklist (EPOC 2009;Higgins 2011). We used nine stan-dard criteria for RCTs, NRCTs and CBAs: allocation sequence ad-equately generated; allocation adad-equately concealed; baseline out-come measurements similar; baseline characteristics similar; in-complete outcome data adequately addressed; knowledge of the al-located interventions adequately prevented during the study; study adequately protected against contamination; study free from se-lective outcome reporting; study free from other risks of bias. We scored studies using cluster randomization to be adequate on con-cealment of allocation (if the sequence generation was adequate) and on protection against contamination. Baseline characteristics were considered for similarity at the unit of analysis level. Risk of bias on baseline outcome measurements was only evaluated for insulin. For the other drugs, the baseline measurement was not relevant since there was no drug intake before the intervention. Therefore, we considered risk of bias on baseline outcome mea-surements to be ’low risk’ for these drugs.
The risk of bias for ITS studies can be evaluated using seven stan-dard criteria but we found no ITS studies.
We included all the ’Risk of bias’ criteria in the data abstraction form and independently scored criteria as ’yes’ (adequate), ’no’ (inadequate) or ’unclear’. We resolved disagreements by discussion and, where necessary, with a third review author. The risk of bias of included studies is summarized in the text and presented in the ’Risk of bias’ section within theCharacteristics of included studies table.
Two review authors (EC, PD) assessed the quality of evidence for each main outcome - that is the extent of confidence in the estimate of effect across studies (high, moderate, low or very low) - using the GRADE approach (Guyatt 2008).
Measures of treatment effect
For dichotomous variables, we used the risk ratio (RR). When the outcomes were continuous variables, we calculated stan-dardized mean differences (SMD) with 95% confidence intervals (CI). The SMD is a statistical measure of the impact of the inter-vention, which is independent of the units used to measure study outcomes. This measure allows studies of the same intervention using different outcomes to be compared. For example, measure-ment of drug concentrations in blood in different studies may use
different assays in several laboratories and results may be reported in different units. The SMD compares differences between ex-perimental and control groups to the standard deviation of the outcome for each study. Hence, a quantitative approximation can be made of the overall effect of decision support on plasma lev-els. Because SMD can be difficult to interpret (as it is reported in units of standard deviation), we also presented mean difference (MD), that is the absolute difference between the mean value in two groups, in relevant cases (when measurements were made on the same scale).
Clinical adverse events were expressed as RRs or rate ratios. In a randomized trial, rate ratios may often be very similar to RRs ob-tained after dichotomizing the participants, since the mean period of follow-up should be similar in all intervention groups. Rate ratios and RRs will differ, however, if an intervention affects the likelihood of some participants experiencing multiple events. The effect sizes were combined to give an overall effect for each subgroup of studies, using a effects model. The random-effects model was chosen because it does not assume that all in-terventions have the same underlying effect.
Unit of analysis issues
Analyses of studies using cluster randomization that do not ac-count for the design effect risk inflating the type 1 error-rate re-sulting in artificially narrow CIs (Ukoumunne 1999). We have reported potential errors and did not attempt to reanalyze data unless standard errors were correctly stated with number of clus-ters allowing the calculation of appropriate CIs.
Dealing with missing data
When the mean and standard deviation were missing, we esti-mated the mean from the median and standard deviation from the interquartile range or range (Hozo 2005). Missing data on outcomes or estimated data are explicitly indicated in the tables and text. We did not attempt to impute or model other missing data.
Assessment of heterogeneity
We explored heterogeneity using tests of heterogeneity and exami-nations of direction, magnitude and variability of effects. The sta-tistical test for heterogeneity (Chi2test) tests the null hypothesis that all studies in a meta-analysis have the same underlying mag-nitude of effects. The I2statistic quantifies the proportion of the variation in point estimates due to among-study differences but is influenced by sample size. An I2statistic greater than 50% may be considered as substantial heterogeneity and I2statistic greater than 75% as considerable heterogeneity (Deeks 2011). High P value for the test of heterogeneity (P value > 0.1) and low I2values do not necessarily indicate low heterogeneity (Guyatt 2011). Thus, we also manually examined the variability in point estimates across studies and the overlap of CIs.
11 Computerized advice on drug dosage to improve prescribing practice (Review)
Assessment of reporting biases
To be meaningful and appropriate, funnel-plot asymmetry tests must be performed when four criteria are met: no significant het-erogeneity (P value for the Chi2test of heterogeneity > 0.10), low I2statistic (< 50%), 10 or more studies with at least one with significant results, and a ratio of the maximal to minimal variance across studies greater than four (Ioannidis 2007). We could not assess publication bias because these conditions were not met.
Data synthesis
We grouped the results from the included studies by drug used and the effect aimed at for aminoglycoside antibiotics, amitriptyline, anaesthetics, insulin, anticoagulants, ovarian stimulation, anti-re-jection drugs and theophylline. We further grouped studies by type of outcome when appropriate (i.e. no evidence of heterogeneity). We constructed Forest plots for the main outcomes without po-tential unit of analysis error for which data were available for more than one comparison.
The doses of drugs administered to participants and the number of dose changes per participant were described but not compared.
Subgroup analysis and investigation of heterogeneity
We considered the following potential sources of heterogeneity to explain variation in the results of the included studies:
• time of delivery of advice (real time/delayed feedback); • location of advice (integrated in CPOE systems/other); • initiation of the computer advice (system-initiated/user-initiated);
• advice given directly to the provider (direct intervention) versus the intermediate of a third party actor (indirect intervention);
• type of hospital (outpatient/inpatient);
• type of advice (recommendation/calculated dose proposed without possibility of change).
Sensitivity analysis
We had planned to perform a sensitivity analysis, excluding high risk of bias studies, but, since most of the identified studies had high risk of bias, we were unable to perform this analysis.
R E S U L T S
Description of studies
See:Characteristics of included studies;Characteristics of excluded studies; Characteristics of ongoing studies.
Results of the search
The initial review identified 15 comparisons (14 articles) (Walton 2001), whereas the previous update of this review identified 26 comparisons (23 articles) that met inclusion criteria (Durieux 2008).
Figure 1shows the study PRISMA flow chart (Moher 2009). We screened 5328 non-duplicate records, of which 64 were identi-fied through other sources than database searches (references from previous versions of this review and published before 1996, ref-erences from bibliography or website of screened articles or sys-tematic reviews). We assessed 199 articles for potential inclusion: 136 articles identified from the new updated search strategy (from January 1996) (including eight from the previous version of the review) and 48 additional relevant articles from handsearches and reference lists of trials and systematic reviews, leading to 176 po-tential ’new’ inclusions as compared with the previous version of the review; and 15 articles from the previous review and published before 1996.
12 Computerized advice on drug dosage to improve prescribing practice (Review)
Figure 1. Study flow diagram.
13 Computerized advice on drug dosage to improve prescribing practice (Review)
Since the search strategy missed studies we will search pre-1996 for the next update of this review.
Included studies
This update identified 20 new trials with 21 comparisons, for a total of 42 trials and 46 comparisons and are included as follows: 25 comparisons (22 trials) from the previous update of this review (Durieux 2008), and 21 comparisons (20 trials) from this update. These 42 trials were reported in 53 references (many reports for some trials). Three articles were separate cost-effectiveness analy-ses:Jowett 2009(main results inPoller 2008 PARMA 5;Poller 2009 DAWN AC),Rousseau 2010 (main results in Le Meur 2007), andClaes 2006(main results inClaes 2005). One article was a separate safety analysis: Mihajlovic 2010(main results in Mihajlovic 2003).
In four trials, two different comparisons were analyzed in one ar-ticle, midazolam and fentanyl continuous infusion anaesthesia for cardiac surgery were independently titrated to maintain haemo-dynamic stability infusions but analyzed in the same population (Theil 1993 fentanyl;Theil 1993 midazolam). Therefore, these two drugs were reviewed separately. In one article,Vadher 1997 pop1considered people starting warfarin with a targeted interna-tional normalized ratio (INR) between 2 and 3;Vadher 1997 pop2 considered people on long-term treatment with a targeted INR between 3 and 4.5.Poller 1998 pop1considered inpatients need-ing anticoagulant therapy (stabilized patients);Poller 1998 pop2 considered outpatients needing anticoagulant therapy (in the sta-bilization period). The results from two computer-assisted dosage programs (DAWN AC and PARMA 5) were first published in one clinical endpoint report from the European Action on Anticoagu-lation (EAA), which gave the combined results (Poller 2008) and secondly published in two separate reports (Poller 2008 PARMA 5;Poller 2009 DAWN AC), because the computer-assistance dif-fered considerably between the participant centres in the study using the two alternative programs. We decided to include the two computer-assisted dosage programs as two subgroup analyses. All studies were RCTs, except two (Chertow 2001;Manotti 2001), which we classified as NRCTs.
In one publication concerning warfarin dosage adjustment (Carter 1987), three groups were studied: we reviewed only the compari-son between the group using an analogue-computer method and the group using empiric dosing (control). The third group, using a linear regression model, was excluded because it did not involve any computer assistance.
In one publication (Manotti 2001), two different groups of people were studied: one group starting oral anticoagulants (induction) and one group on long-term treatment (maintenance). The main-tenance study was not reviewed because of the absence of relevant data for the primary outcome.
In one publication, two different studies were reported: the first study considered people starting warfarin with a targeted INR between 2 and 3 (Vadher 1997 pop1); the second study considered people on long-term treatment with a targeted INR between 3 and 4.5 (Vadher 1997 pop2).
In one publication (Fitzmaurice 2000), there were two levels of randomization. Practices were randomized to intervention or con-trol. The study used two control populations: people individually randomly allocated to control in the intervention practices (in-trapractice controls) and all participants in the control practices (interpractice controls). We did not analyze interpractice controls to avoid a possible unit of analysis error.
In one publication concerning oral anticoagulation therapy at steady state where randomization was at the GP practice level (re-ported inClaes 2005;Claes 2006), four groups were studied: we reviewed only the comparison between group A (Grol’s multi-faceted education: summary of the guidelines printed on the cover of a folder containing the anticoagulation files; information book-lets on anticoagulation for their patients; website with guidelines, study design, and general information; newsletter sent every two months to inform the GPs on the study progress and requested them to send the anticoagulation files for checking) and group D (Grol’s multifaceted education + DAWN AC computer-assisted advice that generated a recommended dosing scheme and the time to next visit). Group A did not correspond to standard practice but it was considered as a control group because GPs in group D also received the multifaceted education. Groups B and C were excluded because the interventions were not computerized advice on drug dosage.
In one publication concerning insulin in cardiac surgery patients (Blaha 2009), three groups were studied: we reviewed only the comparison between the group using the Matias protocol based on the absolute glucose value and the group using computer-based model predictive control algorithm with variable sampling rate (Enhanced software Model Predictive Control (eMPC)). The third group, using the Bath protocol based on the relative glu-cose change was excluded since most standard protocols in blood glucose management use the absolute glucose value and the Bath protocol had not been used in the hospital before the study. Four comparisons/three trials included (Poller 1998 pop1; Anderson 2007;Poller 2008 PARMA 5;Poller 2009 DAWN AC) had duplicate publications (Poller 2002;Anderson 2008;Poller 2008), and three comparisons/two trials included (Le Meur 2007; Poller 2008 PARMA 5;Poller 2009 DAWN AC) were mentioned earlier in abstracts (Poller 2003;Le Meur 2007 extract).
Excluded studies
We excluded 143 of the 199 full-text articles assessed for
eligi-14 Computerized advice on drug dosage to improve prescribing practice (Review)
bility: 72 because the intervention was not a computerized drug dosage, 38 for an inappropriate design, 12 for absence of relevant data for primary outcome, seven because the patient aid was not under physician control, five because the dose advice was not indi-vidualized, three discussions, two conferences publications where contact to author failed (Ghazal-Aswad 1997;Tomek 2011), one abstract published elsewhere (van Leeuwen 2005), one because some participants were already included in another publication (Jankovic 1999) and one comment (Ligtenberg 2006).
One study included in the previous update of the review was ex-cluded because the intervention corresponded to a closed-loop sys-tem (automatic optimization of the infusion rate of sodium nitro-prusside achieved by an integrated hardware-software closed-loop controller implemented as a small bedside device) (Ruiz 1993).
Ongoing studies
A total of 17 studies are awaiting classification (possibly relevant ongoing studies published between January 2012 and January 2013). Three references corresponding to conference publications not published at the time of the search for this update (Overgaard 2010; Anderson 2011; Nieuwlaat 2011), have been published since then (Anderson 2012;Nieuwlaat 2012;Rasmussen 2012).
Characteristics of the providers
The providers were primarily doctors, although 14 studies (33.3%) targeted several categories of healthcare professionals including pharmacists (Carter 1987;White 1987;Destache 1990;Leehey 1993; Mungall 1994;Anderson 2007), nurses (Vadher 1997; Vadher 1997 pop2;Vadher 1997 pop1;Ageno 1998;Ageno 2000; Fitzmaurice 2000;Blaha 2009), or other healthcare professionals (Claes 2005;Claes 2006;Saager 2008). Three studies addressed only nurses’ behaviour (White 1991;Pachler 2008;Cordingley 2009).
Twenty studies (47.6%) were conducted in North America (17 in the US, three in Canada) and 15 (35.7%) in Europe (three studies with numerous countries Poller 1998 pop1; Poller 1998 pop2; Plank 2006;Cordingley 2009). Two studies took place in New Zealand (Begg 1989;Hickling 1989), one in Australia (Hurley 1986), one in Israel (Verner 1992), one in Norway (Asberg 2010), and one in Serbia (Mihajlovic 2003;Mihajlovic 2010). One study was conducted in 13 countries from Europe, Israel and Australia (Poller 2008 PARMA 5;Poller 2009 DAWN AC).
Thirty-one studies (73.8%) were conducted in one centre, and seven studies (16.7%) in two to five centres. One study took place in 11 centres (Le Meur 2007); one study included 12 practices (Fitzmaurice 2000); one study was conducted in 32 centres from Europe (29 centres), Israel (two centres), and Australia (one cen-tre) (Poller 2008 PARMA 5;Poller 2009 DAWN AC); one study included 96 GPs regrouped in 66 GP practices (Claes 2005;Claes 2006).
Twenty-seven comparisons (58.7%) included fewer than 100 ticipants in the analyses (median: 80 participants, mean: 779 par-ticipants).
Target behaviour
The target behaviour of the healthcare provider was the prescrip-tion and the dosing of drugs.
Characteristics of the interventions
Most of the studies provided advice about appropriate drug dosages to healthcare professionals who then decided whether to follow this or not. Fifteen studies (35.7%) (18 comparisons) eval-uated anticoagulants, 10 studies (23.8%) evaleval-uated the adminis-tration of insulin, five studies (11.9%) evaluated the administra-tion of aminoglycoside antibiotics, four studies (9.5%) evaluated theophylline, four studies (9.5%) evaluated anti-rejection drugs requiring adjustments for renal impairment, two studies (4.8%) (three comparisons) evaluated computer-controlled infusions of anaesthetic agents, one study (2.4%) evaluated amitriptyline in the treatment of major depressive episodes and one study (2.4%) evaluated ovarian stimulation by gonadotropins.
Most of the computer support systems used a mathematical model of the pharmacokinetics of the drug to predict the required dose. These models represent the compartments in the body in which the drug is distributed, with rate constants determining the move-ment of the drug between different compartmove-ments. These systems allowed the operator to specify a target serum drug level, which the computer attempted to achieve using Bayesian forecasting meth-ods. Where the effect of the drug was more important than the serum level, pharmacodynamic parameters based on population data could be added to the model (White 1987).
Anticoagulants (fifteen studies, eighteen comparisons)
Fourteen studies evaluated oral anticoagulant and one study eval-uated heparin (Mungall 1994). Five studies analyzed initiation of warfarin (Carter 1987; White 1987; Ageno 2000; Manotti 2001; Anderson 2007), with varying target INR ranges (see Characteristics of included studies). Four studies (five compar-isons) analyzed long-term warfarin therapy (White 1991;Vadher 1997 pop1;Ageno 2000;Fitzmaurice 2000; Claes 2005;Claes 2006), with varying target INR ranges (seeCharacteristics of included studies). One study analyzed heparin therapy (Mungall 1994). Six studies (five comparisons) analyzed both initiation and long-term warfarin therapy with at least three months of follow-up (Vadher 1997;Vadher 1997 pop2;Poller 1998 pop1;Poller 1998 pop2;Mitra 2005;Poller 2008 PARMA 5;Poller 2009 DAWN AC).
The setting was outpatient care for six studies (White 1991;Vadher 1997 pop1;Vadher 1997 pop2;Ageno 1998;Poller 1998 pop1; Poller 1998 pop2;Manotti 2001;Poller 2008), community-based 15 Computerized advice on drug dosage to improve prescribing practice (Review)
care in two studies (Fitzmaurice 2000;Claes 2005;Claes 2006), and inpatient care for six studies (Carter 1987:White 1987; Mungall 1994;Ageno 2000;Mitra 2005;Anderson 2007); it was mixed in one study (Vadher 1997).
The computer support systems were programs that were not inte-grated into a CPOE. The computer-generated program DAWN AC (4S Information Systems Ltd.) was used in five studies (Poller 1998 pop1;Poller 1998 pop2;Ageno 2000;Claes 2005;Mitra 2005;Claes 2006;Poller 2009 DAWN AC). Two modules existed in the DAWN AC program (induction and maintenance). Four studies used a (Bayesian) computer pharmacokinetic or a phar-macodynamic model (Carter 1987;White 1987;White 1991; Mungall 1994), or both, whereas one used a pharmacogenetics model (Anderson 2007). One study used the PARMA (Program for Archive, Refertation, and Monitoring of Anticoagulated pa-tients) software program developed in Italy (Manotti 2001), and one comparison used PARMA 5, a new version of the program (Poller 2008 PARMA 5). Other studies used dosage algorithms or prediction rules.
The advice was given in real time to the healthcare professional in all studies except three, where it was unclear (Vadher 1997;Poller 1998 pop1;Poller 1998 pop2;Claes 2005;Claes 2006). The com-puterized advice was user-initiated in seven studies (White 1987; White 1991;Vadher 1997 pop1;Vadher 1997 pop2;Ageno 1998; Fitzmaurice 2000;Claes 2005;Claes 2006;Anderson 2007), sys-tem-initiated in two studies (Manotti 2001;Poller 2008 PARMA 5; Poller 2009 DAWN AC), and it was unclear in six studies (Carter 1987; Mungall 1994;Vadher 1997; Poller 1998 pop1; Poller 1998 pop2;Ageno 1998;Mitra 2005). The intervention was direct in seven studies (White 1991; Vadher 1997 pop1; Vadher 1997 pop2;Ageno 1998;Fitzmaurice 2000;Ageno 2000; Manotti 2001;Anderson 2007), indirect in three studies (dosage determined by pharmacy inCarter 1987andMungall 1994, and the pathologist reviewed the computer-generated advice inClaes 2005) and it was unclear in five studies (White 1987;Vadher 1997; Poller 1998 pop1;Poller 1998 pop2;Mitra 2005;Poller 2008). Three comparisons provided the warfarin maintenance doses per participant (Carter 1987;Vadher 1997 pop1;Vadher 1997 pop2), and there was no significant difference between groups (MD -0.33 mg/day, 95% CI -1.18 to 0.53). One study reported signif-icantly larger amounts of drug prescribed for people with high INR target both of warfarin (computer group = 33.3 mg/week versus manual = 31.3 mg/week; P value < 0.001), and aceno-coumarol (computer group = 19.2 mg/week versus manual = 17.8 mg/week; P value < 0.01), whereas there was no significant dif-ference between the doses prescribed for people with low INR target (Manotti 2001). One study analyzed the number of dose adjustments (Anderson 2007): pharmacogenetic guidance signif-icantly decreased the number of required dose adjustments (by 0.62 dose adjustments per participant; 95% CI 0.04 to 1.19; P value = 0.035).
There were two eligible comparisons with potential unit of
analy-sis error that analyzed the proportion of dose adjustments. In one comparison (Ageno 1998), the percentage of dose adjustments performed by the healthcare professionals was 47.4%, whereas the computer needed 31.3% dose adjustments, a statistically signifi-cant 34.0% relative reduction (95% CI -41.9% to -24.7%). In the other comparison (Ageno 2000), the proportion of dose adjust-ments was 48% in the computer group and 45% in the manual group, a non-significant relative increase of 7% (95% CI -10% to 27%).
In Claes 2005, there was no significant difference among the groups in number of tests per participant per month and per cent of participants with treatment changes.
For heparin (Mungall 1994), the mean dose was not significantly different between the computer and the standard groups (MD 100 units/hour, 95% CI -96 to 296).
Insulin (ten studies)
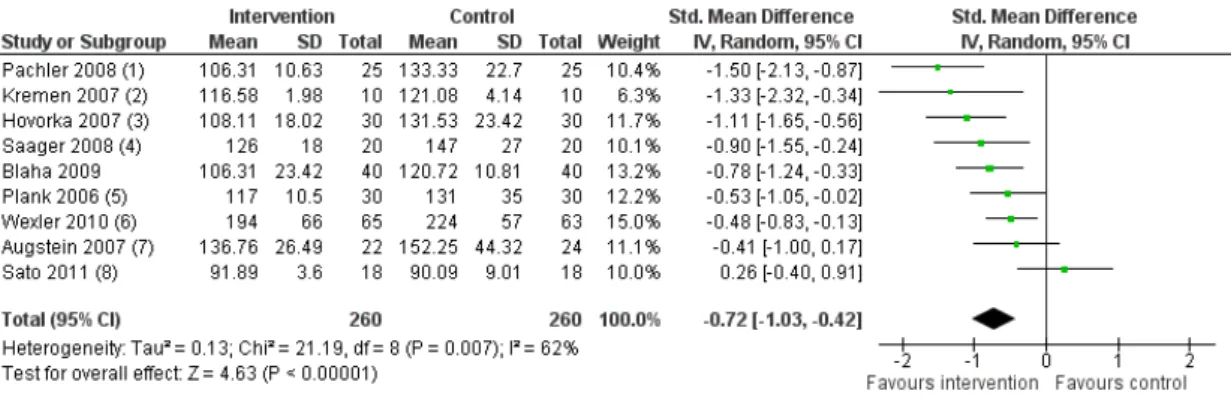
Eight studies (80%) evaluated insulin in people admitted into the intensive care unit with hyperglycaemia: six studies in car-diac surgery patients (Plank 2006;Hovorka 2007;Kremen 2007; Saager 2008;Blaha 2009;Sato 2011) and two studies in critically ill patients (Pachler 2008;Cordingley 2009). One study was con-ducted in general medical inpatients with type 2 diabetes (Wexler 2010) and one study in diabetic outpatients (Augstein 2007). The computer support system was integrated into a CPOE in one study (Wexler 2010), whereas other systems were software developed by companies. The software Model Predictive Control (MPC) was used in two studies (Plank 2006;Kremen 2007). The laptop-based algorithm MPC is a model representing the glucoreg-ulatory system. Glucose concentration, insulin dosage and carbo-hydrate intake are the input variables for the MPC. The insulin infusion rate is the output parameter based on hourly glucose sam-pling. eMPC was used in four studies (Hovorka 2007; Pachler 2008;Blaha 2009;Cordingley 2009). The eMPC is an enhanced version of the model predictive control algorithm (MPC), which additionally generates the time of the next glucose measurement with an interval between samples varying from 0.5 to 4 hours. All six studies were part of theCLINICIP(Closed Loop Insulin In-fusion for Critically Ill Patients;www.clinicip.org), an integrated project funded by the European Community working towards the development of a closed-loop system to achieve safe tight glucose control in intensive care patients. Three studies used other soft-ware that take account of the characteristics of glucose dynam-ics (KArlsburg Diabetes Management System (KADIS):Augstein 2007, EndoTool Glucose Management System (MD Scienti c): Saager 2008, GIN Computer Software (GINCS):Sato 2011), and one study used a weight-based insulin dose calculator (Wexler 2010).
The advice was given in real time to the healthcare professional in all studies except one, where it was unclear (Augstein 2007). The computerized advice was user-initiated in six studies (Plank 2006; 16 Computerized advice on drug dosage to improve prescribing practice (Review)
Hovorka 2007;Kremen 2007;Augstein 2007;Pachler 2008;Blaha 2009), system-initiated in two studies (Saager 2008;Wexler 2010), and it was unclear in two studies (Cordingley 2009;Sato 2011). The intervention was direct in seven studies (Hovorka 2007; Pachler 2008;Saager 2008;Cordingley 2009;Blaha 2009;Wexler 2010;Sato 2011), indirect in one study (eMPC algorithm was run by study personnel (input glucose and change of Insulin infusion rate) under the supervision of the healthcare professional inPlank 2006) and it was unclear in two studies (Kremen 2007;Augstein 2007).
Seven comparisons provided the insulin doses. The statistical het-erogeneity was moderate. In one study (Hovorka 2007), the mean insulin infusion rate was significantly higher in the computer-ized glucose management group than standard management pro-tocol group (MD +2.10 insulin units/hour, 95% CI 0.77 to 3.43), whereas there were no significant differences in the others (four comparisons with higher doses in the computer group, two com-parisons with higher doses in the standard group). Overall, the insulin doses were higher in the computer groups, but this was not significantly different (pooled SMD 0.23, 95% CI -0.04 to 0.50). One study reported no differences in the amount of glucose ad-ministered between the computer group (79.4 ± 24 g) and the manual group (81.6 ± 28 g) during the study period (before, dur-ing and after cardiopulmonary bypass) (MD -2.2 g, 95% CI -19.2 to 14.8) (Sato 2011).
One study analyzed the number of times the insulin rate was changed in 72 hours: the insulin infusion rate was altered a mean of 23.5 times more (95% CI 19.0 to 28.0) in the computer group than in the control group (35.5, 95% CI 31.1 to 39.9 versus 12.0, 95% CI 10.3 to 13.7) (Pachler 2008).
Aminoglycoside antibiotics (five studies)
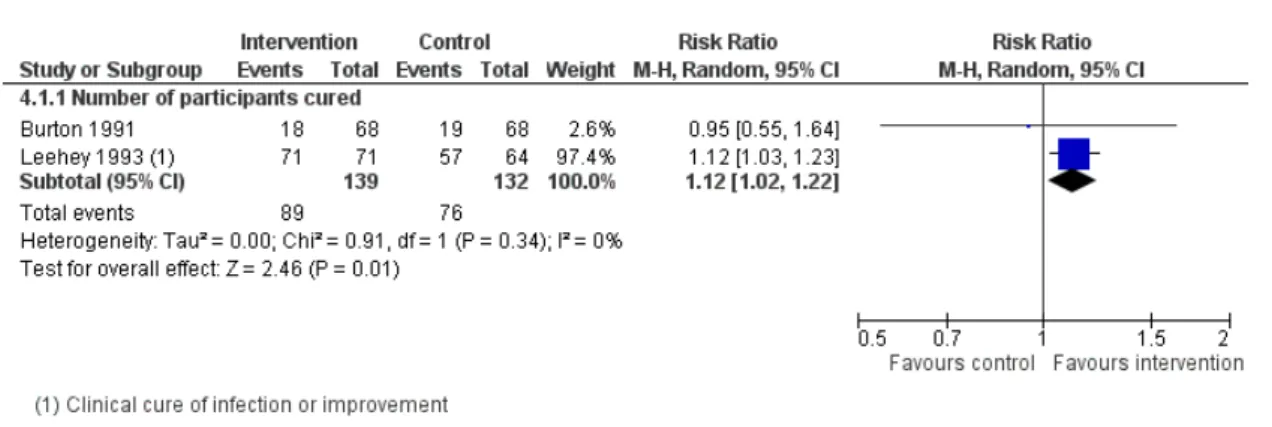
Five studies (Begg 1989;Hickling 1989;Destache 1990;Burton 1991; Leehey 1993) evaluated the administration of aminogly-coside in inpatient care. All computer support systems used a (Bayesian) pharmacokinetic model with the advice given in real time to the healthcare professional, not integrated into a CPOE, and it was not clear if the computerized advice was user-initiated. The intervention was indirect in two studies (Destache 1990: a clinical pharmacokinetic service reviewed the initial aminoglyco-side dose and dosing interval and made an oral recommendation to the attending physician or resident;Leehey 1993: the orders for aminoglycoside dosing were written by a pharmacist with coun-tersignature by a physician and the duration of antibiotic therapy as well as other aspects of clinical care were determined by the primary physicians).
One comparison provided outcomes for the analysis on initial and maintenance doses (Burton 1991). There was no statistical difference between groups for initial doses (MD +8 mg/day, 95% CI -11 to 27) or for maintenance doses (MD +11 mg/day, 95% CI -16 to 38).
Two studies reported data on total administered dose with differ-ent magnitude of effects. In one study (Begg 1989), the amino-glycoside dose per day was significantly higher in the pharmacoki-netic group than in the standard group (+109 g, 95% CI 67 to 151). In the other study (Leehey 1993), the milligrams per dose were higher and number of doses per day was lower in the phar-macist-directed dosing group compared with the standard group (milligrams/dose: 107 ± 21 versus 91 ± 26; doses/day: 2.0 ± 0.6 versus 2.3 ± 0.5) but the mean total doses of aminoglycoside were not significantly different between groups (pooled MD 141 mg, 95% CI -342 to 624).
One study analyzed the number of dosage changes and indicated higher dosage changes in the group with pharmacokinetic service recommendation than in the control group (MD +0.50 dosage change, 95% CI 0.21 to 0.79) (Destache 1990).
Theophylline (four studies)
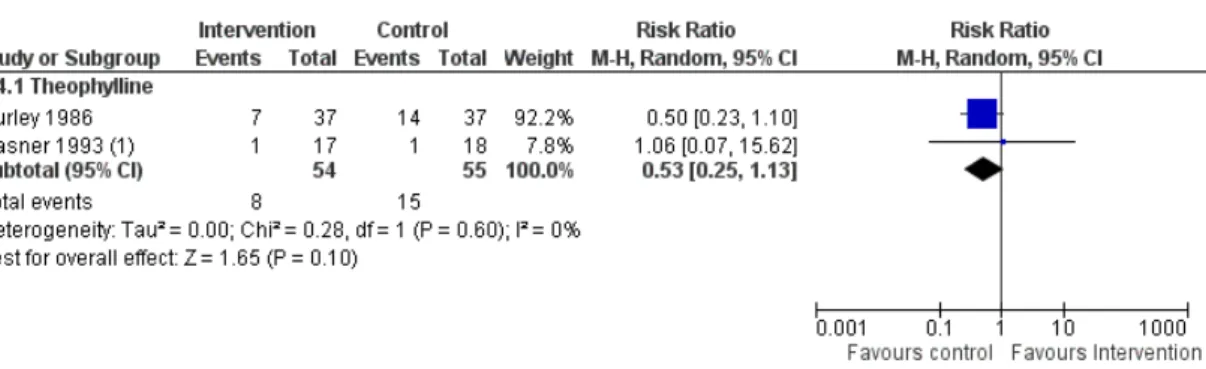
Four studies evaluated theophylline (Hurley 1986;Gonzalez 1989; Verner 1992;Casner 1993), a drug that is not considered as the first choice of treatment of asthma at present. However, moni-toring serum concentrations of theophylline is essential to ensure that non-toxic doses are achieved (National Asthma 2002). There were no studies on recently introduced drugs where it is consid-ered important to monitor drug levels such as for glycopeptides, antifungal (fluconazole) and antiretroviral drugs.
The setting was inpatient care for all four studies.
All computer support systems used a Bayesian compartmental pharmacokinetic model. The advice was given in real time to the healthcare professional in three studies, whereas it was unclear in one study (Verner 1992). The computer support system was inte-grated into a CPOE with a direct intervention in one study (Casner 1993), whereas it was unclear for the others. The computerized advice was user-initiated in two studies and it was unclear in two studies.
Three comparisons provided data on initial dose with substantial heterogeneity (Hurley 1986;Gonzalez 1989;Verner 1992). The theophylline initial dose was significantly higher in the computer group (SMD 1.7, 95% CI 0.7 to 2.6), whereas the difference did not reach significance in the two other studies (SMD 0.2, 95% CI -0.1 to 0.6). Two comparisons provided data on maintenance dose and indicated higher doses in the computer group (SMD 0.8, 95% CI 0.5 to 1.1) (Hurley 1986;Gonzalez 1989).
Anti-rejection drugs (four studies)
Four studies evaluated anti-rejection drugs requiring adjustments for renal impairment (Chertow 2001; Le Meur 2007; Asberg 2010;Terrell 2010). Two studies evaluated high-use medications that required adjustments for renal impairment (Chertow 2001; Terrell 2010), one study evaluated cyclosporine A (CsA) in the early post-transplant phase (Asberg 2010), and one study evaluated 17 Computerized advice on drug dosage to improve prescribing practice (Review)