Publisher’s version / Version de l'éditeur: NISTIR, 1997
READ THESE TERMS AND CONDITIONS CAREFULLY BEFORE USING THIS WEBSITE.
https://nrc-publications.canada.ca/eng/copyright
Vous avez des questions? Nous pouvons vous aider. Pour communiquer directement avec un auteur, consultez la première page de la revue dans laquelle son article a été publié afin de trouver ses coordonnées. Si vous n’arrivez pas à les repérer, communiquez avec nous à PublicationsArchive-ArchivesPublications@nrc-cnrc.gc.ca.
Questions? Contact the NRC Publications Archive team at
PublicationsArchive-ArchivesPublications@nrc-cnrc.gc.ca. If you wish to email the authors directly, please see the first page of the publication for their contact information.
NRC Publications Archive
Archives des publications du CNRC
For the publisher’s version, please access the DOI link below./ Pour consulter la version de l’éditeur, utilisez le lien DOI ci-dessous.
https://doi.org/10.4224/20331651
Access and use of this website and the material on it are subject to the Terms and Conditions set forth at
NIST/NRC-Canada interlaboratory comparison of guarded hot plate measurements: 1993-1997
Zarr, R. R.; Kumaran, M. K.; Lagergren, E. S.
https://publications-cnrc.canada.ca/fra/droits
L’accès à ce site Web et l’utilisation de son contenu sont assujettis aux conditions présentées dans le site LISEZ CES CONDITIONS ATTENTIVEMENT AVANT D’UTILISER CE SITE WEB.
NRC Publications Record / Notice d'Archives des publications de CNRC:
https://nrc-publications.canada.ca/eng/view/object/?id=340a9a74-1a94-4ad6-934a-c75ca1eb1914 https://publications-cnrc.canada.ca/fra/voir/objet/?id=340a9a74-1a94-4ad6-934a-c75ca1eb1914
NISTIR 6087
NISTINRC-Canada Interlaboratory Comparison of Guarded
Hot Plate Measurements: 1993-1997
R. R. Zarr
Building Environment Division
Building and Fire Research Laboratory
National Institute of Standards and Technology
Gaithersburg, Maryland 20899 USA M. K. Kumaran
Building Performance Laboratory Institute for Research in Construction
National Research Council Canada
Ottawa, OntarioKIAOR6 Canada
E. S. Lagergren
Statistical Engineering Division
Information Technology Laboratory
National Institute of Standardsand Technology
Gaithersburg, Maryland 20899 USA
NIST
United States Department of Commerce Technology Administration
Abstract
Thennal conductivity measurements from an international interlaboratory study between the United States and Canada are presented for two materials, glass-fiber board and fibrous alumina silica. The measurements were detennined using guarded hot plate apparatus at the National Institute of Standards and Technology and at the National Research Council Canada. The nominal bulk densities and thicknesses for the specimens ofglass-fiber board and fibrous alumina silica were 160 kglml and
25.1 mm, and 290 kglm3 and 25.2 mm, respectively. Measurements ofthennal conductivity were
conducted over a temperature range of273 K to 340K. Statistical regression analyses of the data are presented.
Keywords: alumina silica, building technology, glass fiber, guarded hot plate apparatus, insulation, interlaboratory, international, regression, statistics, steady state, thermal conductivity, thermal resistance
Introduction
In North America, manufacturers of thermal insulation must satisfy the thermal performance requirements promulgated by the governments of the United States and Canada in order to market their products in both countries. Consequently, these industries depend heavily on national standards for thermal resistance issued by the United States and by Canada. In the United States, the responsibility for national standards has traditionally been maintained by the National Institute of Standards and Technology (NIST) and in Canada, by the National Research Council Canada (NRC-Canada). Recently, a question concerning the agreement of thermal resistance measurements between NIST and NRC-Canada has arisen. To address this issue, NIST and NRC-Canada have completed an interlaboratory study between their respective guarded hot plate apparatus. This study is intended as a first step (or pilot run) for future comparisons between the laboratories.
The guarded hot plate apparatus is considered an absolute method for the determination of thermal transmission properties of heat insulators under steady-state conditions. The test method has been standardized for several years; see, for example, ASTM Test Method C 177 [1
J
or ISO 8302 [2]. Both test methods allow some latitude in the design of the apparatus. An assessment of apparatus errors by theoretical treatment, i.e., error propagation formula, can yield a relative combined standard uncertainty (k= 1) of approximately± 0.5 % to ± 1.0 % for a properly designed apparatus. The stated imprecision for standard test methods is higher, however, on the order of± 2 % to± 5 % [1,2] at ambient conditions for homogeneous materials. These imprecision values for standard test methods are derived from empirical test data obtained from different laboratories and include the effects of other factors such as operator, specimen homogeneity, or equipment variations.The interlaboratory study between NIST and NRC-Canada was initiated in 1993, completed in 1997, and included two materials, glass-fiber board and fibrous alumina silica. The first material was selected from Standard Reference Material (SRM) 1450c, Fibrous Glass Board [3]. The second material was originally part ofan ASTM C-16.30 Interlaboratory Study of high-temperature guarded hot plate apparatus. The data presented herein for fibrous alumina silica are used with permission of the ASTM C-16.30 Task Group. A single pair of specimens of each material was circulated between both laboratories; therefore, this comparison represents a round-robin in the true sense. Values of apparent' thermal conductivity were reported over a temperature range of273 K to 340K. This report describes the test materials, test method and equipment, experimental results, and statistical analyses of the thermal conductivity data.
IThe thermal transmission properties of heat insulators determined from standard test methods typically include several mechanisms of heat transfer, including conduction, radiation, and possibly convection. For that reason, some experimentalists will include the adjective "apparent" when describing thennal conductivity of thermal insulation. However, for brevity, the tenn thennal conductivity will be used in this report.
Experimental
Materials
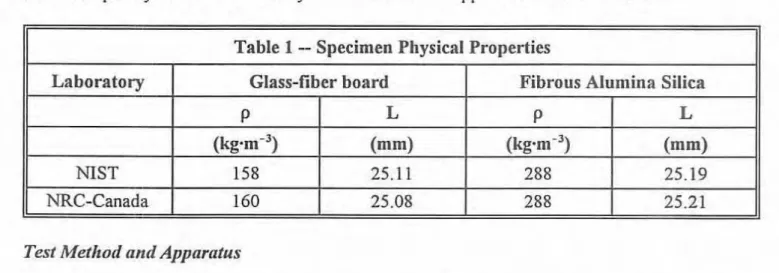
In this study, a single pair of glass-fiber board and fibrous alumina silica specimens were circulated to both laboratories. The pair of glass-fiber board specimens were selected from the material lot used to develop SRM 1450c [3] and the pair of fibrous alumina silica specimens were provided as part of an ASTM C-16.30 Interlaboratory Study. Table I summarizes the average bulk density (p).
measured in air, and specimen thickness(L) of the specimens. The small difference in bulk density for glass-fiber board was due to local inhomogeneities in the specimens [3]. Because the apparatus at NIST and NRC-Canada required different size specimens, the specimens were tested first at NIST and subsequently cut to the necessary dimensions for the apparatus at NRC-Canada.
Table 1 -- Specimen Physical Properties
Laboratory Glass-fiber board Fibrous Alumina Silica
p L P L
(kg'm") (mm) (kg'm") (mm)
NlST 158 25.11 288 25.19
NRC-Canada 160 25.08 288 25.21
Test Met/wd and Apparatus
Measurements of thermal conductivity were determined in accordance with standard test methods, ASTM C 177 and/or ISO 8302 [1,2] which are summarized briefly here. Two specimens having nearly the same density, size, and thickness are placed on the two sides of the guarded hot plate and clamped securely by the cold plates. Ideally. the guarded hot plate and the cold plates provide constant temperature boundary conditions to the surfaces of the specimens. With proper guarding in the lateral direction, the apparatus is designed to provide one-dimensional heat flow (Q) through the meter area of the pair of specimens. Additional guarding is provided by a temperature controlled environmental chamber which ordinarily maintains the ambient air temperature at the same value as the mean temperature (7) of the hot and the cold plates.
Under steady-state conditions, measurements of thermal conductivity(A)for the pair of specimens were detennined using the following equation:
Q
= A2A l1TL' (1)
whereQis the heat flow through the meter area of the specimens [W]; 2A is the meter area normal to direction of heat flow, both sides [012];li.Tis the temperature difference across specimens [K]; and,
L is the in-situ thlckness of the pair of specimens [01]. Values ofAwere reported at the mean temperature (7)of the hot and cold plates. tセ V,(T, +TJ
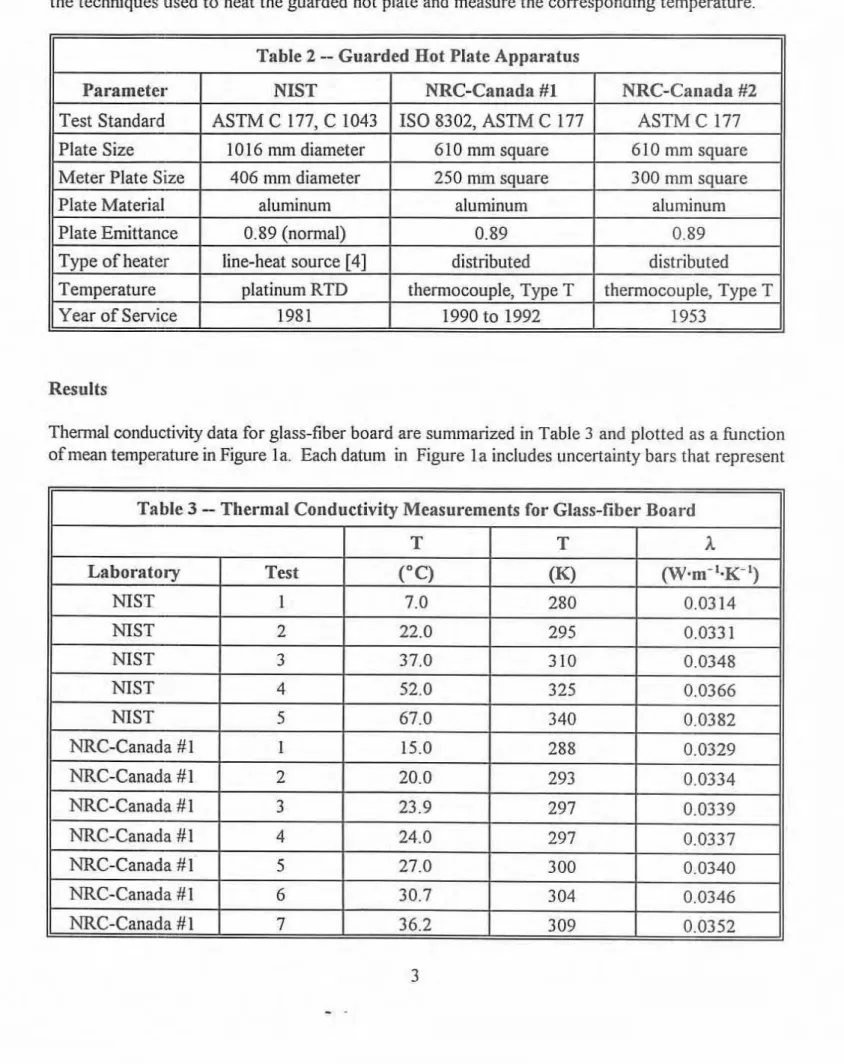
Table 2 summarizes the criteria of theguarded hot plate apparatus used in this study. The essential differences between the NIST and NRC-Canada apparatus were the plate sizes, plate geometry, and the techniques used to heat the guarded hot plate and measure the corresponding temperature.
Table2 -- Guarded HotPlate Apparatus
Parameter NIST NRC-Canada #1 NRC-Canada #2
Test Standard ASTM C 177, C 1043 ISO 8302, ASTM C 177 ASTM C 177
Plate Size 1016 mm diameter 610 mm square 610 mm square Meter Plate Size 406 mm diameter 250 mm square 300 mm square
Plate Material aluminum aluminum aluminum
Plate Emittance 0.89 (normal) 0.89 0.89
Type of heater line-heat source[4] distributed distributed Temperature platinumRTD thermocouple, Type T thennocouple, Type T
Yearof Service 1981 1990 to 1992 1953
Results
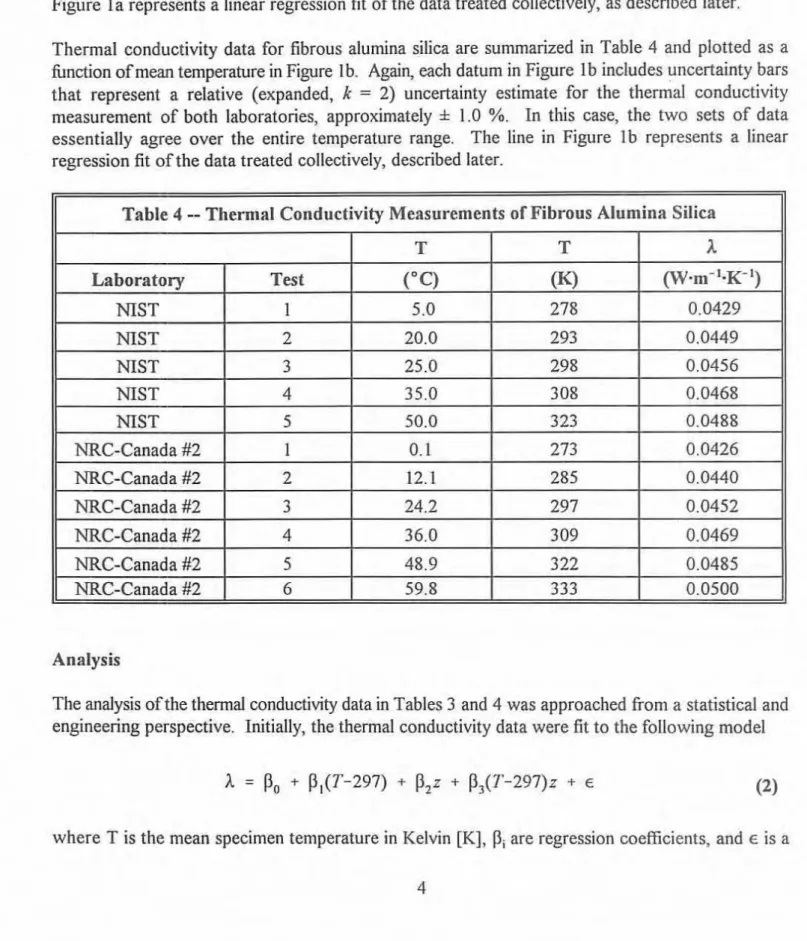
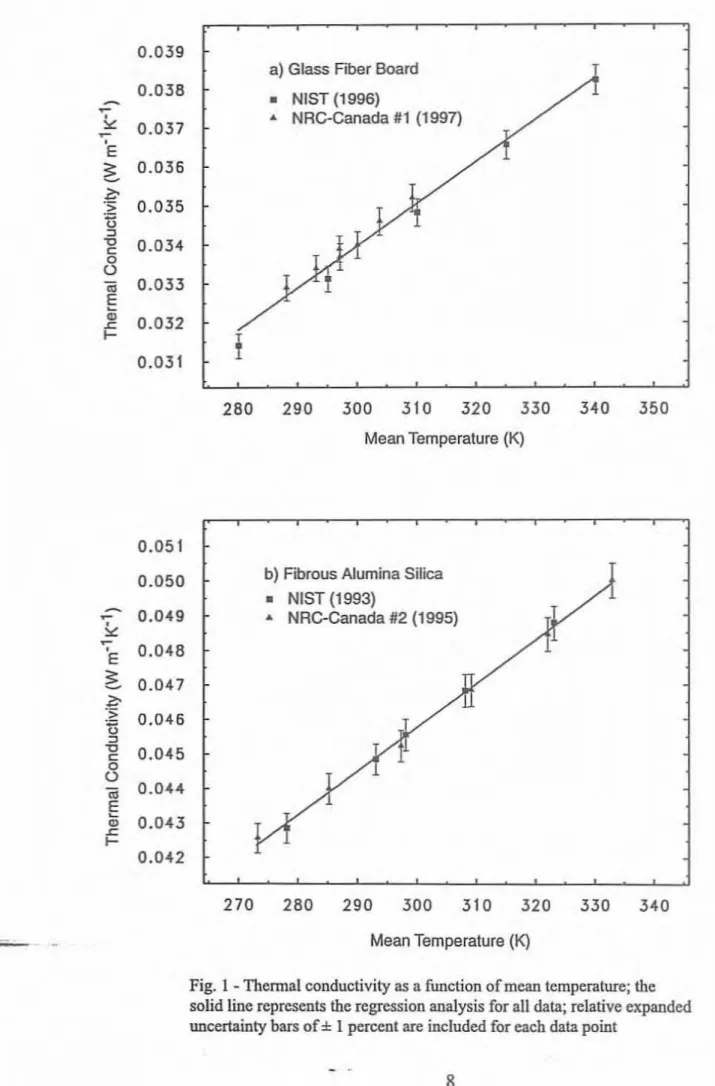
Thennal conductivity data for glass-fiber board are summarized in Table 3 and plotted as a function of meantemperature in Figure lao Each datum in Figure la includes uncertainty bars that represent
Table 3 - Thermal Conductivity Measurements for Glass-fiber Board
T T A
Laboratory Test
("CJ
(K) (W'm-I'K-')NIST I 7.0 280 0.0314 NIST 2 22.0 295 0.0331 NIST 3 37.0 310 0.0348 NIST 4 52.0 325 0.0366 NIST 5 67.0 340 0.0382 NRC-Canada # I I 15.0 288 0.0329 NRC-Canada # I 2 20.0 293 0.0334 NRC-Canada # I 3 23.9 297 0.0339 NRC-Canada # I 4 24.0 297 0.0337 NRC-Canada # I 5 27.0 300 0.0340 NRC-Canada #1 6 30.7 304 0.0346 NRC-Canada # I 7 36.2 309 0.0352 3
the relative (expanded, k = 2) uncertainty estimate for the measurement, approximately± 1.0 % for both laboratories. A small difference, on the order of I %, was observed for the two sets of data. Part of the difference (no more than 0.3 %) could be attributed to the differences in bulk density for the different specimen sizes (Table I). Note, however, that the difference between the two sets of data was within the measurement uncertainties represented by the uncertainty bars. The line in Figure la represents a linear regression fit of the data treated collectively, as described later. Thermal conductivity data for fibrous alumina silica are summarized in Table 4 and plotted as a function of mean temperature in Figure lb. Again, each datum in Figure Ib includes uncertainty bars that represent a relative (expanded, k = 2) uncertainty estimate for the thermal conductivity measurement of both laboratories, approximately ± 1.0 %. In this case, the two sets of data essentially agree over the entire temperature range. The line in Figure Ib represents a linear regression fit of the data treated collectively. described later.
Table 4 -- Thermal Conductivity Measurements of Fibrous Alumina Silica
T
T
ALaboratory Test (0C) (K) (Worn-10K-I)
NIST
1 5.0 278 0.0429NIST
2 20.0 293 0.0449NIST
3 25.0 298 0.0456NIST
4 35.0 308 0.0468NIST
5 50.0 323 0.0488 NRC-Canada #2 1 0.1 273 0.0426 NRC-Canada #2 2 12.1 285 0.0440 NRC-Canada #2 3 24.2 297 0.0452 NRC-Canada #2 4 36.0 309 0.0469 NRC-Canada #2 5 48.9 322 0.0485 NRC-Canada #2 6 59.8 333 0.0500 AnalysisThe anaJysis ofthe thennaJ conductivity data inTables 3 and 4 was approached from a statistical and engineering perspective. Initially. the thennal conductivity data were fit to the following model
A = Po + pp'-297) + P,z + P,(7'-297)z + E (2)
where T is the mean specimen temperature in Kelvin [K],
Pi
are regression coefficients, and E is a 4random error term. Anindicator variable,Z, has been introduced; where
z
= 0 identifies the data from NlST, andz= 1 identifies the data from NRC-Canada. (The selection of these values for zwas purely arbitrary.) Therefore, whenz
=0 the model becomesA " Po
+ P,(T-297) + Eand whenz= 1 the model becomes
A " (Po
+P,)
+(PI
+ P,)(T-297) + EAt 297 K., the intercepts (i.e., offset) of the lines for the two data sets are equal when
P2
= 0 and the slopes of the two data sets are equal whenPl
=O. To test these hypotheses, 95 percent confidence intervals (CI) were constructed forP2
andPl'
The form of the confidence interval is(3)
where" is the number of data points,p is the number of parameters in eq (2), IO.97S,n-p is 97.5
percentile of the Student's t-distribution withn - p degrees of freedom, andsd(pj ) is the standard
deviation of the estimated regression coefficient
Pi'
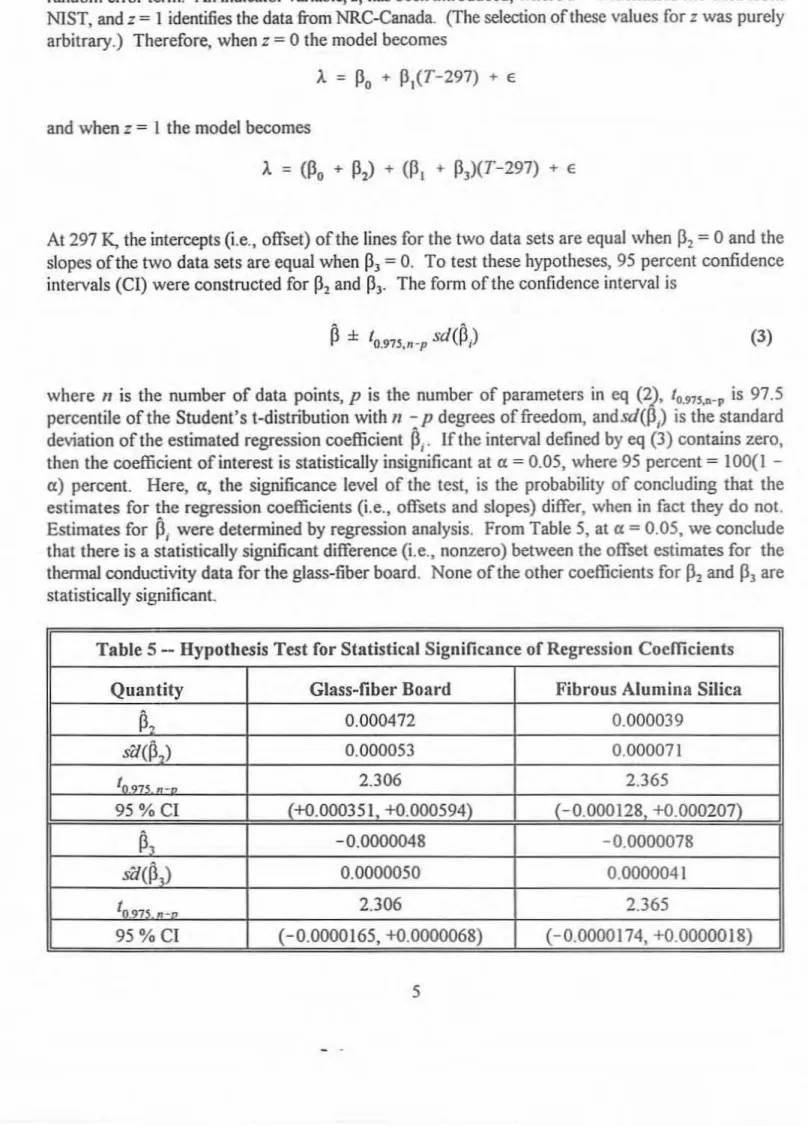
If the interval defined by eq (3) contains zero, then the coefficient of interest is statistically insignificant at a = 0.05, where 95 percent= 100(1 -a) percent. Here, a, the significance level of the test, is the probability of concluding that the estimates for the regression coefficients (i.e., offsets and slopes) differ, when in fact they do not. Estimates forPi
were determined by regression analysis. From Table 5, ata
= 0.05, we conclude that there is a statistically significant difference (i.e., nonzero) between the offset estimates for the thermal conductivity data for the glass-fiber board. None of the other coefficients forP2
andPl
are statistically significant.Table 5 - Hypothesis Test for Statistical Significance of Regression Coefficients
Quantity Glass-fiber Board Fibrous Alumina Silica
P,
0.000472 0.000039 sa(p,) 0.000053 0.000071 I,m _ 2.306 2.365 95%CI 1+0.000351 +0.000594) 1-0.000128 +0.000207)P,
-0.0000048 -0.0000078 sii(P,) 0.0000050 0.0000041 I,
,-" 2.306 2.365 95 % CI (-0.0000165, +00000068) (-0.0000174, +0.0000018) 5Inthe analysis, an engineering assessment of the uncertainties due to the measurement process was also considered. As mentioned above, the relative (expanded, k = 2) uncertainty estimates for the measurements by both laboratories were approx.imately± 1.0%. Further, the stated imprecision for standard test methods is ± 2 % to ± 5% [1,2] at ambient conditions for homogeneous materials. Given that the difference in the offset estimates for the two data sets for glass-fiber board was less than currently accepted uncertainty estimates, the laboratory data for each material was analyzed collectively.
The data from Table 3 and Table 4 were subsequently fit to eq (2) with
p,
セp,
= O. The final equations for glass-fiber board and fibrous alumina silica are shown in eq's (4) and (5), respectively and are also plotted in Figure I.A
= 0.03364 + 1.080xlO-4(T-297)x
= 0.04539 + 1.264x lO-4(T-297)(4)
(5)
The residual standard deviations for the above fits for glass-fiber board and fibrous alumina silica were 0.00024 W·m-I·K-1and 0.00013 W·m-I·K-I
, respectively, which are quite small. The relative
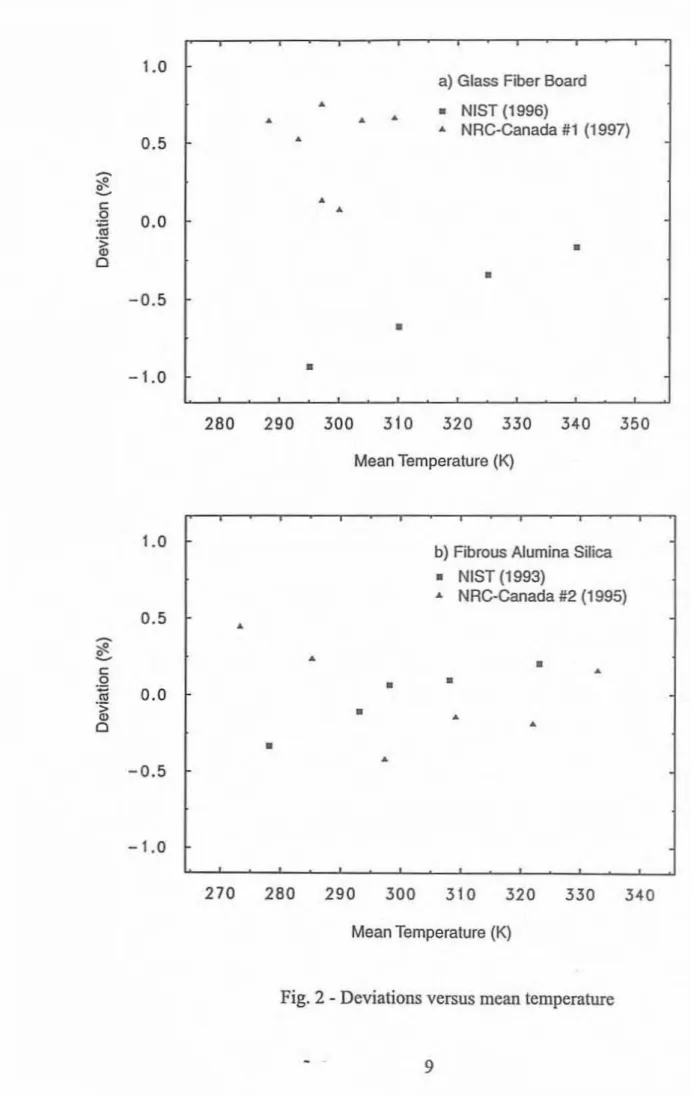
standard deviations multiplied by 2 for the fitted models ofglass-fiber board and fibrous alumina silica were 1.4% and 0.5%,respectively. The adequacy of the fits was further examined by plotting the individual deviations (0) from the model as defined by
0= A -
X
(6)Individual deviations versus Tfor glass-fiber board and fibrous alumina silica are shown in Figure 2. Figure 2a graphically illustrates the nonzero offset that was observed in Table 5 for the two laboratories. The deviations in Figure 2b do not indicate any trends, signifying a satisfactory fit.
Conclusions
A round-robin interlaboratory comparison has been conducted between guarded hot plate apparatus at NlST and NRC-Canada for two thennaJ insulation materials, glass-fiber board and fibrous alumina silica. A single pair of specimens of each material was circulated to both laboratories. The nominal bulk density and thickness for the specimens of glass-fiber board and fibrous alumina silica were 160 kg·m-l and 25.1 mm, and 290 kg·mol and 25.2 mm, respectively. Measurements of thermal conductivity were conducted over a temperature range of273 K to 340 K. Regression analyses of the data revealed a statistically significant (at
a
= 0.05) difference, on the order of I %, for the offset estimate between the laboratory data for glass-fiber board at 297 K (24QC). The reason for the offset is unknown. Therewasno offset noted for the data for fibrous alumina silica. It should be noted that the offset difference noted in this study is within the stated experimental (expanded, k = 2)uncertainties for the respective apparatus, nominally± 1 %. Moreover, the offset difference was well within the precision statements of±2 % to± 5 % provided in standard test methods for guarded hot plate apparatus [1,2]. In conclusion, it should be stated that although the agreement between NlST and NRC-Canada can be considered quite satisfactory, continued improvement in measurement technology is always desired and therefore continued interlaboratory investigations are suggested.
References
[1] ASTM C 177. "Standard Test Method for Steady-State Heat Flux Measurements and Thermal Transmission Properties by Means of the Guarded Hot Plate Apparatus," Annual Book ofAS1M Standards, Vol. 04.06.
[2] ISO 8302. "Thermal Insulation - Determination of Steady-StateArealThermal Resistance and Related Properties - Guarded Hot Plate Apparatus:' International Organization for Standardization.
[3] Zarr, R. R., "Standard Reference Materials: Glass Fiberboard, SRM 1450c, for Thennal Resistance from 280 K to 340 K," NISI' Special Publication 260-130, 1997.
[4] ASTM C 1043." Practice for Guarded-Hat-Plate Design Using Circular Line-Heat-Saurces,"
Annual Book ofASTM Standards, Vol. 04.06.
280 290 300 310 320 330 340 350 Mean Temperature (K)
0.05f
0.050 b) Fibrous Alumina Silica
•
NIST (1993)-
0.049 NRC-Canada #2 (1995)-
•
;"-
• 0.048 E セ 0.047セ
0.046t5
"
"0 0.045 c 0 0'"
Eセ 0.044 0.043"
セ f-0.042 270 280 290 300 310 320 330 340 Mean Temperature (K)Fig. I - Thennal conductivity as a function of mean temperature; the solid line represents the regression analysis for all data; relative expanded uncertainty bars of± 1 percent are included for each data point
1.0
a) Glass Fiber Board
•
•
NIST (1996)•
•
••
NRC·Canada #1 (1997) 0.5 •;e-
o-
c•
•
.2 0.0..
.
;;•
w Cl•
-0.5•
•
- 1.0 280 290 300 310 320 330 340 350 Mean Temperature (K) -1.0 270 280 290 300 310 320 330 340 Mean Temperature (K)Fig. 2 - Deviations versus mean temperature