Publisher’s version / Version de l'éditeur:
Simulation, and Controls (AeroSense 2002), 4714, 2002
READ THESE TERMS AND CONDITIONS CAREFULLY BEFORE USING THIS WEBSITE.
https://nrc-publications.canada.ca/eng/copyright
Vous avez des questions? Nous pouvons vous aider. Pour communiquer directement avec un auteur, consultez la
première page de la revue dans laquelle son article a été publié afin de trouver ses coordonnées. Si vous n’arrivez pas à les repérer, communiquez avec nous à [email protected].
Questions? Contact the NRC Publications Archive team at
[email protected]. If you wish to email the authors directly, please see the first page of the publication for their contact information.
NRC Publications Archive
Archives des publications du CNRC
This publication could be one of several versions: author’s original, accepted manuscript or the publisher’s version. / La version de cette publication peut être l’une des suivantes : la version prépublication de l’auteur, la version acceptée du manuscrit ou la version de l’éditeur.
Access and use of this website and the material on it are subject to the Terms and Conditions set forth at
Imaging and Tracking Elements of the International Space Station
using a 3D Auto-Synchronized Scanner
Samson, C.; English, C.; Deslauriers, A.; Christie, I.; Blais, François
https://publications-cnrc.canada.ca/fra/droits
L’accès à ce site Web et l’utilisation de son contenu sont assujettis aux conditions présentées dans le site LISEZ CES CONDITIONS ATTENTIVEMENT AVANT D’UTILISER CE SITE WEB.
NRC Publications Record / Notice d'Archives des publications de CNRC:
https://nrc-publications.canada.ca/eng/view/object/?id=0fa29cd0-fc6c-42e4-8857-c72e888a5517 https://publications-cnrc.canada.ca/fra/voir/objet/?id=0fa29cd0-fc6c-42e4-8857-c72e888a5517National Research Council Canada Institute for Information Technology Conseil national de recherches Canada Institut de technologie de l’information
Imaging and tracking elements of the International
Space Station using a 3D auto-synchronized scanner.
Samson, C., English, C., Deslauriers, A., Christie, I., and Blais, F.
April 2002
* SPIE's 16th Annual International Symposium Proceedings on Aerospace/Defence Sensing, Simulation, and Controls (AeroSense 2002), Orlando, Florida.
April 1-5, 2002. NRC 44920.
Copyright 2002 by
National Research Council of Canada
Permission is granted to quote short excerpts and to reproduce figures and tables from this report, provided that the source of such material is fully acknowledged.
Imaging and tracking elements of the International Space
Station using a 3D auto-synchronized scanner
Claire Samson
a, Chad English
a, Adam Deslauriers
a, Iain Christie
a, and François Blais
b aNeptec Design Group, 302 Legget Drive, Kanata, Ontario, Canada K2K 1Y5
bNational Research Council of Canada, Ottawa, Ontario, Canada K1A 0R6
ABSTRACT
The Neptec Design Group has developed a new 3D auto-synchronized laser scanner for space applications, based on a principle from the National Research Council of Canada. In imaging mode, the Laser Camera System (LCS) raster scans objects and computes high-resolution 3D maps of their surface features. In centroid acquisition mode, the LCS determines the position of discrete target points on an object. The LCS was flight-tested on-board the space shuttle Discovery during mission STS-105 in August 2001. When the shuttle was docked on the International Space Station (ISS), the LCS was used to obtain four high-resolution 3D images of several station elements at ranges from 5 m to 40 m. A comparison of images taken during orbital day and night shows that the LCS is immune to the dynamic lighting conditions encountered on orbit. During the mission, the LCS also tracked a series of retro-reflective and Inconel targets affixed to the Multi-Purpose Lab Module (MPLM), when the module was stationary and moving. Analysis shows that the accuracy of the photosolutions derived from LCS centroid data is comparable to that of the Space Vision System (SVS), Neptec’s product presently used by NASA for ISS assembly tasks.
Keywords: Auto-synchronized laser scanner, space, 3D imaging, tracking
1. INTRODUCTION
The Neptec Design Group has developed a new 3D auto-synchronized laser scanner for space applications, based on a principle originally formulatedby the National Research Council of Canada1 (NRC). The scanner relates by triangulation the angles of two orthogonal scanning mirrors steering the laser beam in the field-of-view (FOV) (angular deflection variables U and V) and the peak position of the reflected laser beam on a linear detector array (variable P). The intensity of the reflected laser signal is also recorded (variable I).
The usefulness of the NRC laser scanner for space applications has been recognized early2. The main reason is its high degree of immunity against solar illumination. A thin-film interference filter acts as a narrow bandpass filter centered around the laser source wavelength so that the system literally “sees” only the light it emits. Furthermore, in the auto-synchronized design, the angle between the projection and collection paths is limited to a few degrees. This results in a small instantaneous FOV centered on the object and therefore less sensitive to background lighting conditions and sun interference. Another reason for which the NRC scanner is a good candidate for space applications is the simplicity of its design which makes it particularly well adapted for use in harsh conditions.
In 1999, Neptec licensed the NRC technology for space applications. During a period of 16 months, between January 2000 and May 2001, Neptec introduced significant changes to port the original laboratory scanner to the space environment. Changes included the selection of space-qualified components and of a thermally stable optical baseplate, detailed sensitivity analysis3, redesign of the largest scanning mirror, and overall repackaging of the unit to survive the harsh conditions of space. The result of these scientific and engineering efforts, Neptec’s Laser Camera System (LCS), was tested in August 2001 during mission STS-105 of space shuttle Discovery to the International Space Station (ISS). The LCS was fitted with an eye-safe 1500 nm laser source and a detector sensitive to infrared radiation between 700 nm and 1700 nm. The LCS source wavelength falls in a region of the spectrum where the radiation from the Sun is low which contributes further to the system’s immunity against solar interference4.
The main components of the LCS are shown in Figure 1. The LCS operates in two modes. In imaging mode, the LCS raster scans objects and saves the data as a grid of independent (U,V,P,I) voxels that are, after calibration5, transformed to X,Y,Z spatial coordinates and intensity data. These data can then be used to compute high-resolution 3D maps of the surface features of the scanned objects. In centroid acquisition mode, the LCS determines the position of discrete target points on an object. The LCS space operations were designed to test both modes. Results are presented in the next two sections.
Fig. 1: The main optical components of the LCS. Along the projection path, the laser beam exits the collimator (1) and reflects on the scanning X-mirror (2), the fixed projection side mirror (3) and the scanning Y-mirror (4) before reaching a target point. Along the collection path, the diffuse reflection from the target is collected on the scanning Y-mirror (5), reflects on the fixed collection side mirror (6) and the scanning X-mirror (7), is focused by the collecting lens and illuminates the detector.
2. IMAGING ISS ELEMENTS
The objectives of the imaging segment of mission STS-105 were: (1) to demonstrate that LCS is immune to the dynamic lighting conditions encountered in space and (2) to acquire 3D image data from a static scene. To aid in mission planning, a CAD predicted view of the scene was computed prior to flight (Figure 2).
During the mission, the LCS was sidewall mounted on the starboard adaptive payload carrier in Bay 3 AFT of space shuttle Discovery as shown in Figure 3. The laser power and the voxel sampling rate (charge-coupled device (CCD) integration time) were kept constant at 150 mW and 300 µs, respectively. From its fixed location, the LCS acquired automatically two FOV 2D images of 512x512 (U,V,I) pixels and four high-resolution 3D images of 1024x1024 (U,V,P,I) voxels. The FOV images were displayed on the LCS graphical user interface (GUI) to guide the user during target tracking. The high-resolution image data were saved for post-flight analysis. The four images covered the same scene but were offset by half a voxel spacing to allow for interleaving the data into a 2048x2048 image.
Fig. 2: CAD predicted view of ISS from LCS, with labeled targets.
2.1 2D Image processing
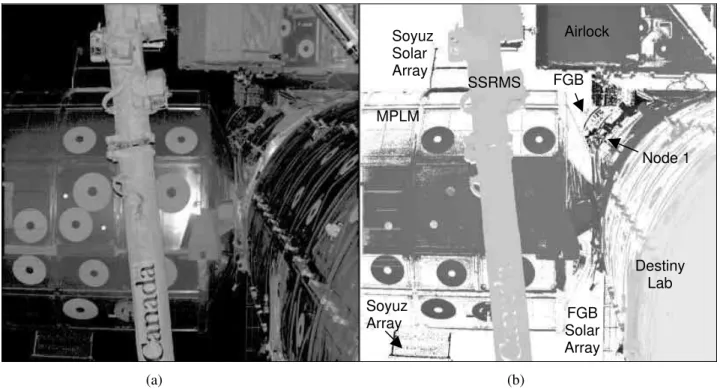
Data from the high-resolution 3D flight images were first examined using 2D intensity and range map representations as shown in Figure 4. Several ISS elements can be identifed in the figure: the Space Station Remote Manipulator System (SSRMS), the Destiny Lab Module, the Multi-Purpose Lab Module (MPLM), Node 1 (Unity), the Joint Airlock Module (Quest), the Zarya Control Module (FGB), and several solar arrays.
Figure 4a is an intensity map from one of the four high-resolution images of the test scene. In this figure, the intensity, I, recorded as a 13-bit number, has been interpolated to a regular (U,V) grid, and plotted using a 8-bit linear greyscale. Light grey is assigned to bright objects.
Figure 4b is the range map associated with the intensity data displayed in Figure 4a. In this figure, the range, has been computed from the peak position (range ∝ 1/P), interpolated to a regular (U,V) grid and plotted using a 8-bit linear greyscale. The closest objects are light grey, as seen in the lower right corner, and the furthest objects are black. White is assigned to points where no range or intensity data was measured. Approximately half of the points show no measured range or intensity, which happens when not enough reflected energy reaches the detector. This occurs when the projected laser beam impinges on specular surfaces at large incidence angles, or when it reflects on objects very far away.
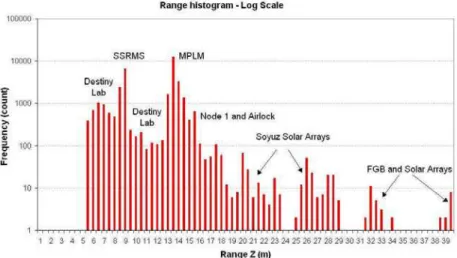
The histogram of Figure 5 shows the distribution of the range data from Figure 4b. A logarithmic scale is used to enhance lower count data. Coherent arrivals have been recorded from 5 m (Destiny Lab Module) to 40 m (FGB solar arrays). Most returns are from the SSRMS at a range between 8 m and 9 m, and from the MPLM at a range between 12 m and 15 m.
(a) (b)
Fig. 4: LCS images from the ISS: (a) intensity map (gamma corrected), (b) range map.
SSRMS Destiny Lab Airlock MPLM Soyuz Solar Array Soyuz Array FGB Node 1 FGB Solar Array
Fig. 5: Histogram of range data from Figure 4b.
Figure 6 shows intensity maps from two high-resolution images of the test scene. The image on the left was acquired entirely during orbital night whereas the image on the right was acquired entirely during orbital daylight. The images have been processed using identical adjustments to brightness, contrast and gamma. The figure also includes two greyscale intensity histograms showing the number of pixels at each grey level in the original images. For all practical purposes, the images are essentially identical, showing unequivocally that LCS imaging performance is unaffected by ambient lighting conditions on orbit.
2.2 3D Image processing
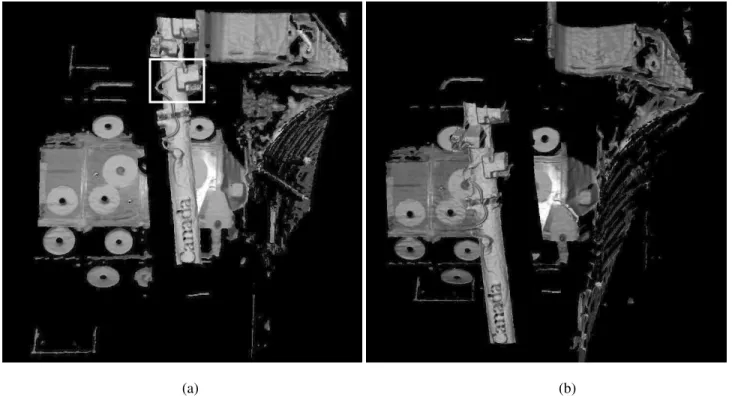
Surfaces were fitted to the individual data points to create models that exploits fully the three-dimensional nature of the LCS image data. Most data operations presented here used InnovMetric’s PolyWorks software package6. Figure 7 shows a 3D surface model of the complete ISS scene from two different view points. The rotated view in Figure 7b clearly shows the shadow of the SSRMS on the MPLM. This model was computed from 564266 raw data points and includes 356189 polygons.
(a) (b)
Fig. 7: 3D surface model of the ISS scene, (a) front view with box showing zoomed area of Fig. 8, (b) rotated view to show 3D properties of surface model.
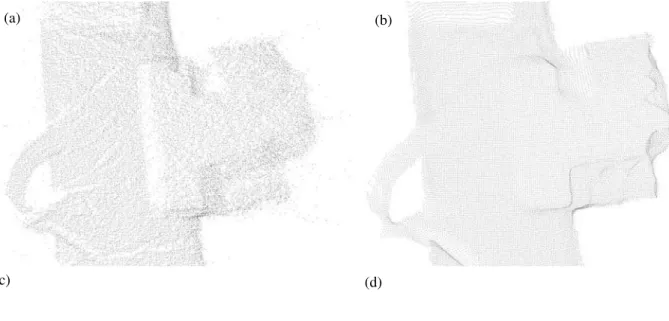
Figure 8 shows the progression of steps in the surfacing process7 for a zoomed region of interest of the SSRMS, delimited by a box in Figure 7a. The raw (U,V,P) point cloud data pertaining to the region of interest were first segmented out of the complete ISS scene (Figure 8a). These data were filtered to reduce range noise and interpolated to a regular (U,V) grid to reduce the scatter of the normals to neighbouring elements (Figure 8b). The data were then transformed to (X,Y,Z) spatial Cartesian coordinates using calibration parameters, interpolated to a regular (X,Y) grid to create a wireframe mesh (Figure 8c). The mesh was subsequently converted to a polygon surface model (Figure 8d). The surface sampling step was chosen to further smooth the surfaces and to keep the number of polygons manageable in order to allow a faster manipulation of the models and to reduce file size. The final model displayed using artificial lighting has a somewhat flat appearance (Figure 8e). Another approach tested superimposed both artificial lighting and the unfiltered measured intensities to enhance the viewer’s perception of 3D effects (Figure 8f).
Fig. 8: Generation of 3D surface models, (a) raw point cloud, (b) regular grid with filtered range, (c) wireframe mesh, (d) polygonized surface, (e) solid surface with artificial lighting effects, (f) solid surface with artificial lighting and measured intensities.
(a) (b)
(c) (d)
3. TRACKING TARGETS AFFIXED TO THE MPLM
The objectives of the target centroid acquisition segment of mission STS-105 were: (1) to demonstrate the LCS ability to track retro-reflective and Inconel targets on a static and moving object, and (2) to assess the accuracy of photosolutions based on LCS centroid data.
The LCS was pre-programmed to track, using Lissajous patterns, retro-reflective and Inconel targets affixed to the MPLM (Figure 2). The tracking strategy had been designed prior to flight to minimize the distance between targets and the number of transitions between target types. The CCD integration time was set at 20 µs for retro-reflective targets and at 900 µs for the Inconel targets to accommodate their difference in brightness. In total, 141 minutes of centroid data were acquired during two consecutive power-ups of the LCS. Retro-reflective target Las1 was successfully tracked at a rate of 250 Hz and Inconel targets MC_11A, MC_11B and MC_12 at a rate of 33 Hz.
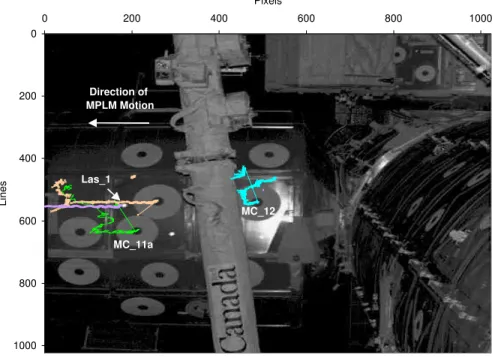
To assist in the interpretation of the data, a Centroid Plotting Spreadsheet Analysis Tool (CPSAT) was developed to determine the times and locations of the Lissajous patterns throughout the flight. The CPSAT8 overlays centroids on FOV images taken by the LCS in imaging mode. Figure 9 is the CPSAT display covering 12 minutes before and 8 minutes after the beginning of the MPLM demate operations. The figure captures the lateral motion of the MPLM as it was unberthed from the ISS. The LCS tracked Las1 until the target left the FOVand MC_12 until it passed beneath the SSRMS. Targets MC_11A and MC_11B were also tracked during several minutes.
0 200 400 600 800 1000 0 200 400 600 800 1000 Pixels Lines MC_12 Direction of MPLM Motion MC_11a Las_1
Fig. 9: CPSAT display for Las1, MC_11A, MC_11B and MC_12.
Neptec’s Space Vision System (SVS) is currently used by the National Aeronautics and Space Administration (NASA) for several ISS assembly tasks. The SVS photogrammetry algorithm9 computes photosolutions based on an analysis of 2D video images of arrays of cooperative targets.
Could the LCS be used as a front-end sensor for the SVS? The accuracy of photosolutions based on LCS centroid data was estimated by performing the following analysis. Statistics on the stability of LCS centroids were computed for a period of 2 minutes during which the MPLM was static for targets Las1 and MC_11B. Gaussian noise with the same characteristics was then added to the Airlock install array from mission STS-104, a typical SVS array. Table 1 lists the standard deviations of the corresponding photosolutions for all six degrees-of-freedom. For both the retro-reflective and the Inconel targets analyzed, the accuracy of the photosolutions based on LCS data is similar to that based on SVS data. This simulation indicates that the LCS could be a viable SVS sensor. The LCS would have the additional advantage of immunity against dynamic lighting conditions over video cameras.
Table 1: Standard deviations of LCS centroids and photosolutions.
Standard Deviations
LCS Centroids Photosolutions
X Y Z X Y Z Yaw Pitch Roll
Target Name Type
[mm] [mm] [mm] [mm] [mm] [mm] [deg] [deg] [deg] Las1 Retro 0.60 1.51 8.79 0.76 0.25 0.25 0.02 0.02 0.01 MC_11B Inconel 2.11 2.42 3.60 3.05 1.27 0.51 0.09 0.09 0.05
4. CONCLUSION
During mission STS-105, the LCS operations included several tasks to test the imaging and centroid acquisition modes of operations of the scanner. In both modes, the LCS performed very well operationally and recorded high-quality data. Although several orbital day/night transitions occurred during the operations, it did not affect the LCS performance, clearly demonstrating its high degree of immunity to dynamic lighting conditions.
The high-resolution data acquired in imaging mode could be presented as crisp and detailed 2D intensity and range maps, and further processed into 3D surface models. A project is presently ongoing at Neptec to add to the LCS the automatic capability of varying laser power and/or CCD integration time, and to estimate the percentage of valid returns from a given scene. These additional functionalities would enable to LCS to image very challenging scenes, for example, highly specular surfaces which might otherwise saturate the detector, without requiring human intervention.
The centroid data were stable and accurate enough so that the viability of the LCS as a front-end SVS sensor could be demonstrated. Present work is focussing on extending the tracking capability to natural features of objects hence removing the need for cooperative targets.
REFERENCES
1. M. Rioux, “Laser range finder based on synchronized scanners,” Applied Optics 23(21), pp. 3837-3844, 1984. 2. F. Blais, M. Rioux, and S. G. Maclean, “Intelligent, variable resolution laser scanner for the Space Vision System,”
Acquisition, Tracking and Pointing V, SPIE 1482, pp.473-479, 1991.
3. C. Samson, I. Christie, J.-A. Beraldin, and F. Blais, “Neptec 3D Laser Scanner for Space Applications: Impact of Sensitivity Analysis on Mechanical Design,” Opto-Canada 2002, submitted.
4. S. L. Valley, Handbook of Geophysics and Space Environments, p.206, McGraw Hill, New York, 1965. 5. J.-A. Beraldin, S.F. El-Hakim, and L. Cournoyer, “Practical Range Camera Calibration,” Videometrics II,
SPIE 2067, pp. 21-31, 1993. 6. http://www.innovmetric.com
7. C. E. English, C. Samson, I. Christie, F. Blais, L. Cournoyer, and M. Picard, “Production of Models of the International Space Station Elements from 3D Laser Images,” Opto-Canada 2002, submitted.
8. A. Deslauriers, C. Samson, I. Christie, and F. Blais, “Tracking Targets on the International Space Station using a Laser Scanner,” Opto-Canada 2002, submitted.
9. R. C. Hughes, “Enhanced Single Camera Photogrammetry Algorithms for Real-Time Control Applications,” Proc. Commission V Symposium, ISPRS, “Real-Time Photogrammetry – A New Challenge”, Ottawa, Canada, 1986.