Publisher’s version / Version de l'éditeur:
Canadian Journal of Chemical Engineering, 69, 1991
READ THESE TERMS AND CONDITIONS CAREFULLY BEFORE USING THIS WEBSITE.
https://nrc-publications.canada.ca/eng/copyright
Vous avez des questions? Nous pouvons vous aider. Pour communiquer directement avec un auteur, consultez la
première page de la revue dans laquelle son article a été publié afin de trouver ses coordonnées. Si vous n’arrivez pas à les repérer, communiquez avec nous à [email protected].
Questions? Contact the NRC Publications Archive team at
[email protected]. If you wish to email the authors directly, please see the first page of the publication for their contact information.
NRC Publications Archive
Archives des publications du CNRC
This publication could be one of several versions: author’s original, accepted manuscript or the publisher’s version. / La version de cette publication peut être l’une des suivantes : la version prépublication de l’auteur, la version acceptée du manuscrit ou la version de l’éditeur.
Access and use of this website and the material on it are subject to the Terms and Conditions set forth at
Studies on hydrophilic polysulfone ultrafiltration membranes
Tremblay, A. Y.; Tam, C. M.; Guiver, Michael; Dal-cin, M. M.
https://publications-cnrc.canada.ca/fra/droits
L’accès à ce site Web et l’utilisation de son contenu sont assujettis aux conditions présentées dans le site LISEZ CES CONDITIONS ATTENTIVEMENT AVANT D’UTILISER CE SITE WEB.
NRC Publications Record / Notice d'Archives des publications de CNRC:
https://nrc-publications.canada.ca/eng/view/object/?id=b2c3eff0-bafb-48e6-95e7-7f9784182886 https://publications-cnrc.canada.ca/fra/voir/objet/?id=b2c3eff0-bafb-48e6-95e7-7f9784182886
Studies on Hydrophilic Poly sulfone Ultrafiltration Membranes
zyxwvutsrqponmlkjihgfedcbaZYXWVUTSRQPONMLKJIHGFEDCBA
A .
zyxwvutsrqponmlkjihgfedcbaZYXWVUTSRQPONMLKJIHGFEDCBA
Y.
TREMBLAY,C.
M. TAM, M. D. GUIVER and M . M. DAL-CINInstitute for Environmental Chemistry, National Research Council, Montreal Road, Ottawa, Ontario, Canada KIA OR6
Ultrafiltration membranes were produced from carboxylated polysulfone polymers having different degrees of sub- stitution (DS). Solute separation was found to increase with increasing DS. The techniques of single solute permeation and permoporometry were used to determine the pore size of these membranes. Permoporometry measurements indi- cated that pore size decreased with increasing DS. Solute separation was predicted by inserting the distribution of pore sizes obtained from permoporometry into a restricted transport model. Similar results were obtained from a nonlinear least squares fit of the restricted transport model to the experimental data. Both techniques produced similar sieving curves. It was concluded that pore size decreases were not due to the increasing repulsion of solute molecules by hydrophilic polysulfone but to changes in polymer solution properties as the DS increased.
On a produit des membranes d’ultra-filtration B partir de polymttres de polysulfone carboxylisCs ayant differents degrCs
zyxwvutsrqponmlkjihgfedcbaZYXWVUTSRQPONMLKJIHGFEDCBA
de substitution (DS). On a trouvC que la sCparation de solutC augmentait avec I’augmentation du DS. Des techniquesd’impkgnation et de permoporomCtrie avec des solutCs simples ont CtC utilisCs pour dCterminer la taille des pores de ces membranes. Les mesures de permoporomCtrie indiquent que la taille des particules diminuent avec I’augmentation du DS. On a prCdit la sCparation du solutC en intkgrant la distribution de taille des pores obtenue par la permoporomCtrie dans un modttle de transport restreint. Des rksultats similaires ont CtC obtenus par calage par moindres carrCs non IinCaires du modkle de transport restreint aux donnCes expkrimentales. Les deux techniques produisent des courbes de tamisage comparables. On a conch que la diminution de la taille des pores n’est pas due B une augmentation de la repulsion
des mol6cules de solutC par le polysulphone hydrophilique mais B des modifications des proprietts des solutions de
polymttres lorsque le DS augmente.
Keywords: carboxylated polysulfones, hydrophilic polysulfones, ultrafiltration membranes, permoporometry ,
zyxwvutsrqponmlkjihgfedcbaZYXWVUTSRQPONMLKJIHGFEDCBA
restricted transport model.olysulfones are a family of high performance thermo-
P
plastics with excellent oxidative, thermal and hydrolytic stability as well as good mechanical and film forming proper- ties. This desirable combination of properties and their avail- ability sees polysulfones widely used in the manufacture of commercial membranes. Despite obvious advantages, poly- sulfones have certain drawbacks. Their hydrophobic nature is a limitation for membranes for separating low molecular weight solutes in aqueous systems. Hydrophobic properties are often cited as a reason for the protein fouling of membranes(eg. Dillman and Miller,
zyxwvutsrqponmlkjihgfedcbaZYXWVUTSRQPONMLKJIHGFEDCBA
1973). The versatility of polysulfonesis increased when their physio-chemical nature is modified. Directed lithiation of polysulfones has been demonstrated by Guiver et al. (1988) to be a useful modification method. This general technique can be used to introduce a wide var- iety of functional groups onto the poly sulfone backbone with
good control over the degree of substitution
zyxwvutsrqponmlkjihgfedcbaZYXWVUTSRQPONMLKJIHGFEDCBA
(DS).
Conse-quently, with the addition of an appropriate functional group,
the properties of polysulfones can be modified. Guiver et al.
zyxwvutsrqponmlkjihgfedcbaZYXWVUTSRQPONMLKJIHGFEDCBA
(1990) reported on the chemistry and properties of carboxylated polysulfone derivatives made using the process of directed metalation. Reverse osmosis membranes made from this material have already been described by Guiver et al. (1989). The present paper will focus on the properties of ultrafiltra- tion membranes made from carboxylated polysulfones.
The purpose of this paper is to determine the effect of the degree of substitution of carboxylated polysulfone on mem- brane separation. The characterization of membranes using a restricted transport model and permoporometry is described.
Theory
RESTRICTED TRANSPORT MODEL
A standard restricted transport model based on steric solute-membrane interactions was used to estimate membrane
NRCC No. 32929.
7.0 z= 8
zyxwvutsrqponmlkjihgfedcbaZYXWVUTSRQPONMLKJIHGFEDCBA
p = r / R p h=Rs/Rp
zyxwvutsrqponmlkjihgfedcbaZYXWVUTSRQPONMLKJIHGFEDCBA
1”
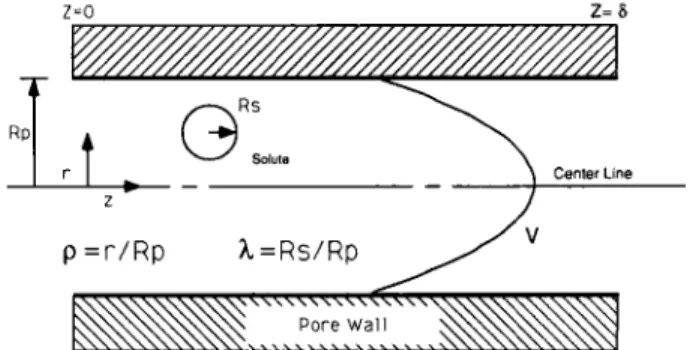
Figure 1 - Transport of a probe solute through a narrow capillary.
pore size. The derivation of this model is given by Anderson and Quinn (1974) and Tremblay (1989). The active separa- tion layer of a membrane is represented by an array of capil- laries of cylindrical cross-section. Two simplifying assumptions are used in the derivation of this model. First, the solvent inside the pore is assumed to form a continuous phase; therefore the usual equations of continuum mechanics are applicable. Second, the physio-chemical interactions between the membrane material and probe solutes are assumed to be negligible. The restricted transport model only accounts for steric interactions in evaluating membrane pore size. The transport of solute through a membrane pore is represented schematically in Figure 1 .
Estimates of membrane pore size can be obtained by
relating solute separation
zyxwvutsrqponmlkjihgfedcbaZYXWVUTSRQPONMLKJIHGFEDCBA
0 ,
test conditions and stericparameters to standard fluid transport equations. Solute sepa- ration, as a function of A, (the ratio of solute radius
(Rs)
to pore radius ( R p ) ) is given by,(1)
f(A) = 1
-
( x / [ 1 - exp(-Pe)(l-
x)])
. . .
where Pe is the pore Peclet number defined as follows,
(2)
Pe = (x(V)6)/(tDm) . . .
. . .
.. . .
. . .
(V)
is the average velocity within the pore.zyxwvutsrqponmlkjihgfedcbaZYXWVUTSRQPONMLKJIHGFEDCBA
zyxwvutsrqponmlkjihgfedcbaZYXWVUTSRQPONMLKJIHGFEDCBA
6 is the lengthof the membrane pore.
zyxwvutsrqponmlkjihgfedcbaZYXWVUTSRQPONMLKJIHGFEDCBA
4
is the ratio of restricted diffusivityof the solute in the pore (D) and the bulk diffusivity of the
solute in solution (D,).
zyxwvutsrqponmlkjihgfedcbaZYXWVUTSRQPONMLKJIHGFEDCBA
x
is a global steric parameterassociated with restricted convective transport within the pore.
Both
4
andx
are global parameters determined from the integration of functions that are dependent on h and the radial position of the solute across the pore (p).6
andx
are defined as follows,4
= DID, = [ 2 p K - ‘ ] d p. . .
(3)zyxwvutsrqponmlkjihgfedcbaZYXWVUTSRQPONMLKJIHGFEDCBA
zyxwvutsrqponmlkjihgfedcbaZYXWVUTSRQPONMLKJIHGFEDCBA
0
x
= [ 4 p (1 - p 2 ) G ] dp. . .
(4)zyxwvutsrqponmlkjihgfedcbaZYXWVUTSRQPONMLKJIHGFEDCBA
K - ’ is the local enhanced friction term. G describes the local lag coefficient which accounts for the retarding effect of the pore wall. A summary of transport parameters obtained from various sources has been reviewed by Deen (1989).
Bungay and Brenner (1973) derived numerical values of
4
andx
for a sphere translating through a quiescent fluid. These values were used throughout this work since they are validfor a broad range of
zyxwvutsrqponmlkjihgfedcbaZYXWVUTSRQPONMLKJIHGFEDCBA
A, (0 I hc
zyxwvutsrqponmlkjihgfedcbaZYXWVUTSRQPONMLKJIHGFEDCBA
1).The average pore size of a membrane can be estimated by performing a regression on the restricted transport model using experimentally obtained separation data. In this work, the criteria of the minimum sum of squares of residuals was used to determine average pore sizes.
PERMOPOROMETRY
Permoporometry , including the bubble point and mercury intrusion method, is a well documented technique for charac- terizing porous materials. The bubble point method using air to displace water in membrane pores is widely used to characterize microfiltration membranes. The surface tension of the air-water interface is too great in order to characterize the smaller pores of ultrafiltration membranes. Two immis- cible liquids, having a lower surface tension, can be used in this case. This method was used by Bechold et al. (1931),
Erbe (1935) and Grabar and Nikitine (1936) for analyzing the pore size and pore size distribution of microfilters. The technique, as applied to ultrafiltration membranes, is described in detail by Capannelli et al. (1983) and Kesting
(1985).
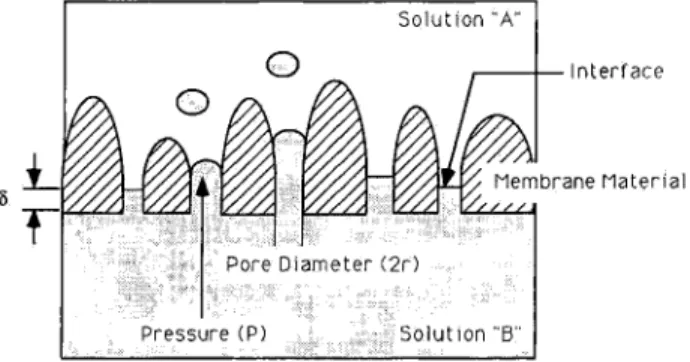
In this method, a fluid “A”, which completely wets the membrane is used to fill the pores. A second fluid “B”, immiscible in the former, is then permeated through the membrane. The trans-membrane pressure is measured at var- ious permeate flowrates. This process is represented in Figure 2. The pore size and the pore size distribution can be obtained by using Cantor’s equation.
Cantor’s equation relates the pressure drop across a capil- lary (AP) to the surface tension (a) and the radius (r) of the capillary,
...
hp = 2uIr
zyxwvutsrqponmlkjihgfedcbaZYXWVUTSRQPONMLKJIHGFEDCBA
( 5 )Membranes have a distribution of pore sizes ranging from
Rmin to R,,,
.
The pressure required for the immiscible fluid (“B”) to flow through the largest pore is given by,Mmin = 2a/Rmx
...
(6) S o l u t i o n “ A ”I
,J-
I n t e r f a c e brane M a t e r i a l 6f
Figure 2 - Description of permoporometry.
As the pressure of “B” is increased, smaller pores are avail- able for permeation. When the permeate rate becomes proportional to pressure, all the fluid “A” in the pores has been displaced by “B”. At this point the smallest pores
(Rmin) are contributing to flow. Therefore,
. . .
Urn,, = 201 Rmin (7)
The pore size distribution can be determined graphically (Kesting (1985)) from a plot of permeation rate as a func- tion of pressure or numerically (Capannelli et al. 1983). The numerical version of this technique was used in this study. Experimental
Udel P-3500 polysulfone was obtained from Amoco Per- formance Products and used as the starting material in all carboxylations. Carboxylic acid polysulfone derivatives with a
DS
of 0.25, 0.46, 0.60, 0.70 and 1.06 were prepared as previously described by Guiver et al. (1990). A DS of 0.0refers to the unmodified Udel polymer. The value of
DS
for modified polymers was determined using ‘H-NMR. The solvent, 1 -methyl-2-pyrrolidinone (NMP), was obtained from Aldrich and used as received.Ultrafiltration membranes made from Udel polysulfone were cast from 20 weight percent solutions of polymer in NMP. Since the repeat units of the modified polymers had different molecular weights, casting solutions were made up to have the same mole ratio of polymer to solvent as the 20 weight percent Udel solution. Polymer solutions at room tem- perature were cast on a glass plate using a doctor blade having a 250 pm gap. The cast solutions were gelled directly into de-ionized water at 0°C. Membranes were left in fresh water for 24 hours to remove all traces of solvent.
Membrane testing procedures for determining molecular weight cut-off curves have been previously described by Hazlett et al. (1989). Ultrafiltration experiments were per- formed in cross-flow test cells having a 508 pm gap using a feed flowrate of 3 L/min which provided a cross-flow velocity of 0.85 mls. These thin channel ultrafiltration test cells had an effective surface area of 10.75 X m2. All test runs were performed at an operating pressure of
275.8 kPa. The probe solutes were polyethylene glycols (PEG) of various molecular weights obtained from Fluka. Gel permeation chromatography was used to verify that the PEG’S used in this work had a narrow molecular weight dis- tribution. Feed concentration for all characterization runs was 200 mg/L. Feed and permeate concentrations were deter- mined using an automated Beckmann Total Organic Carbon analyzer. A period of 24 hours was required to perform a series of characterization tests.
100
zyxwvutsrqponmlkjihgfedcbaZYXWVUTSRQPONMLKJIHGFEDCBA
Figure 3 - Solute separation vs.
zyxwvutsrqponmlkjihgfedcbaZYXWVUTSRQPONMLKJIHGFEDCBA
molecular weight for various DS of carboxylated polysulfone.__---
Calculated from a least squares fit of the restricted transport model to the separation data.Calculated using permoporometry data.
+
zyxwvutsrqponmlkjihgfedcbaZYXWVUTSRQPONMLKJIHGFEDCBA
DS = 1.06.zyxwvutsrqponmlkjihgfedcbaZYXWVUTSRQPONMLKJIHGFEDCBA
A DS = 0.60.
zyxwvutsrqponmlkjihgfedcbaZYXWVUTSRQPONMLKJIHGFEDCBA
0 DS = 0.00.
Details of the porosimeter are given in Capanelli et al. (1988). The main components of the porosimeter used in this work were: a Waters 590 programmable HPLC pump, pres- sure transducer (Validyne model P305D), data acquisition system (CHROM card from Metrabyte) and an IBM- compatible computer. The computer functioned as a data logger and controller. Isobutanol, methanol and ultrapure water were mixed in a volume ratio of 15:7:25. This mix- ture separated into two stable phases. The aqueous phase of this solution, defined as “A”, was used to fill the membrane pores. The alcohol phase, “B” , was introduced at various flowrates to obtain the membrane pore size. Capanelli et al. (1988) reported the surface tension of the non-aqueous phase
to be
zyxwvutsrqponmlkjihgfedcbaZYXWVUTSRQPONMLKJIHGFEDCBA
3.5 x Pa * m and a viscosity of 3.4 mPa-
s (at20°C).
Results
Molecular weight cut-off experiments were performed on membranes made from six polysulfones each having different degrees of substitution. The results of three membranes having a
DS
of 0.0, 0.6 and 1.06 are plotted in Figure 3. Solute separation was found to increase with higherDS
values.
The average pore size for each membrane listed in Table 1 was calculated from the restricted transport model. These pore sizes, generated from the separation data, decrease with increasing degree of substitution. Model predictions of the separation using pore sizes obtained from solute permeation was plotted as a dashed line in Figure 3.
40
t
1 10 too
Pore
Radius
(nm.)
Figure 4 - Membrane pore s u e distribution obtained from permo- porometry
.
TABLE 1
Average Pore Size of Membranes with Different Degree of Substitution Calculated Using the Restricted Transport Model and
from Permoporometry
Average Pore Average Pore Degree of Radius from Radius from Substitution Probe Solutes (nm) Permoporometry (nm)
0.00 13.08 15.4 0.25 6.94 - 0.46 5.14 - 0.60 4.86 3.77 0.70 3.82
-
I .06 3.37 2.44Figure 4 shows the pore size distribution of the same membranes generated by permoporometry. The average pore size of these membranes are given in Table 1. As observed from Figure 4 and Table 1 the average pore size decreases as the
DS
increases. The pore size distributions obtained from the porosimetry experiments were used to predict solute sepa- rations with the restricted transport model. These results have been plotted as solid lines in Figure 3.Discussion
Membrane morphology and solute-membrane material interactions are two major factors affecting solute separa- tion and permeation. The addition of carboxylic acid groups onto the polysulfone back-bone changes the solution and sur- face properties of the polymer. The significance of interfa- cial effects could be determined if it were possible to produce membranes having exactly the same pore size from different polymers. However, when the polymer structure is changed,
solution properties are also altered. This could result in the production of membranes of having different pore sizes.
In order to decouple these two effects, independent methods were used to characterize membranes produced
from polymers having various
DS.
zyxwvutsrqponmlkjihgfedcbaZYXWVUTSRQPONMLKJIHGFEDCBA
The permeation of solu-tions containing probe solutes through membranes is a stan-
dard characterization technique. The separation data
zyxwvutsrqponmlkjihgfedcbaZYXWVUTSRQPONMLKJIHGFEDCBA
obtainedwith this technique reflects the influences of solute-membrane material interactions and pore size. The technique of per- moporometry generates a pore size distribution which is independent of solute-membrane material interactions. Com- paring the pore sizes obtained with these two methods can therefore verify the assumption of minimal material inter- actions advanced in the restricted pore flow model.
The dashed lines in Figure 3 represents least squares predictions of the restricted transport model to the separa- tion data based on a single average pore size. The solid lines in Figure 3 were produced by inserting the pore size distri- bution obtained with permoporometry into the restricted transport model. The fit is excellent considering the per- moporometry curve is based on a distribution of pore sizes and that of the probe solute is based on a single pore size. These results indicate that, compared to the restricted diffu-
sion and convection contributions, the effects of
zyxwvutsrqponmlkjihgfedcbaZYXWVUTSRQPONMLKJIHGFEDCBA
PEG-poly sulfone material interactions on solute separation are negligible with respect to solute transport. They also indi- cate that increases in solute separation are due to a physical decrease in membrane pore size.
Changes in the polymer solution properties with the addi- tion of carboxylate groups is a probable explanation for the reduction of membrane pore size. As the
DS
is increased, the polymer is more hydrophilic and the polymer’s affinity for NMP decreases. This increases the exchange rate ofNMP
and water during the gelation process thereby changing gelation dynamics. This results in increased membrane separation.Conclusion
Increasing the degree of substitution of carboxylated poly- sulfone produced membranes having smaller pores for the same casting solution concentration. For unmodified polymer, a pore size of 13.08 nm was obtained, while car- boxylated polymer having a
DS
of 0.60 and 1.06 had a pore size of 4.86 run and 3.37 nm respectively. This behavior was attributed to an increased rate of solvent exchange during the gelation process.Two methods of membrane characterization, solute perme-
ation and permoporometry
,
zyxwvutsrqponmlkjihgfedcbaZYXWVUTSRQPONMLKJIHGFEDCBA
were used to evaluate membranepore size. Solute permeation results were analyzed by a res- tricted transport model based on negligible solute-membrane material interactions. Both methods predicted similar pore sizes for a given membrane thus confirming the assumptions made in the restricted transport model. This simple model adequately represents the transport of solute through poly-
sulfone ultrafdtration membranes and provides a realistic esti- mate of membrane pore size. The model is useful for fitting membrane sieving curves and provides a quantitative measure
of
pore size instead of the qualitative value of molecular weight cut-off.Nomenclature
D = diffusivity of solute in the pore (m2/s)
D, = diffusivity of solute in solution (m2/s)
DS
= degree of substitutionf
=
zyxwvutsrqponmlkjihgfedcbaZYXWVUTSRQPONMLKJIHGFEDCBA
K - ‘ = G = Pe = r = (V, = Greek 6 =zyxwvutsrqponmlkjihgfedcbaZYXWVUTSRQPONMLKJIHGFEDCBA
A =zyxwvutsrqponmlkjihgfedcbaZYXWVUTSRQPONMLKJIHGFEDCBA
E
=
z = P = a =zyxwvutsrqponmlkjihgfedcbaZYXWVUTSRQPONMLKJIHGFEDCBA
x
=
A P = separationlocal enhanced friction term local lag coefficient Peclet number
radial position of solute in pore (m)
velocity inside the pore (m/s) pore axial direction (m)
length of the membrane pore (m) ratio of solute size to pore size
ratio of restricted diffusion within the pore to free diffusion in bulk solution
radial position across the pore (m) surface tension (Pa
.
m)global steric parameter
pressure drop across the pore (kPa)
References
J. L. Anderson and J. A. Quinn, “Restricted Transport in Small Pores”, Biophysical Journal 14, 140-150 (1974).
V. H. Bechold, M. Schlesinger, and K. Sibereisen, “Porenweite von Ultrafiltern”, Colloid Zeitschrift 55, 172-198 (1931). P. M. Bungay and H. BreMer, “The Motion of Closely Fitting
Sphere in a Fluid-Filled Tube”, Int. J. Multiphase Flow 1,25-56 (1973).
G. Capannelli, F. Vigo and S . Munari, “Ultrafiltration Membranes
- Characterization Methods”, J. Membrane Sci. 15, 289-313 (1983).
G. Capannelli, I. Becchi, A. Bottino, P. Moretti and S . Munari, “Computer Driven Porosimeter for Ultrafiltration Membranes”, in Characterization of Porous Solids, K. K. Unger, J. Rouquerol, K. S. W. Sing and H. Kral, Eds., Elsevier, Amsterdam (1988), W. M. Deen, “Hindered Transport of Large Molecules in Liquid
Filled Pores”, AIChE J. 33, 1409-1425 (1987).
W. J. Dillman, Jr. and 1. F. Miller, “On the Adsorption of Serium Proteins on Polymer Membrane Surfaces”, J . Colloid Interface Sci. 44, 221-241 (1973).
V. F. Erbe, “Die Bestimmung der Porenverteilung nach ihrer GroRe in Filtern and Ultrafiltern”, Colloid Zeitschrift 63, 277-285
(1935).
P. Grabar and S. Nikitine, “Sur le diamkre des pores des mem- branes en collodion utilishs en ultrafiltration”, J. Chem. Phys. M. D. Guiver, J. ApSimon, and 0. Kutowy, “The Modification of Polysulfone by Metalation”, J. Polym. Sci. Polym. Lett. Ed. M. D. Guiver, A. Y. Tremblay, and C. M. Tam, “Reverse Osmosis Membranes from Novel Hydrophilic Polysulfones”, in Advances in Reverse Osmosis and Ultrafiltration, T. Matsuura and S . Sourirajan, Eds., NRCC NO. 29895, Ottawa (1989), pp. 53-72. M. D. Guiver, S. Croteau, J. D. Hazlett and 0. Kutowy, “Syn- thesis and Characterization of Carboxylated Polysulfones” , Br. Polym. J. 23, 29-39 (1990).
J. D. Hazlett, 0. Kutowy and T. A. Tweddle, “Commercial Ultrafiltration Membrane Performance Evaluation”, in Proceedings of 2nd International Conference on Separations Science and Technology: Hamilton, Ontario, Canada, M. H. I. Baird and S . Vijayan, Eds., Canadian Society for Chemical Engineering, Ottawa (1989), pp. 65-74.
R. E. Kesting, Synthetic Polymeric Membranes, John Wiley &
Sons, New York (1985), pp. 46-81.
A. Y. Tremblay, “The Role of Structural Forces in Membrane
Transport: Cellulose Membranes”, Ph.D. Thesis, University of
Ottawa (1989).
Manuscript received December 4, 1990; revised manuscript received April 1, 1991; accepted for publication April 5, 1991.
pp. 283-295.
33, 721-741 (1936).
26, 123-127 (1988).
-