HAL Id: hal-02066244
https://hal.laas.fr/hal-02066244
Submitted on 13 Mar 2019
HAL is a multi-disciplinary open access
archive for the deposit and dissemination of
sci-entific research documents, whether they are
pub-lished or not. The documents may come from
teaching and research institutions in France or
abroad, or from public or private research centers.
L’archive ouverte pluridisciplinaire HAL, est
destinée au dépôt et à la diffusion de documents
scientifiques de niveau recherche, publiés ou non,
émanant des établissements d’enseignement et de
recherche français ou étrangers, des laboratoires
publics ou privés.
Power source evaluation of a wireless power transfer
system
Guillaume Vigneau, Mohamed Cheiklh, R Benbouhout, Said Bouguer,
Alexandru Takacs
To cite this version:
Guillaume Vigneau, Mohamed Cheiklh, R Benbouhout, Said Bouguer, Alexandru Takacs. Power
source evaluation of a wireless power transfer system. IEEE Wireless Power Transfer Conference,
May 2014, Jeju, South Korea. 4p., �10.1109/WPT.2014.6839615�. �hal-02066244�
Power Source
Guillaume Vigneau
1, 2, 3, Mohamed Che
Benbouhout
1, Said Bouguer
1 Continental Automotive SAS FrToulouse, France
1 firstname.lastname@continental-corpo
Abstract—With more than 230 products on st estimation of 100 million wireless power devi (IHS source), the wireless power market is Moreover, current smartphones are us applications (music streaming, satellite navigat NFC virtual key for car sharing) and thus a supply system is required. This paper addre modeling and characterization of this power so Power Transfer context by an original mod good correlation between measurement a obtained both for electrical (e.g. input imped and electromagnetic (e.g. magnetic field) qu simulations performed on commercial softwar simulation/measurement shows a difference o active power available on the load and the m the magnetic field corroborates with the measu
Index Terms — Wireless power transfer, i
electromagnetic modeling, electronic ci automotive systems, power budget
I. INTRODUCTION
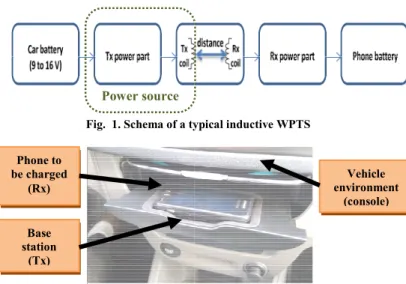
oday, there are more and more applica wireless. Wirelessly powering nomad phones, cellular phone, personal compu etc.) seems to be a very smart and ergonom implement a wireless powering system th three approaches: reactive near-field coupli resonant) [2]-[3], far-field directive power far-field nondirective power transfer [5]. In the interoperability between wireless power by different manufacturers, organizations Power Consortium (WPC) [6], the Power (PMA) [7] or the Alliance for Wireless Powe been established. The Wireless Power Conso power standard (named “Qi”) for providing compliant receiver, with specific recommendations [6]. A classical Wireles System (WPTS) is illustrated in Fig. 1. Th between the transmitter (Tx) and the receive using coupled coils separated by a distance coupling factor (k) [9]. For automotive appli supply is the car’s battery whereas the nomadic electronic system. A possible appl in vehicle is illustrated in Fig. 2.
T
Evaluation of a Wirele
Transfer System
eikh
1, Rachid
rn
1 rance oration.comAlex
2 CNRS, LAAS, 7 a To 3 Université de To Totore shelves and an ices in use by 2015 s rapidly growing. sed with several
tion system or even a convenient power esses the complete ource in a Wireless deling approach. A
and simulation is dance, power, etc.) uantities. Through re’s, the correlation of only 2% on the modeled behavior of ured one. inductive coupling, ircuit simulation, N ations qualified of d objects (smart uter, GPS system, mic solution [1]. To here are basically ing (inductive and beaming [4] and order to guarantee r devices designed like the Wireless r Matter Alliance er (A4WP) [8] has ortium made a low up to 5 Watts to a designs and s Power Transfer he power transfer er (Rx) is made by e (d) and having a ications, the power load could be a lication embedded
Fig. 1. Schema of a ty
Fig. 2. Illustration of a WP
This paper proposes a new characterize our WPTS. It is cr an industrial product to perfo WPTS. The simulation/theoreti along the design and the op industrial product (before Consequently, the correlatio measurement is analyzed all ov different results allowing us simulation model.
II. ELECTROMAG
CHARACTERIZATION OF
As shown in Fig. 1, the couple the WPTS. Two types of W modeled using the commerc Software & Systems - S.A). parameters were measured compared to the simulation resu Most of WPTS uses two types Litz wires [10] or on a Printed Litz wires are a special type of currents (consisting of multi significantly reduce the loss proximity effects, Litz coils ha
Base station (Tx) Phone to be charged (Rx) Power source
ess Power
andru Takacs
2, 3avenue du colonel Roche, 31400 oulouse, France
oulouse, UPS, LAAS, 31400 oulouse, France
ypical inductive WPTS
PTS in a vehicle environment
w approach to model and to rucial in a development phase of orm a realistic modeling of the ical models are intensively used timization process of such an e the final prototyping).
on between simulation and ver this study to corroborate the
to validate and fine-tune our
GNETIC MODELING AND THE TRANSCEIVER COILS
ed coils are an important part of WPTS coils were designed and
cial field solver FEKO (EM . The electrical and magnetic on prototyped samples and ults.
s of coil technologies, based on Circuit Board (PCB) [11]-[12]. f cable used to carry alternating iple strands) and designed to ses. Due to the reduction of ave usually a good quality factor
Vehicle environment
(around 100). The PCB coils are made by strips with an appropriate shape directly on major advantages are an easy fabrication pr price compared to Litz coils. But the main d lower quality factor (around 15) and dissipation than Litz technology. Litz and respectively named as “A6” and “B5” in t designs used here [13]. A magnetic pe (ferrite) positioned on the coils’ backs imp and coupling (between two coils) factors. T used as shielding against the undesired magn behind the coils and protects the transm circuitry of electromagnetic interferences.
A. Electromagnetic modeling and char techniques
The electromagnetic simulations were perfor using the Method Of Moments (MoM Equivalence Principle (VEP) and Low stabilization techniques on a twenty-nod cluster. Meshing is a critical point in al simulations, defining how precisely Maxwe solved by using a finite elements disc geometry. For example on the B5 design, th are totally meshed with 2590 triangles and for the ferrite (triangle and tetrahedron are re mesh metallic surfaces and dielectric volum mesh is a good trade-off between the a simulation time. The four coils are impleme strips and the ferrite (thickness: 2.2 mm magnetic permeability of 800 and a magnet 0.00008 (the same ferrite will be used all ove The Litz wires of A6 coils were modeled a wire of equivalent radius and the ferrite is one used for the B5 PCB coils.
To validate the electromagnetic modeling a with ferrite on the back have been prototype Fig. 3. Their inductance (L) and Equivalent (ESR) are measured through an impedan magnetic field is measured with a H-field m H/E field meter ESM-100) at different distan
B. Electrical parameters of coils
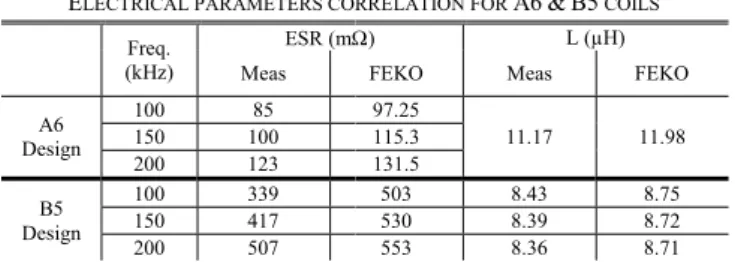
The simulated and measured electrical param L and equivalent series resistance ESR) are p Litz and PCB coils in the Table I. To com results between modeling and experimentat parameters are extracted at different frequenc 200 kHz).
Fig. 3. Schematic of Tx coils assembly coupled w
y printing metallic the PCB, and the rocess and a lower drawbacks are the higher thermal d PCB Coils are the Qi low power ermeable material proves the quality This ferrite is also netic field emitted mitter’s electronic
racterization
rmed in FEKO by M) with Volume
Frequency (LF) des (CPU cores) ll electromagnetic ell’s equations are cretization of the
he four PCB coils d 882 tetrahedrons espectively used to mes). The adopted accuracy and the ented with copper m) has a relative
tic loss tangent of er this study). as a unique copper
the same than the accuracy, the coils ed as shown on the Series Resistance nce analyzer. The meter (Maschek 3D
nces of the coils.
meters (inductance presented for both mpare the different tion, the electrical cies (100, 150 and
with the Rx system
We can observe a relative good and measured results. Measu values are very close over the As expected, coils’ ESR is high structures. However the corre of the ESR is better with PC models have been simplified w copper wire instead of a s strands). A correction factor based on the analytical comput are predominant at such low f the realistic case (105 strands o equivalent radius used by the 0.55 mm). The results depicted correction factor. With this correlation between simulation and B5 structures and for bot The small differences betwee results can be explained by the simulation model/approach at such a complex geometry.
C. Magnetic field of coils
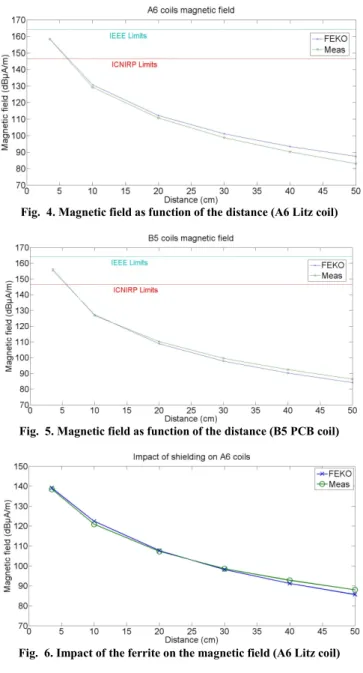
A WPTS exploiting the near fi magnetic field to transfer ener main step in the wireless powe paper is the magnetic field cha with reference exposure limits the close proximity of persons the region where the produ restrictions on Electro-Magn ICNIRP [14] or IEEE C95.1 example, ICNIRP 2010 Guid level of 21 A/m for the magn advises a maximum permissi head/torso and 900 A/m for lim In this study the magnetic field operating at 110 kHz with a c the coils (both for A6 and B current needed in a 5 Watts WP simulated (FEKO) and measu distances for the B5 PCB and shielding impact on the magn Supposing that the coil under t the horizontal plane (e.g. “xy” on a vertical axis (Oz) betwe center of the coil and the meas note a good correlation betwee and the curves follow
TAB ELECTRICAL PARAMETERS COR
Freq. (kHz) ESR (mΩ Meas A6 Design 100 85 150 100 200 123 B5 Design 100 339 150 417 200 507
d correlation between simulated ured and simulated inductance
e chosen/operating frequencies. her for PCB (B5) than Litz (A6) elation simulation/measurement CB than Litz coils because Litz within FEKO through a unique several strands structure (105
of c = 1.801 was established tation of the ohmic losses (they frequencies) taking into account of radius r = 0.004 mm) and the e simulation model (radius r = d in Table I take into account the
correction, we obtain a good n and measurement for both A6
th ESR and inductance values. en simulation and experimental e accuracy issues of the adopted such low frequencies and for
s
field inductive coupling uses the rgy from a coil to another. So a er source study described in this aracterization and its compliance s. This is a critical point due to
inside the car. Independently of uct will be implanted, basic netic Field (EMF) limits of .2005 [15] are applicable. For delines recommend a reference netic field strength while IEEE ible exposure of 163 A/m for mbs.
d is generated by a power source current of 1 A rms injected into B5 designs), that is the typical PTS. Fig. 4 and Fig. 5 show the ured magnetic field at different d A6 Litz coils while the ferrite netic field is depicted in Fig. 6. test (A6 or B5) is positioned in plane), the distance is measured en the geometrical (symmetry) suring (or simulating) point. We en measurement and simulation
BLEI
RRELATION FOR A6&B5 COILS
Ω) L (µH)
FEKO Meas FEKO
97.25 11.17 11.98 115.3 131.5 503 8.43 8.75 530 8.39 8.72 553 8.36 8.71
Fig. 4. Magnetic field as function of the distance (A6 Litz coil)
Fig. 5. Magnetic field as function of the distance (B5 PCB coil)
Fig. 6. Impact of the ferrite on the magnetic field (A6 Litz coil)
the same trend for each case. The correlation is lower for large distances (> 40 cm) where the magnetic field is weak and subject to noise and field distortions leading to measurement uncertainties. Fig. 6 illustrates the ferrite impact on the magnetic field. Experimental and simulation curves show that the magnetic field is lower with 20 dBµA/m at 3 cm (A6 design) on the bottom side of the ferrite compared with the value measured on the top side of the Tx coil proving thus the shielding effect of the ferrite. The distance measured here (Fig. 6) is always on Oz axis but the measuring/simulation point is situated below the ferrite.
Concerning the EMF limits, Fig. 4 and Fig. 5 show that the radiated magnetic field is below the levels imposed by both IEEE and ICNIRP recommendations for the two coils (A6 and B5) for a distance greater than 7 cm.
Theoretical magnetic moments of the A6 (Litz wire) and B5 (PCB) models are estimated using the following formula:
∑
. . ..√ (1)
Where:
is the magnetic moment, N the number of samples (between the distance of d(1) = 0.5 m to d(6) = 1 m from coils with a step of 0.1 m), the magnetic field at i, μ the magnetic permeability and P the reactive power into the coil.
At long distances (over than 50 cm), the PCB coils generates slightly higher fields than A6 Litz. The estimated magnetic moments of B5 and A6 coils are respectively 0.0148 A.m²/√ and 0.0132 A.m²/√ .
III. WPTSCIRCUIT SIMULATIONS AND CORRELATION WITH MEASUREMENTS
The electronic architecture of our power source has been designed, simulated and prototyped. It will be illustrated only with A6 Litz coils results because the same electronic architecture is used for B5 coils. The power source is coupled with a Qi compliant receiver, following the schematic presented in Fig. 1, for a delivered power of 5 Watts to the external load.
A. Modeling and measurement setup
The proposed modeling and simulation approach is based on the use of the commercial electronic circuit simulator Orcad PSPICE (Cadence Design System, Inc.) to model the complete WPTS (including transmitter and receiver circuitry). To provide a global simulation approach, the coils (Transmitter Tx and Receiver Rx) are defined as coupled coils characterized by their inductances Lp (primary: Tx coil) and Ls (secondary: Rx coil) and the coils’ coupling factor (k). The coupling factor (k) is given by the following formula:
k
UU LL (2)where Up and Us are respectively the voltages across the input ports of the primary (Tx) and secondary (Rx) coils while Lp and Ls are the Tx and Rx coils’ inductances. Measured values are taken into account in (2).
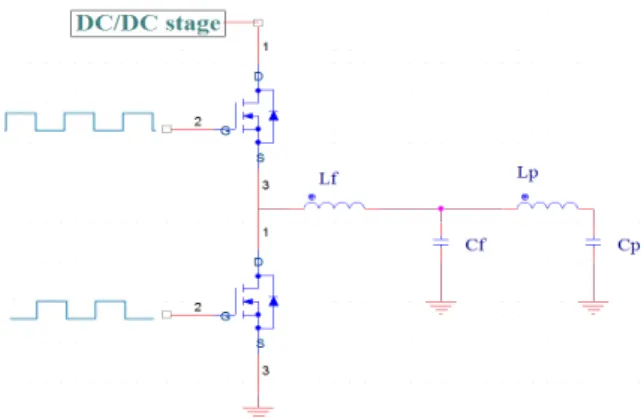
The transmitter used (homemade product) is also compliant with the Qi A6 design. According to the Fig. 7, it consists of a DC-DC conversion stage (not represented here) connected to the DC-AC stage linked up to the resonant LC circuit through a low pass filtering formed by the inductance (Lf) and the capacitance (Cf).
The DC-AC conversion uses a class-D power amplifier realized by a half bridge inverter (2 transistors) which drives the primary coil (Lp, transferring the energy to the receiver’s secondary coil) and the system is matched with the resonant capacitor (Cp) in order to improve the power transfer.
Due to automotive applications, the energy supplying the power transmitter comes from the car’s battery. A DC-DC conversion stage is included in order to regulate the DC power supplying the inverter and thus the amount of power transmitted to the receiver. SPICE models were used (transistors, diodes, etc.) and driving circuits were
Fig. 7. Tx SPICE electronic circuit of the WPTS
implemented in order to make a complete transient study with specific logical driving signals. The primary Tx coil employed here has an inductance of Lp = 11.25 µH and an ESR of 0.1 Ω with a coupling factor k = 0.53. The receiver is compliant with the Qi TPR#5 architecture [13] and uses a Litz coil to receive power from the transmitter.
In the simulation setup, the components’ values and coupling factor are implemented in the circuit. The following results are given with the Tx coil coupled to the Rx coil, for a transferred power of 5 Watts on the load.
B. Simulation and measurement results
First, the correlation between SPICE simulation (Tx model of the Fig. 7) and experimental results was investigated by analyzing the transient waveforms correctness (waveforms represented in Fig. 8). Secondly, the active power available across the transmitter coil is computed (average value over one period of the product between instantaneous voltage and current).
As shown in Fig. 8, a very good correlation for the simulated and measured waveform was obtained. The peak to peak measured voltage is 31.89 V (current: 4.41 A) while the peak to peak simulated voltage is 33.26 V (current: 4.41 A). The effective (rms) voltage, current and the power available on the Tx coil were extracted from the simulated and measured curves and are summarized on the Table II. A good correlation (close to 2%) between theoretical modeling and experimental measurement validates the proposed circuit simulation approach.
IV. CONCLUSION
This paper addresses the full characterization of a wireless power source, compliant with a Qi WPTS, from a simulation and measurement’s point of view. Electromagnetic simulation models were used for the coils while circuit simulation was adopted for the driving electronic circuitry. Electrical parameters of modeled coils and the radiated magnetic field are well recovered by the measurements despite of the use of simplified electromagnetic models motivated by time simulation issues. The emitted magnetic fields are below the limits imposed by ICNIRP or IEEE standards for a distance beyond of 7 cm. The impact of ferrite shielding is well reproduced by the proposed simulation model. A correlation between simulation and experimental results close to 2% demonstrates the accuracy of the adopted simulation approach for the driving electronic circuitry. Thus the proposed modeling and simulation approach can be an useful tool for an efficient design and optimization of an effective WPTS.
REFERENCES
[1] Z. D. Chen, S. Kawasaki and N. B. Carvalho, “Wireless power transmission—The last cut of wires…,” IEEE Microwave Magazine, vol. 14, n°2, pp. 22-24, March/April 2013.
[2] B. W. Flynn and K. Fotopoulou, “Rectifying loose coils wireless power transfer in loosely coupled inductive links with lateral and angular misalignment,” IEEE Microwave Magazine, pp. 48-54, March/April 2013.
[3] I. Mayordomo, T. Dräger, P. Spies, J. Bernhard and A. Pflaum, “An overview of technical challenges and advances of inductive wireless power transmission,” Proc. of the IEEE, vol. 101, no. 6, June 2013. [4] R. M. Dickinson, “Power in the sky requirements for microwave
wireless power beamers for powering high-altitude platforms,” IEEE Microwave Magazine, pp. 36-47, March/April 2013.
[5] Z. Popovic, “Cut the cord low-power far-field wireless powering,” IEEE Microwave Magazine, pp. 55-62, March/April 2013.
[6] www.wirelesspowerconsortium.com [7] www.powermatters.org/
[8] www.a4wp.org/
[9] E. Waffenschmidt, “Wireless power for mobile devices,” Philips Research Europe.
[10] J. Muhlethaler, “Modeling and multi-objective optimization of inductive power components,” Ph.D. dissertation, Swiss Federal Institute of Technology Zurich (ETHZ), 2012
[11] U-M. Jow and M. Ghovanloo, “Design and optimization of printed spiral Coils for efficient transcutaneous inductive power transmission,” IEEE Trans. on Biomedical Circuits and Systems, vol. 1, no. 3, Sep 2007. [12] S. C. Tang, S. Y. R Hui, and H. Chung, “Coreless planar
printed-circuit-board (PCB) transformers – A fundamental concept for signal and energy transfer,” IEEE Trans. Power Electron., vol. 15, no. 5, pp. 931-941, Sep. 2000.
[13] “System description wireless power transfer,” Version 1.1.1, Wireless Power Consortium, July 2012.
[14] “ICNIRP Guidelines for limiting exposure to time-varying electric and magnetic fields (1 Hz – 100 kHz),” Health physics 99(6):818-836; 2010 [15] “C95.1-2005 – IEEE standard for safety levels with respect to human exposure to radio frequency electromagnetic fields, 3 kHz to 300 GHz”
TABLEII
CORRELATION BETWEEN ELECTRONIC MEASUREMENTS AND SIMULATIONS Voltage (Vrms) Current (Arms) Active power (W)
Measurement 10.61 1.46 6.57
Simulation 11.17 1.5 6.43
Correlation (%) 5.01 2.67 2.18
Fig. 8. Voltage and current waveforms (measured and simulated) on the Tx coil