Cellulose-Pectin Spatial Contacts Are Inherent to
Never-Dried Arabidopsis Primary Cell Walls: Evidence
from Solid-State Nuclear Magnetic Resonance
The MIT Faculty has made this article openly available. Please share how this access benefits you. Your story matters.Citation Wang, Tuo, Yong Bum Park, Daniel J. Cosgrove, and Mei Hong. “Cellulose-Pectin Spatial Contacts Are Inherent to Never-Dried Arabidopsis Primary Cell Walls: Evidence from Solid-State Nuclear Magnetic Resonance.” Plant Physiol. 168, no. 3 (June 2, 2015): 871-884.
As Published http://dx.doi.org/10.1104/pp.15.00665 Publisher American Society of Plant Biologists
Version Author's final manuscript
Citable link http://hdl.handle.net/1721.1/105323
Terms of Use Creative Commons Attribution-Noncommercial-Share Alike Detailed Terms http://creativecommons.org/licenses/by-nc-sa/4.0/
1
Running Head:
1 2
Cellulose-Pectin Contacts in Never-Dried Primary Walls
3 4
Revised for Plant Physiology 5
6
Co-Corresponding authors: 7
8
Daniel Cosgrove, Department of Biology, Pennsylvania State University, University Park, PA 9
16802; email: dcosgrove@psu.edu, Tel: (814) 863-3892. 10
11
Mei Hong, Department of Chemistry, Massachusetts Institute of Technology, 170 Albany Street, 12
Cambridge, MA 02139; email: meihong@mit.edu, Tel: 617-253-5521. 13 14 15 16 17 18
2
Cellulose-Pectin Spatial Contacts Are Inherent to Never-Dried
19
Arabidopsis thaliana Primary Cell Walls: Evidence from Solid-State
20
NMR
1 2122
Tuo Wang, Yong Bum Park, Daniel J. Cosgrove*, Mei Hong* 23
24
Department of Chemistry, Massachusetts Institute of Technology, 170 Albany Street, Cambridge, 25
MA 02139 (TW, MH); Department of Biology, Pennsylvania State University, University Park, 26 PA 16802 (YBP, DJC) 27 28 29 One-sentence summary: 30 31
Solid-state NMR of never-dried Arabidopsis primary cell walls at ambient temperature
32
demonstrate that sub-nanometer pectin - cellulose contacts are an inherent feature of cell walls.
33 34 35
3
Footnotes
36 37
1 This work was supported by the Center for Lignocellulose Structure and Formation, an 38
Energy Frontier Research Center funded by the U.S. Department of Energy, Office of Science, 39
Basic Energy Sciences under Award # DE-SC0001090. The 900 MHz spectra were measured at 40
the MIT/Harvard Center for Magnetic Resonance, which is supported by NIH grant EB002026. 41
42
* Address correspondence to dcosgrove@psu.edu and meihong@mit.edu 43
44 45
The author responsible for distribution of materials integral to the findings presented in this 46
article in accordance with the policy described in the Instructions for Authors 47
(www.plantphysiol.org) is: Daniel J. Cosgrove (dcosgrove@psu.edu). 48
49
TW and YBP performed the experiments; all authors contributed to the experimental design 50
and data interpretation; DJC and MH conceived and supervised the project; TW wrote the first 51
article draft; all authors contributed to the writing. 52
53 54
4 55
Abstract
56 57
The structural role of pectins in plant primary cell walls is not yet well understood due to 58
the complex and disordered nature of the cell wall polymers. We recently introduced 59
multidimensional solid-state nuclear magnetic resonance (SSNMR) spectroscopy to characterize 60
the spatial proximities of wall polysaccharides. The data showed extensive cross peaks between 61
pectins and cellulose in the primary wall of Arabidopsis thaliana, indicating sub-nanometer 62
contacts between the two polysaccharides. This result was unexpected because stable pectin-63
cellulose interactions are not predicted by in-vitro binding assays and prevailing cell-wall models. 64
To investigate whether the spatial contacts that give rise to the cross peaks are artifacts of sample 65
preparation, we now compare never-dried Arabidopsis primary walls with dehydrated and 66
rehydrated samples. 1D 13C spectra, 2D 13C-13C correlation spectra, water-polysaccharide 67
correlation spectra, and dynamics data, all indicate that the structure, mobility, and 68
intermolecular contacts of the polysaccharides are indistinguishable between never-dried and 69
rehydrated walls. Moreover, a partially depectinated cell wall in which 40% of 70
homogalacturonan (HG) is extracted retains cellulose-pectin cross peaks, indicating that the 71
cellulose-pectin contacts are not due to molecular crowding. The cross peaks are observed both 72
at -20˚C and at ambient temperature, thus ruling out freezing as a cause of spatial contacts. These 73
results indicate that rhamnogalacturonan I and a portion of HG have significant interactions with 74
cellulose microfibrils in the native primary wall. This pectin-cellulose association may be formed 75
during wall biosynthesis and may involve pectin entrapment in or between cellulose microfibrils, 76
which cannot be mimicked by in-vitro binding assays. 77
78 79
5 Abbreviations: 80 Arabinose: Ara, A 81 Cell wall: CW 82 Galactose: Gal 83
Galacturonic acid: GalA, GA 84
Glucose in Xyloglucan: G 85
Homogalacturonan: HG,HGA 86
Interior crystalline cellulose: i 87
Surface amorphous cellulose: s 88
Rhamnogalacturonan I: RGI 89
Rhamnogalacturonan II: RGII 90 Rhamnose: Rha, R 91 Xyloglucan: XyG 92 Xylose: Xyl, x 93 Cross polarization: CP 94 Direct polarization: DP 95
Magic-angle spinning: MAS 96
solid-state NMR: SSNMR 97
13C-1H dipolar order parameter: SCH 98
Proton-driven spin diffusion: PDSD 99
Heteronuclear correlation: HETCOR 100
Dipolar-edited medium- and long-distance: MELODI 101
Dipolar chemical-shift: DIPSHIFT 102
103 104
6
Introduction
105
Despite decades of research, many aspects of the three-dimensional structure of the primary 106
cell walls (CW) of eudicotyledons and non-commelinid monocotyledons remain uncertain 107
because of the insoluble, amorphous and complex nature of CW polymers and their tight 108
interactions in muro (Jarvis, 1992; Cosgrove, 2005). Unlike massively-crosslinked bacterial cell 109
walls, non-covalent interactions between polysaccahrides play major structural roles in plant 110
CWs (Albersheim et al., 2011). Our concepts of the arrangement and interactions of cellulose, 111
hemicellulose and pectins in the CW have largely been shaped by electron microscopy and by 112
chemical or enzymatic dissections, approaches that are limited in their abilty to resolve specific 113
noncovalent interactions or that result in considerable perturbation of native CW structures 114
(McCann et al., 1990; Talbott and Ray, 1992; Carpita and Gibeaut, 1993). Recently, 2D and 3D 115
SSNMR techniques have been applied to study the three-dimensional architecture of plant CW 116
polysaccharides (Dick-Perez et al., 2011; Dick-Perez et al., 2012; Wang et al., 2014). The 117
SSNMR experiments detect polysaccharide conformation, mobility and sub-nanometer inter-118
atomic contacts, and the measurements were done on CW samples that were minimally perturbed 119
from the native state. Interestingly, the 2D and 3D 13C correlation spectra showed clear cross 120
peaks between cellulose and rhamnose or galacturonic acid residues of pectic polysaccharides. 121
Together with molecular dynamics simulations (Matthews et al., 2006; Zhao et al., 2014) 122
enzymatic and biomechanical analyses (Park and Cosgrove, 2012a, 2012b), these data led to a 123
revised concept of the CW architecture in which cellulose makes physical contact with both 124
xyloglucan and pectins and in which CW extensibility is controlled at limited biomechanical 125
‘hotspots’ where multiple microfibrils come into close contact (Cosgrove, 2014). This new 126
model contrasts with the prevailing tethered network model, which depicts a scaffold of cellulose 127
microfibrils tethered by xyloglucans and embedded in a separate but co-extensive gel-like phase 128
made of pectin (Carpita and Gibeaut, 1993; Somerville et al., 2004; Cosgrove, 2005). Additional 129
SSNMR data demonstrated that expansins target limited sites in the CW with altered cellulose 130
conformation and enriched xyloglucan content (Wang et al., 2013), sites that are very similar to 131
the hypothesized biomechanical ‘hotspots’ (Park and Cosgrove, 2012b). 132
133
Despite these advances, the structural roles of pectins in the CW remain puzzling and 134
unresolved. The major pectic polysaccharides include homogalacturonan (HG), 135
rhamnogalacturonan I (RGI) and rhamnogalacturonan II (RGII) (Caffall and Mohnen, 2009). 136
Neutral pectins, including arabinans and galactans, are found as side chains of RGI and possibly 137
as free polymers. RGII units are cross linked by borate diesters that influence the strength and 138
porosity of primary cell walls (Ishii and Matsunaga, 1996; Fleischer et al., 1999). Some pectins 139
may be covalently linked to arabinogalactan proteins (Tan et al., 2013) or xyloglucan (Popper 140
and Fry, 2008; Cornuault et al., 2014), but the prevalence and structural significance of such 141
hybrid molecules remain to be determined. Early extraction studies of a number of plant cell 142
walls showed that pectic polysaccharides remained with cellulose in the unextracted residue 143
(Ryden and Selvendran, 1990; Goodneratne et al., 1994). But these results were not accounted 144
for in traditional CW structural models (Cosgrove, 2001), which depict pectins as a relatively 145
compliant gel-like network in which the cellulose-xyloglucan network is embedded. In this view, 146
interactions between the two networks are limited to polymer entanglements and do not include 147
extensive non-covalent interactions. Supporting this model are in-vitro binding studies that 148
indicate negligible affinity between pectins and cellulose, in contrast to the high affinity between 149
xyloglucan and cellulose (Zykwinska et al., 2005; Zykwinska et al., 2008). The recent 2D and 150
7
3D SSNMR spectra showed a significant number of cross peaks between cellulose and pectins 151
(Dick-Perez et al., 2011; Dick-Perez et al., 2012), indicating that some of the pectic sugars come 152
into sub-nanometer contact with cellulose. While NMR cross peaks report inter-atomic distances 153
and not binding energies, the cross peaks nevertheless suggest that significant interactions exist 154
between cellulose and some of the pectins. Such interactions, if true, would disagree with the in-155
vitro binding assays but would be consistent with the early extraction results.
156 157
An unexpected result such as this one naturally meets with skepticism and a search for 158
alternative explanations. One possibility is that the preparation of the first CW samples, which 159
included washing with ethanol and other organic solvents followed by air drying and rehydration, 160
might have caused pectins to precipitate irreversibly onto cellulose and other wall components, 161
thus giving rise to artificial spatial contacts between different polymers. A second possibility is 162
that the intermolecular contacts result from molecular crowding of the wall polymers rather than 163
specific interactions stabilized by hydrogen bonding, van der Waals interactions or other non-164
covalent interactions (Cosgrove, 2014). Binding assays indicate that neutral arabinan and 165
galactan sidechains of RGI moderately bind cellulose in vitro (Zykwinska et al., 2005; 166
Zykwinska et al., 2008), leading to the proposal that pectic sidechains may function as structural 167
linkers between cellulose microfibrils (Zykwinska et al., 2007; Peaucelle et al., 2012). Although 168
the mechanical significance of pectins was not confirmed by experiments in which wild-type 169
Arabidopsis cell walls were subjected to pectin-loosening treatments, pectins assumed a larger
170
mechanical role in xyloglucan-deficient cell walls (Park and Cosgrove, 2012a). 171
172
In this work, we investigate the nature of the pectin-cellulose contacts in greater depth by 173
carrying out SSNMR experiments on a new set of CW samples that allows us to assess the 174
effects of sample preparation, hydration history, temperature, and polysaccharide density on the 175
cellulose-pectin spatial contacts. We prepared Arabidopsis primary cell walls that were never 176
dried throughout the sample preparation. We show that 13C chemical shifts, intra- and 177
intermolecular cross peaks, segmental order parameters and nuclear spin relaxation times are 178
indistinguishable between the never-dried and rehydrated walls. Difference 2D spectra (Wang et 179
al., 2015) that suppress intramolecular cross peaks are obtained that better reveal the 180
intermolecular cross peaks between cellulose and pectins. Variable-temperature experiments 181
show that cross peaks persist at ambient temperature, thus ruling out artifactual interaction by 182
freezing. Finally, a partially HG-extracted cell wall retains cellulose-pectin correlation peaks, 183
indicating that molecular crowding is not the main cause of the intermolecular contacts. Taken 184
together, these data indicate that cellulose-pectin spatial proximity is an intrinsic feature of the 185
never-dried primary cell wall, and some of the pectins may be entrapped within or between
186 cellulose microfibrils. 187 188 Results 189
We first compared the never-dried CW#1 with a previous sample, CW#4, which was 190
prepared from a different batch of plant material, washed with organic solvents, air-dried and 191
rehydrated (Table 1). CW#4 was used for measuring the previously published 2D and 3D 192
spectra (Dick-Perez et al., 2011; Wang et al., 2012). As we show in Supplemental Fig. S1, the 193
quantitative 13C direct-polarization (DP) spectra of CW#4 have significantly higher pectin and 194
glycoprotein signals than CW#1, indicating that the different seedlings and wall isolation 195
methods used in the two preparations cause different wall compositions. In 2D 13C correlation 196
8
spectra, both samples show cellulose-pectin correlation peaks (Fig. S2), with CW#4 having 197
moderately higher cross-peak intensities, consistent with its higher pectin content. Given the 198
different wall compositions between CW#1 and CW#4, it is difficult to compare the effects of 199
dehydration on wall structure, thus we took the same batch of plant material as CW#1, 200
dehydrated it to produce sample CW#2, then rehydrated it to give sample CW#3 (Table 1). 201
202
1D 13C and 1H NMR spectra of never-dried and rehydrated cell walls
203
We first examined the effects of lyophilization and rehydration on the structure and 204
dynamics of wall polysaccharides by comparing the quantitative 13C DP spectra of cell walls #1, 205
#2, and #3 (Fig. 1a). The never-dried CW#1 exhibits many sharp pectin peaks such as the 53.7-206
ppm peak of methyl esters (full width at half maximum = 0.38 ppm), the 21.2-ppm peak of acetyl 207
(0.81 ppm), the 17.6-ppm peak of Rha C6 (0.68 ppm) and the 79.7-ppm peak of GalA C4 and 208
Rha C2 (0.70 ppm). Lyophilization (CW#2) severely broadened all these peaks, giving 209
linewidths of ~8 ppm for the methyl ester peak and ~9 ppm for the acetyl group, indicating that 210
water removal traps a broad distribution of conformations in these pectins. The loss of dynamic 211
bulk water is confirmed by the 1H spectrum (Fig. 1b). In comparison, the cellulose linewidths are 212
less perturbed by drying: the 89-ppm interior cellulose C4 (iC4) peak increased its linewidth 213
from 2.9 ppm to 3.8 ppm, and the 65-ppm iC6 linewidth is also only moderately broadened by 214
lyophilization. The relative stability of cellulose linewidths under dehydration is analogous to the 215
insignificant broadening of cellulose peaks by freezing to cryogenic temperatures (Wang et al., 216
2013), and indicates that the conformational rigidity of cellulose microfibrils renders their NMR 217
linewidths significantly independent of environmental changes. 218
219
When water is added back (CW#3), the 13C DP spectrum is fully restored to the never-220
dried state, with similarly narrow pectin peaks. Thus, the conformations and hydrogen bonding 221
of polysaccharides are reversible after rehydration, suggesting that the average polysaccharide 222
structure in the dried CW is similar to that of the never-dried wall. The resumption of the narrow 223
pectin linewidths also means that the broad conformational distribution of pectins in the dry wall 224
is present in the never-dried wall but they interconvert rapidly to give narrow linewidths at 225
motionally averaged chemical shifts. In other words, polysaccharides with narrow linewidths due 226
to dynamic averaging in the hydrated wall should manifest broad linewidths in the dehydrated 227
wall. 228
229
To assess if polysaccharide mobilities are affected by hydration history, we measured 13C 230
cross-polarization (CP) spectra (Fig. 2a) and DP spectra with short recycle delays (Fig. 2b). The 231
former preferentially enhance the signals of immobile polymers while the latter preferentially 232
detect mobile polysaccharides. The never-dried CW#1 and the rehydrated CW#3 have identical 233
intensity distributions and linewidths in both the CP and DP spectra, indicating that these two 234
samples have identical distributions of mobile and rigid molecules. For example, the short-235
recycle-delay DP spectra exhibit strong and narrow pectin carbonyl signals (165 - 180 ppm), 236
arabinose C1 peak (108-ppm), GalA and Rha peaks (100, 80, 69 and 17 ppm), the methyl ester 237
peak and the acetyl peak. 238
239
Pectin-cellulose spatial contacts from 2D 13C-13C correlation NMR spectra
240
To investigate whether the cellulose-pectin cross peaks reported previously (Wang et al., 241
2012) were caused by irreversible collapse of the polysaccharides during dehydration, we 242
9
measured the 2D 1H-driven 13C-13C spin diffusion (PDSD) spectrum of the never-dried CW#1 243
with a long mixing time of 1.5 s and compared it with the spectrum of the rehydrated CW#3 (Fig. 244
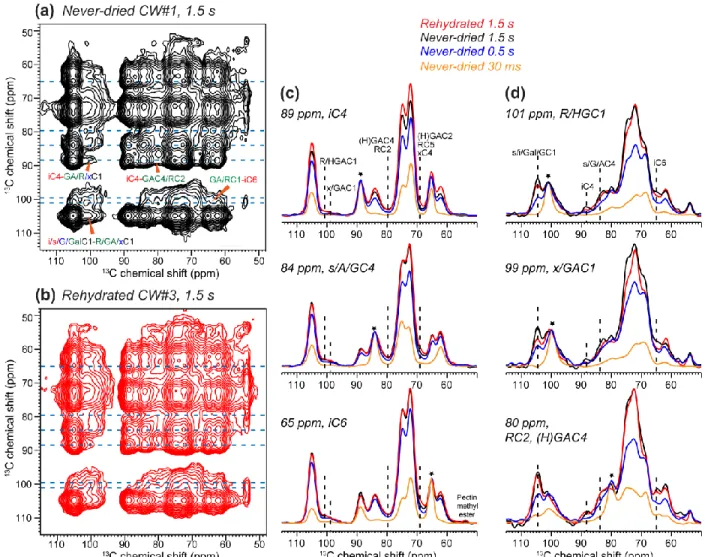
3). The CW#1 2D spectrum is remarkably similar to that of CW#3, with multiple cellulose -
245
pectin cross peaks such as the iC6-HG/RC1 cross peak at (65, 101) ppm and the iC4-HG/RC1 246
peak at (89, 101 ppm). The 2D spectra have asymmetric cross-peak intensities around the 247
diagonal: in the F1 - F2 frequency dimensions, the cellulose - pectin cross peaks are higher than 248
the pectin - cellulose cross peaks. This results from the higher CP intensities and slower T1 249
relaxation of cellulose compared to pectins. Fig. 3c, d show key cellulose and pectin cross 250
sections. In the 89-ppm and 65-ppm cross sections of interior crystalline cellulose and the 84-251
ppm cross section of surface cellulose, XyG backbone, and arabinose C4, unambiguous pectin 252
cross peaks such as the 101-ppm peak of Rha and HG C1 and the 80-ppm peak of GalA C4 and 253
Rha C2 are detected at mixing times longer than 500 ms. Cross peaks to mixtures of 254
hemicellulose and pectin signals, such as the 99-ppm peak of Xyl and GalA C1 and the 69-ppm 255
peak of GalA C2, Rha C5 and Xyl C4, are also observed. Conversely, the pectin cross sections 256
exhibit well-resolved cross peaks to cellulose iC4 and iC6. The pecin-cellulose cross peaks have 257
relatively high signal-to-noise ratios of 10-35. The never-dried CW#1 (black) and rehydrated 258
CW#3 (red) show similar intensities for the pectin-cellulose cross peaks within experimental 259
uncertainty, indicating that lyophilization and rehydration have negligible impact on the spatial 260
proximities between the closely packed cellulose and pectins. 261
262
The 2D spectra in Fig. 3 contain both intermolecular and intramolecular correlation 263
signals. To better distinguish these two types of cross peaks, we measured a difference 2D 264
spectrum (Wang et al., 2015) of CW#4 by subtracting two PDSD spectra with mixing times of 265
1.0 s and 0.2 s. In the resulting difference spectrum (Fig. 4a), intermolecular cross peaks 266
manifest as positive intensities while intramolecular cross peaks such as iC4-iC6 are removed. 267
Both cellulose-pectin cross peaks and surface-interior cellulose cross peaks expected for the 268
microfibril structure are clearly observed in the difference spectrum. Examples are iC4-R/HGC1 269
(89, 101 ppm), iC4-RC2/GAC4 (89, 80 ppm) and iC6-R/HGC1 (65, 101 ppm) peaks. 270
271
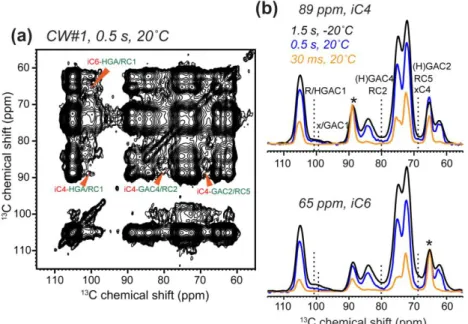
The 2D spectra in Figs. 3 and 4 were measured at -20˚C where pectins were immobilized. 272
To test whether the cross peaks indicative of close spatial contacts are an artifact of sample 273
freezing, we measured 2D PDSD spectra at ambient temperature. Fig. 5 shows that cellulose-274
pectin cross peaks remain at 20˚C, albeit with slightly lower intensities than at low temperature 275
due to the mobility of pectins at high temperature, which weakens the dipolar couplings that 276
drive magnetization transfer. Thus, the close proximity between cellulose and pectins is present 277
at ambient temperature, and the mild freezing in the SSNMR experiments does not perturb the 278
wall structure. 279
280
Polysaccharide mobilities in never-dried and rehydrated cell walls
281
To investigate whether dehydration and rehydration perturb polysaccharide mobility, we 282
quantified the motional amplitudes and rates by measuring the 13C-1H dipolar order parameters 283
(SCH) and 13C T1 relaxation times. Supplemental Fig. S3 shows that the C-H dipolar dephasing 284
curves (Munowitz et al., 1981; Huster et al., 2001) are identical between the never-dried CW#1 285
and rehydrated CW#3 within experimental uncertainty. Fitting the dipolar decay curves yielded 286
the bond order parameters, SCH (Fig. 6a). For both cell walls, the SCH values are the largest for 287
cellulose (~0.9) and the lowest for pectins (~0.5), indicating that pectins have the largest 288
10
motional amplitudes. No significant difference is observed between the two samples, indicating 289
that rehydration resumes the same polysaccharide mobilities as the never-dried wall. Similarly, 290
13C T1 relaxation times (Fig. 6b-c, Fig. S4) are preserved between the never-dried and 291
rehydrated walls, indicating that the nanosecond-timescale motions are similar between the two 292
samples. 293
294
The 13C-T1 relaxation times can be used to determine the motional heterogeneity in each 295
wall polymer, which cannot be determined in the DIPSHIFT experiment, which reports only the 296
averaged bond order parameters. Cellulose generally exhibits single-exponential decays with 297
long relaxation times of ~5 s, while matrix polysaccharides have double-exponential decays with 298
equal contribution of a short component (~0.3 s) and a long T1 component (~4.5 s) (Tables 2, 3). 299
Interior cellulose C6 (iC6) also has a fast-relaxing component with low population (~15%), 300
which is likely caused by the influence from the surrounding pectins. The double-componential 301
behavior is best seen in the pectin data, which show a distinct transition at ~0.5 s between the 302
initial fast decay and the later slow decay. To assess if the matrix polysaccharides contain a third 303
relaxation component that bridges the mobile and rigid portions, we fit the data using a triple-304
exponential function. However, the resulting fits show large uncertainties in either the T1 values 305
or the fractions, or do not have sufficient differences in the T1 values of the mobile and 306
intermediate components (Table S1). Thus, there is no compelling evidence for a third dynamic 307
component in the matrix polysaccharides. These results suggest that the cellulose-contacting 308
pectic units are rigidified by the microfibrils while the pectic sugars that fill the interfibrillar 309
space are dynamic. The main pectin signals detected here are RGI and HG backbones, because 310
the galactan sidechain signals are difficult to resolve from the signals of the surface cellulose, 311
xyloglucan, and the concentrations of arabinan is low in this sample 312
313
Water interactions in the never-dried and rehydrated walls
314
To investigate water-polysaccharide interactions, we measured 2D 13C-1H heteronuclear 315
correlation (HETCOR) spectra of never-dried CW#1 (Figs. 7a, S5). In the absence of 1H spin 316
diffusion, only polysaccharide self-correlation peaks are seen. With a 1H spin diffusion mixing 317
time of 1 ms, water cross peaks are observed for most polysaccharides at a 1H chemical shift of 318
4.7 ppm. Since some polysaccharide protons have similar chemical shifts as the water proton, we 319
further conducted a dipolar-filtered MELODI-HETCOR experiment (Yao et al., 2001; Li et al., 320
2010) to remove the one-bond 13C-1H cross peaks by means of their strong 13C-1H dipolar 321
coupling. In the absence of 1H spin diffusion, the MELODI-HETCOR spectrum (Fig. 7b) 322
suppressed most polysaccharide signals except for a weak methyl ester peak at 3.8 ppm, as 323
expected. With 1 ms 1H spin diffusion, multiple cross peaks at the 1H chemical shift of 4.7 ppm 324
are detected while other cross peaks are suppressed (Fig. 7c). Thus, the 4.7-ppm 1H cross section 325
indeed corresponds to water-polysaccharide correlations. Comparison of the HETCOR and 326
MELODI-HETCOR spectra shows that the water-edited spectrum preferentially enhances the 327
pectin signals (Fig. 7d), indicating that pectins constitute the majority of the hydrated 328
polysaccharides, in excellent agreement with the results of a recent hydration study by 1H 329
polarization transfer NMR (White et al., 2014). Both surface cellulose and interior cellulose (e.g. 330
the 89 ppm C4 peak) show water cross peaks. Due to the 1 ms 1H spin diffusion period, this 331
polarization most likely originates from water on the surface rather than interior of the 332
microfibril. Interestingly, the water-correlated interior cellulose C4 peak has half the linewidth as 333
the cellulose C4 peak in the HETCOR (Fig. 7e). Since the HETCOR spectrum exhibits all 334
11
interior-cellulose signals due to the presence of polysaccharide protons that resonate between 4.5 335
and 5.0 ppm (Kono et al., 2003) whereas the MELODI-HETCOR spectrum only detects water-336
contacting cellulose, the line narrowing indicates that the water-proximal interior cellulose 337
chains adopt a subset of conformations that are present among all the glucan chains in the 338
microfibril. 339
340
The rehydrated CW#3 shows similar HETCOR and MELODI-HETCOR spectra (Fig. 341
S6) as the never-dried CW#1, except that the water-contacting pectins have 10-25% lower
342
intensities when normalized by the iC4 peak (Fig. S7), indicating that pectin-water association is 343
slightly reduced in the rehydrated cell wall. 344
345
Investigation of molecular crowding using HG-extracted cell wall
346
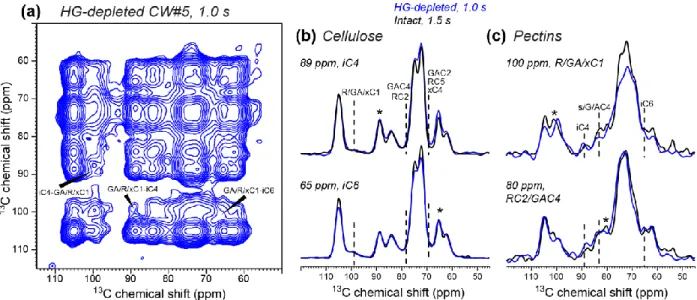
To probe whether the cellulose-pectin spatial contacts in the never-dried wall result from 347
non-specific molecular crowding or specific interactions, we investigated a partially HG-348
extracted never-dried cell wall (CW#5). Previous monosaccharide analysis indicated that this 349
sample contains ~40% less HG due to extraction by CDTA and sodium carbonate (White et al., 350
2014). Fig. 8 shows the 1-s 2D PDSD spectrum of this HG-reduced CW. Cellulose-pectin cross 351
peaks such as GA/R/xC1-iC4 at (100, 89) ppm remain in the 2D spectrum. Representative 352
cellulose and pectin cross sections show that the cellulose-pectin cross-peak intensities are 353
similar between the intact and extracted walls, indicating that the removed HG does not contact 354
cellulose in the original wall. Thus, pectin-cellulose spatial contacts are not caused by molecular 355
crowding but by specific interactions, which may involve pectin entrapment within and between
356 cellulose microfibrils. 357 358 Discussion 359
Our recent SSNMR studies of intact Arabidopsis primary cell walls (Dick-Perez et al., 360
2011; Dick-Perez et al., 2012; Wang et al., 2012; Wang et al., 2013; White et al., 2014) led to the 361
proposal of a single-network model of wall polysaccharides, which differs from the prevailing 362
CW model in which pectins do not form stable interactions with cellulose but constitute a gel-363
like milieu that embeds a cellulose-xyloglucan network and interacts with cellulose only via 364
polymer entanglements (Carpita and Gibeaut, 1993; Cosgrove, 2001, 2005). The current study 365
was designed to further test the authenticity of cellulose-pectin spatial contacts and gain insight 366
into the structural details of such contacts. Are cellulose-pectin contacts artifacts of transient 367
dehydration during cell-wall preparation? Do these contacts result from molecular crowding or 368
specific binding that have escaped previous studies? The present SSNMR data show that 369
quantitative 13C spectral intensities, 13C linewidths, 2D correlation peaks, and polysaccharide 370
mobilities are indistinguishable between the never-dried and rehydrated walls, thus 371
demonstrating that lyophilization followed by rehydration restores the wall polysaccharides to 372
their original structure and dynamics. Dehydration did not cause irreversible changes in the wall 373
polymer interactions. We propose that the reversiblity of CW structure and dynamics upon 374
rehydration is due to two factors: the rigidity of cellulose microfibrils, which provide a robust 375
scaffold to the cell wall, and the ease of the charged, hydroxyl-rich, and Ca2+-chelated matrix 376
polysaccharides to associate with water (White et al., 2014). 377
378
Four pieces of experimental evidence support the existence of specific cellulose – pectin 379
binding in the never-dried cell wall. First, pectin-cellulose cross peaks largely remain even after 380
12
40% of the HG has been extracted, thus molecular crowding is not the chief reason for the 381
cellulose-pectin spatial contact. This result also means that about half of HG does not participate 382
in cellulose binding, thus the main cellulose-binding pectins are either RGI or the remaining 383
portion of HG or both. Second, a recent hydration study showed that the removal of Ca2+ ions, 384
which crosslink HG, slows down water 1H magnetization transfer to both cellulose and pectins 385
instead of only pectins (White et al., 2014), indicating that pectins are in intimate contact with 386
cellulose. Third, in the never-dried wall, pectins show a long 13C T1 component of ~4.5 s, 387
comparable to the T1 of cellulose (~ 5 s) (Table 2, 3). This rigid fraction represents ~50% of 388
pectins, similar to the fraction of HG that cannot be extracted by CDTA and sodium carbonate. 389
These results strongly suggest that the rigid pectins are what remain in the wall, bound to 390
cellulose. Indeed, a previous SSNMR study of a similarly depectinated Arabidopsis cell wall 391
(Dick-Perez et al., 2012) showed significant increases in the 13C T1 relaxation time and 1H 392
rotation-frame longitudinal relaxation time (T1), confirming that the unextracted pectins are
393
more rigid. Fourth, the cellulose-pectin cross peaks are observed at both low and high 394
temperatures, thus they are not caused by freezing-induced alterations of polymer packing. The 395
preservation of the cross peaks at high temperature further verifies the conclusion that the more 396
rigid fraction of pectins is responsible for close contact with cellulose. 397
398
Taken together, these spectroscopic data indicate that part of HG and the majority of RGI 399
have significant and specific contacts with cellulose microfibrils. We hypothesize that the pectins
400
may be entrapped inside or between cellulose microfibrils, which may occur during cell wall 401
biosynthesis: pectins, secreted from the Golgi, may interact with the plasma-membrane-402
synthesized glucan chains when both are transported to the cell wall. 403
404
The persistence of hydration- and temperature-independent pectin-cellulose cross peaks 405
in multiple Arabidopsis primary wall samples raises the question why in-vitro binding assays 406
found only weak association between these two polysaccharides (Chanliaud and Gidley, 1999; 407
Zykwinska et al., 2007; Zykwinska et al., 2008). Pectins bind up to ~10 g per mg of cellulose, 408
compared to xyloglucan, which binds cellulose to ~120 g per mg of cellulose. An examination 409
of the protocols for the binding studies suggests several possible reasons for this apparent 410
discrepancy. First, the binding assays used polysaccharides that were extracted by strong acid 411
and alkali solutions of 0.5 - 6 M in concentration, at temperatures of 40-80˚C, and with up to 412
95% ethanol. The strong chemical extraction procedures perturb the conformation, esterification, 413
and methylation of the polysaccharides, and may irreversibly remove important intermolecular 414
interactions. For example, in one study, the extracted sugar-beet pectin used for cellulose binding 415
is predominantly HG and contains little Rha. Since neutral arabinan and galactan are known to 416
have higher affinity to cellulose than anionic galacturonic acids, the reduced amount of RGI in 417
the extracted pectins could reduce the measured binding level. Indeed, comparison of 418
commercial pectins with few neutral sidechains and mildly treated natural pectins in plant cell 419
walls that preserve the neutral sidechains show higher cellulose binding for the latter (Zykwinska 420
et al., 2005). 421
422
Second, some binding assays used bacterial cellulose, whose structure differs from that of 423
plant cellulose (Chanliaud and Gidley, 1999; Zykwinska et al., 2005). Bacterial cellulose is rich 424
in the I allomorph while the secondary walls of higher plants mainly contain the I allomorph
425
(Atalla and VanderHart, 1984), whose conformations and hydrogen-bonding patterns differ from 426
13
those of the I allomorph (Nishiyama et al., 2002; Nishiyama et al., 2003). In Arabidopsis
427
thaliana leaves, the cellulose 13C signals indicate the presence of both I
and I allomorphs, with
428
slightly higher Icontents (Newman et al., 1996). The detailed structures of primary-wall
429
microfibrils are still unknown, but in silico results suggest that cellulose chains in small 430
microfibrils differ from those in extended crystalline phases in terms of chain tilts and various 431
dihedral angles (Oehme et al., 2015). In addition, commercial Avicel microcrystalline cellulose 432
has been shown to bind pectins more weakly than plant cell wall cellulose (Zykwinska et al., 433
2005), possibly due to its decreased surface area. Thus, the use of cellulose with different origins 434
from the plant cell wall calls for caution in interpreting the results of in-vitro binding assays. 435
436
Third, in-vitro binding assays generally report much lower binding than in-vitro 437
extraction assays (Ryden and Selvendran, 1990; Oehme et al., 2015), which also report the 438
strength of the intermolecular interactions. This discrepancy also exists for xyloglucan, where 439
both the amount and strength of binding to cellulose are much less for in-vitro assays than is the 440
case in vivo in plant cell walls (Hayashi et al., 1987). On the molecular level, this discrepancy 441
between the bottom-up and top-down assays is conceivable because absorption studies limit 442
possible binding to the cellulose surface, while polysaccharide entrapment within or between
443
microfibrils can occur during cell wall biosynthesis. It is known that primary wall cellulose has a 444
lower crystallinity than the crystallinity of cellulose in synthetic composites, further suggesting 445
that in-vitro binding assays cannot reproduce the complexity of the polysaccharide interactions in 446
the native wall. Taken together, these considerations suggest that the cellulose-pectin NMR cross 447
peaks observed in never-dried walls at ambient temperature are more authentic indicators of the 448
wall structure than in-vitro assays of cellulose-pectin composite formation. 449
450
While the current study demonstrates the existence of cellulose-pectin close contacts in 451
the never-dried primary wall, the nature of this intermolecular interaction requires further 452
investigations. One question is whether RGI or HG is more responsible for interacting with 453
cellulose. At present it is difficult to fully resolve the HG and RGI 13C chemical shifts. 454
Polysaccharide-specific isotopic labeling and/or mutant plants deficient in one of the two pectins 455
would be desirable for answering this question. It is also unclear whether pectins can interact 456
with multiple microfibrils at the same time, which is a prerequisite for the load-bearing function 457
in both the tethered-network and the ‘hotspots’ model. 458
459
Material and Methods
460
Plant material 461
Never-dried Arabidopsis thaliana primary cell walls (CW#1) were prepared and 13C 462
labeled at Penn State University as described recently (White et al., 2014). Briefly, Arabidopsis 463
seedlings were harvested after dark growth for 14 days in liquid culture containing 13C-labeled 464
glucose as the sole carbon source. The seedlings were frozen, ground in liquid nitrogen and 465
washed with 1.5% SDS for 3 h to solubilize cell membranes, proteins and to inactivate 466
endogenous wall-degrading enzymes (Zablackis et al., 1995; Gibeaut et al., 2005). The material 467
was washed extensively in water, incubated with α-amylase (5000 units in 30 mL) from porcine 468
pancreas (Sigma Adrich) in sodium MES buffer (pH 6.8) to remove starch, then digested with 469
Pronase (Roche Life Sciences; 200 units, 5 mg in 20 mL) in sodium MES buffer (pH 7.5) to 470
digest proteins. The Pronase was finally inactivated by incubating the sample with shaking in 1.5% 471
SDS at room temperature for 1 h. 0.02% NaN3 was used in all solutions to inhibit microbial 472
14
growth. Bulk water was removed by centrifugation (White et al., 2014). This sample preparation 473
procedure avoided extensive washes with organic solvents and air drying, which were used in an 474
earlier sample prepared at Iowa State University (CW#4) (Dick-Perez et al., 2011). Walls that 475
have been frozen, thawed and washed with detergents retain their original mechanical 476
characteristics as well as microscopic appearance as seen by atomic force microscopy (Zhang et 477
al., 2014), so the molecular interactions are believed to be largely perturbed by such treatment. 478
Approximately 60 mg of the never-dried CW#1 was packed into 4 mm magic-angle-spinning 479
(MAS) rotors for SSNMR experiments. 480
481
As controls, another 60 mg of the same batch of never-dried wall was packed into an 482
MAS rotor and lyophilized for one day. 47 mg water was removed and a 1H NMR spectrum 483
confirmed the loss of bulk water. 13C spectra of this dehydrated CW#2 sample were measured. 484
Subsequently, an equivalent amount of water was added back to this dehydrated sample and 485
mixed homogeneously for a few minutes to produce CW#3. The dried wall absorbed water 486
readily. 487
488
We also re-measured the organic-solvent washed, air-dried and rehydrated CW#4. This 489
sample was used to obtain the previously reported cellulose-pectin cross peaks (Dick-Perez et al., 490
2011; Wang et al., 2012). We measured relaxation-compensated difference 2D spectra on this 491
CW#4 to verify the previous results and to compare with the never-dried CW#1. 492
493
A partially depectinated sample, CW#5, was prepared by treating the never-dried CW#1 494
with 50 mM trans-1,2-cyclohexanediaminetetraacetic acid (CDTA) for 16 h at 25˚C with three 495
changes of solution to chelate Ca2+ ions and solubilize HG, then with 50 mM sodium carbonate 496
with 20 mM NaBH4 (to minimize polysaccharide degradation) at 22˚C for 16 h with three 497
changes of solution to neutralize galacturonic acid and hydrolyze methyl esters to carboxylate 498
ions. Quantitative 13C NMR spectra show that ~40% of HG was removed by this protocol while 499
the majority of RGI (~95%) remained (White et al., 2014). This HG-depleted sample was 500
measured to compare with the never-dried CW#1. 501
502
Solid-state NMR experiments 503
Most SSNMR experiments were conducted on a Bruker Avance II 600 MHz 504
spectrometer (14.1 Tesla) using a 4 mm MAS probe. 13C-1H HETCOR spectra were measured on 505
a Bruker 900 MHz spectrometer (21.1 T) using a 3.2 mm MAS probe. PDSD experiments of 506
CW#5 at -18˚C and CW#1 at 20˚C were measured on a Bruker Avance III 400 MHz 507
spectrometer using a 4 mm MAS probe. Typical radiofrequency (rf) field strengths were 50-83 508
kHz for 1H and 40-50 kHz for 13C. 13C chemical shifts were externally referenced to the 509
adamantane CH2 signal at 38.48 ppm on the TMS scale. 510
511
1D 13C MAS spectra were measured at 20˚C under 9 kHz MAS using either DP or CP to 512
create the initial 13C magnetization. DP experiments were conducted with a long recycle delay of 513
25 s to obtain quantitative spectra or a short recycle delay of 2 s to selectively detect dynamic 514
polysaccharides, while CP experiments were used to preferentially detect rigid polysaccharides’ 515
signals. 516
15
2D 13C-13C PDSD experiments were conducted on the never-dried CW#1, rehydrated 518
CW#3, and HG-depleted CW#5 with mixing times of 1.0 – 1.5 s to detect long-range (~1 nm) 519
intermolecular correlations under varying hydration histories and polysaccharide densities. These 520
spectra were measured at -20˚C where both pectins and cellulose were immobilized, which 521
facilitate magnetization transfer (Wang et al., 2012). The 2D experiments were also conducted at 522
20˚C on CW#1 with mixing times of 5–500 ms to verify whether the intermolecular contacts also 523
exist at ambient temperature. The relaxation-compensated PDSD experiment was conducted on 524
CW#4 to obtain clean difference spectra showing only intermolecular cross peaks (Wang et al., 525
2015). The experiment inserts a z-filter before the evolution period, so that the sum of the z-filter 526
and the spin diffusion mixing time is a constant value of 1.005 s. Two parent spectra, with 527
mixing times of 1.0 s and 200 ms, were measured, and a difference spectrum was obtained by 528
subtracting the 200 ms spectrum after scaling by 0.83 from the 1.0 s spectrum. 529
530
The amplitudes and rates of polysaccharide motion were measured on the never-dried 531
CW#1 and rehydrated CW#3. 13C-1H dipolar chemical-shift (DIPSHIFT) correlation experiments 532
(Munowitz et al., 1981) were conducted at 20˚C under 7 kHz MAS to measure the C-H order 533
parameters (SCH). The FSLG sequence (Bielecki et al., 1989) was used for 1H homonuclear 534
decoupling. This theoretical scaling factor of 0.577 was verified using the model peptide formyl-535
Met-Leu-Phe (MLF) (Rienstra et al., 2002). The ratio of the true coupling to the rigid-limit value 536
of 22.7 kHz gives the SCH (Fig. S3). 13C T1 relaxation times were measured using a z-filter 537
sequence (Torchia, 1978) at 20˚C under 9 kHz MAS. Most relaxation decays are well fit by a 538
double exponential function (Tables 2, 3, Fig. S4). 539
540
2D 1H-13C HETCOR experiments were carried out at 20˚C under 14.8 kHz MAS on a 541
900 MHz spectrometer. For the Lee-Goldburg (LG) HETCOR experiment, 1H homonuclear 542
decoupling was achieved using the FSLG sequence with a 1H transverse field strength of 80 kHz 543
during t1 evolution, followed by a mixing period for 1H spin diffusion. The 1H magnetization was 544
transferred to 13C by 300 μs LG-CP (van Rossum et al., 2000). The 1H chemical shift was 545
calibrated using MLF (Li et al., 2010). To detect unambiguous polysaccharide-water cross peaks, 546
we also measured dipolar-edited medium- and long-distance (MELODI) HETCOR spectra (Yao 547
and Hong, 2001; Yao et al., 2001). Eight rotor periods of C-H dipolar dephasing were used 548
before the 1H t1 evolution period to dephase the 1H signals of 13C-labeled polysaccharides and 549
retain only the water 1H cross peaks to the polysaccharide 13C signals. The 180˚ pulse lengths 550
were 10 μs for 13C and 6.25 μs for 1H. Hartman-Hahn (HH) CP with 300 μs contact time was 551
used for the MELODI-HETCOR experiments. 552
16 554
555
Figure 1. 1D 13C quantitative DP spectra (a) and 1H spectra (b) of Arabidopsis cell walls at 20˚C 556
under 9 kHz MAS. (a) 13C spectra of never-dried CW#1, dried CW#2 and rehydrated CW#3. (b) 557
1H spectra, showing the relative water intensities. Lyophilization removed all bulk water. The 558
remaining 1H signals in the dried wall result from lipids. The dried CW#2 exhibits severely 559
broadened 13C signals, but the linewidths are fully restored by rehydration in CW#3. The 560
abbreviations for assignment are given. 561
562 563
17 564
565
Figure 2. 1D 13C CP (a) and DP (b) spectra of never-dried, dried, and rehydrated Arabidopsis 566
primary walls at 20˚C. The CP spectra selectively detect the signals of rigid polysaccharides, 567
while the DP spectra with 2 s recycle delays preferentially detect the signals of dynamic 568
polysaccharides. Rehydration fully restored polysaccharide linewidths to those seen for the 569
never-dried CW#1. 570
571 572
18 573
574 575
Figure 3. 1.5 s 2D PDSD spectra of Arabidospis cell walls. (a) Never-dried CW#1. (b)
576
Rehydrated CW#3. The spectra were measuring at -20˚C under 9 kHz MAS. (c) Representative 577
cellulose cross sections at various mixing times, normalized to the diagonal peaks (asterisk). (d) 578
Representative pectin cross sections. Intermolecular cellulose - pectin cross peaks are annotated. 579
All cross peaks detected in the rehydrated CW#3 are also observed in the never-dried CW#1 580
with similar intensities, confirming that the close pectin-cellulose contact is intrinsic to the 581
primary cell wall. 582
583 584
19 585
586 587
Figure 4. Difference 2D 13C PDSD spectra of CW#4 with T1-relaxation compensation to detect 588
intermolecular correlations. (a) Difference 2D spectrum between 1.0 s and 200 ms, measured 589
with a constant z-period of 1.005 s, 8 kHz MAS and at -20˚C. Negative intensities along the 590
diagonal are shown in green. Red shaded areas indicate intramolecular peaks that are present in 591
the parent spectra, which are removed in the difference spectrum. (b) Selected 1D cross sections 592
of cellulose, showing the suppression of intramolecular cross peaks to better resolve the 593
intermolecular cross peaks. Asterisks denote the diagonal peaks. (c) Representative 1D cross 594
sections of pectins. 595
596 597
20 598
599
Figure 5. 2D PDSD spectra of never-dried CW#1 at ambient temperature, showing retention of
600
pectin-cellulose cross peaks. (a) 0.5 s PDSD spectrum at 20˚C. A few cellulose-pectin cross 601
peaks are assigned. (b) Representative cellulose cross sections from 2D spectra with mixing 602
times of 30 ms and 0.5 s. The 1.5 s spectrum measured at -20˚C is superimposed for comparison. 603
Pectin-cellulose cross peaks are present at high temperature, indicating that the intermolecular 604
contacts detected at -20˚C are not due to freezing. The high-temperature cross peaks are lower 605
than at low temperature due to conformational dynamics of the pectins. Asterisks indicate 606
diagonal peaks. 607
608 609
21 610
Figure 6. Comparison of polysaccharide mobility between the never-dried CW#1 (left) and the
611
rehydrated CW#3 (right). (a) C-H order parameters SCH, obtained from a quantitative DIPSHIFT 612
spectrum measured at 20˚C. The SCH’s are very similar between the two samples, indicating 613
similar motional amplitudes. (b) 13C T1 relaxation times. Matrix polysaccharides exhibit a short 614
(cyan) and long (magenta) T1 component, which likely correspond to cellulose-unbound and 615
bound fractions. (c) Fractions of the short and long T1 components. The never-dried and 616
rehydrated walls have similar T1 distributions. 617
22 618
619
620
Figure 7. 2D 13C-1H HETCOR spectra of never-dried CW#1 to probe water-polysaccharide 621
interactions. The spectra were measured at 20˚C under 14.8 kHz MAS. (a) 2D HETCOR 622
spectrum without and with 1H spin diffusion. (b) MELODI-HETCOR spectrum without and with 623
spin diffusion. (c) Representative 1H cross sections from the HETCOR (black) and MELODI-624
HETCOR (blue) spectra with 0 and 1 ms 1H spin diffusion. (d) 1H projection of the 1 ms 625
HETCOR spectrum (black) compared with the water 1H cross section of the 1 ms MELODI-626
HETCOR spectrum (blue). The water cross section shows higher pectin intensities. (e) Expanded 627
cellulose region of (d). The water-contacting cellulose has narrower linewidth than the average 628
cellulose. 629
630 631
23 632
633
Figure 8. Observation of cellulose-pectin cross peaks in HG-reduced CW#5. (a) 2D PDSD
634
spectrum with 1 s 13C spin diffusion. Some of the cellulose-pectin cross peaks are assigned. (b) 635
Comparison of the main cellulose cross sections between CW#5 (blue) and CW#1 (black). (c) 636
Comparison of the main pectin cross sections between CW#5 and CW#1. The HG-reduced wall 637
shows similar cellulose-pectin cross-peak intensities as the intact wall. The two spectra were 638
measured at about -20˚C under 9 kHz MAS. 639
640 641
24
Table 1. Cell wall samples and preparation conditions.
642
Samples Preparation conditions
CW#1 Never-dried cell wall produced at Penn State
CW#2 Lyophilized cell wall from the same batch as CW#1 CW#3 CW#2 rehydrated
CW#4 Cell wall produced at Iowa State, washed with organic solvents, air-dried and rehydrated
CW#5 CW#1 that was extracted with CDTA and Na2CO3 643
644
Table 2. 13C T1 relaxation times of never-dried CW#1. The single and double exponential 645
functions used to fit the data are I t
( )
=e-t T1b and I t( )
=ae-t T1a+be-t T1b where b = 1-a.646 647
Assignment δC (ppm) a (mobile) b (rigid) T1a (s) T1b (s)
i/s/G/GalC1 105.0 1 5.1±0.1 HG/RC1 101.0 0.58±0.01 0.42±0.01 0.39±0.01 4.6±0.2 x/GAC1 99.7 0.50±0.02 0.50±0.02 0.44±0.03 4.7±0.2 iC4 89.0 1 5.6±0.1 s/GC4 84.5 1 4.7±0.1 GC4 83.0 0.10±0.01 0.90±0.01 0.20±0.05 4.8±0.1 RC2/(H)GAC4 79.9 0.47±0.03 0.53±0.03 0.30±0.04 4.0±0.3 xC4 70.4 0.36±0.02 0.64±0.02 0.27±0.03 4.4±0.2 (H)GAC2/RC5 69.0 0.63±0.02 0.37±0.02 0.26±0.02 4.2±0.3 iC6 65.2 0.15±0.01 0.85±0.01 0.09±0.02 5.2±0.1 sC6,x/AC5 62.6 0.20±0.05 0.80±0.05 0.13±0.01 4.9±0.1 G/GalC6 61.7 0.18±0.01 0.82±0.01 0.20±0.03 4.8±0.1 648 649
Table 3. 13C T1 relaxation times of Arabidopsis CW#3. 650
651
Assignment δC (ppm) a (mobile) b (rigid) T1a (s) T1b (s)
i/s/G/GalC1 105.0 1 4.7±0.1 HG/RC1 101.0 0.56±0.01 0.44±0.01 0.41±0.01 4.1±0.1 x/GAC1 99.7 0.47±0.03 0.53±0.03 0.47±0.04 4.4±0.3 iC4 89.0 1 5.4±0.1 s/GC4 84.5 1 4.5±0.1 GC4 83.0 0.25±0.02 0.75±0.02 0.49±0.05 5.3±0.2 RC2/(H)GAC4 79.9 0.66±0.02 0.34±0.02 0.38±0.02 5.2±0.3 xC4 70.4 0.36±0.02 0.64±0.02 0.28±0.03 3.9±0.2 (H)GAC2/RC5 69.0 0.58±0.03 0.42±0.03 0.28±0.03 3.0±0.3 iC6 65.2 0.07±0.01 0.93±0.01 0.01±2.27 4.8±0.1 sC6,x/AC5 62.6 0.14±0.05 0.86±0.05 0.05±0.02 4.3±0.1 G/GalC6 61.7 0.18±0.01 0.82±0.01 0.09±0.02 4.2±0.1 652 653 References 654
25 655
Albersheim P, Darvill A, Roberts K, Sederoff R, Staehelin A (2011) Plant Cell Walls.
656
Garland Science, Taylor & Francis Group, LLC, New York 657
Atalla RH, VanderHart DL (1984) Native Cellulose: A Composite of Two Distinct Crystalline
658
Forms. Science 223: 283-285 659
Bielecki A, Kolbert AC, Levitt MH (1989) Frequency-switched pulse sequences - homonuclear
660
decoupling and dilute spin NMR in solids. Chem. Phys. Lett. 155: 341-346 661
Caffall KH, Mohnen D (2009) The structure, function, and biosynthesis of plant cell wall pectic
662
polysaccharides. Carbohydr. Res. 344: 1879-1900 663
Carpita NC, Gibeaut DM (1993) Structural Models of Primary-Cell Walls in Flowering Plants
664
- Consistency of Molecular-Structure with the Physical-Properties of the Walls during 665
Growth. Plant J. 3: 1-30 666
Chanliaud E, Gidley MJ (1999) In vitro synthesis and properties of pectin/Acetobacter xylinus
667
cellulose composites. Plant J. 20: 25-35 668
Cornuault V, Manfield IW, Ralet MC, Knox JP (2014) Epitope detection chromatography: a
669
method to dissect the structural heterogeneity and inter-connections of plant cell-wall 670
matrix glycans. Plant J. 78: 715-722 671
Cosgrove DJ (2001) Wall structure and wall loosening. A look backwards and forwards. Plant
672
Physiol. 125: 131-134 673
Cosgrove DJ (2005) Growth of the plant cell wall. Nat. Rev. Mol. Cell Biol. 6: 850-861
674
Cosgrove DJ (2014) Re-constructing our models of cellulose and primary cell wall assembly.
675
Curr. Opin. Plant Biol. 22: 122-131 676
Dick-Perez M, Wang T, Salazar A, Zabotina OA, Hong M (2012) Multidimensional
solid-677
state NMR studies of the structure and dynamics of pectic polysaccharides in uniformly 678
13C-labeled Arabidopsis primary cell walls. Magn. Reson. Chem. 50: 539-550 679
Dick-Perez M, Zhang Y, Hayes J, Salazar A, Zabotina OA, Hong M (2011) Structure and
680
interactions of plant cell-wall polysaccharides by two- and three-dimensional magic-681
angle-spinning solid-state NMR. Biochemistry 50: 989-1000 682
Fleischer A, O'Neill MA, Ehwald R (1999) The Pore Size of Non-Graminaceous Plant Cell
683
Walls Is Rapidly Decreased by Borate Ester Cross-Linking of the Pectic Polysaccharide 684
Rhamnogalacturonan II. Plant Physiol. 121: 829-838 685
Gibeaut DM, Pauly M, Bacic A, Fincher GB (2005) Changes in cell wall polysaccharides in
686
developing barley (Hordeum vulgare) coleoptiles. Planta 221: 729-738 687
26
Goodneratne J, Needs PW, Ryden P, Selvendran RR (1994) Structural features of cell wall
688
polysaccharides from the cotyledons of mung bean Vigna radiata. Carbohydr. Res. 265: 689
61-77 690
Hayashi T, Marsden MP, Delmer DP (1987) Pea Xyloglucan and Cellulose: V.
Xyloglucan-691
Cellulose Interactions in Vitro and in Vivo. Plant Physiol. 83: 384-389 692
Huster D, Xiao L, Hong M (2001) Solid-state NMR investigation of the dynamics of the
693
soluble and membrane-bound colicin Ia channel-forming domain. Biochemistry 40: 694
7662-7674 695
Ishii T, Matsunaga T (1996) Isolation and characterization of a boron-rhamnogalacturonan-II
696
complex from cell walls of sugar beet pulp. Carbohydr. Res. 284: 1-9 697
Jarvis MC (1992) Self-Assembly of Plant-Cell Walls. Plant Cell Environ. 15: 1-5
698
Kono H, Erata T, Takai M (2003) Determination of the through-bond carbon-carbon and
699
carbon-proton connectivities of the native celluloses in the solid state. Macromolecules 700
36: 5131-5138
701
Li S, Su Y, Luo W, Hong M (2010) Water-protein interactions of an arginine-rich membrane
702
peptide in lipid bilayers investigated by solid-state nuclear magnetic resonance 703
spectroscopy. J. Phys. Chem. B 114: 4063-4069 704
Matthews JF, Skopec CE, Mason PE, Zuccato P, Torget RW, Sugiyama J, Himmel ME,
705
Brady JW (2006) Computer simulation studies of microcrystalline cellulose Ibeta.
706
Carbohydr. Res. 341: 138-152 707
McCann MC, Wells B, K. R (1990) Direct visualization of cross-links in the primary plant cell
708
wall. J. Cell Science 96: 323-334 709
Munowitz MG, Griffin RG, Bodenhausen G, Huang TH (1981) Two-dimensional rotational
710
spin-echo NMR in solids: correlation of chemical shift and dipolar interactions. J. Am. 711
Chem. Soc. 103: 2529-2533 712
Newman RH, Davies LM, Harris PJ (1996) Solid-State 13C Nuclear Magnetic Resonance
713
Characterization of Cellulose in the Cell Walls of Arabidopsis thaliana Leaves. Plant 714
Physiol. 111: 475-485 715
Nishiyama Y, Langan P, Chanzy H (2002) Crystal structure and hydrogen-bonding system in
716
cellulose 1 beta from synchrotron X-ray and neutron fiber diffraction. J. Am. Chem. Soc. 717
124: 9074-9082
718
Nishiyama Y, Sugiyama J, Chanzy H, Langan P (2003) Crystal structure and hydrogen
719
bonding system in cellulose 1(alpha), from synchrotron X-ray and neutron fiber 720
diffraction. J. Am. Chem. Soc. 125: 14300-14306 721
27
Oehme DP, Downton MT, Doblin MS, Wagner J, Gidley MJ, Bacic T (2015) Novel aspects
722
of the structure and dynamics of Iβ elementary cellulose microfibrils revealed by 723
computational simulations. Plant Physiol. Epub ahead of print 724
Park YB, Cosgrove DJ (2012a) Changes in Cell Wall Biomechanical Properties in the
725
Xyloglucan-Deficient xxt1/xxt2 Mutant of Arabidopsis. Plant Physiol. 158: 465-475 726
Park YB, Cosgrove DJ (2012b) A revised architecture of primary cell walls based on
727
biomechanical changes induced by substrate-specific endoglucanases. Plant Physiol. 158: 728
1933-1943 729
Peaucelle A, Braybrook S, Hofte H (2012) Cell wall mechanics and growth control in plants:
730
the role of pectins revisited. Front. Plant Sci. 3: 121 731
Popper ZA, Fry SC (2008) Xyloglucan-pectin linkages are formed intra-protoplasmically,
732
contribute to wall-assembly, and remain stable in the cell wall. Planta 227: 781-794 733
Rienstra CM, Tucker-Kellogg L, Jaroniec CP, Hohwy M, Reif B, McMahon MT, Tidor B,
734
Lozano-Perez T, Griffin RG (2002) De novo determination of peptide structure with
735
solid-state magic-angle spinning NMR spectroscopy. Proc. Natl. Acad. Sci. U.S.A. 99: 736
10260-10265 737
Ryden P, Selvendran RR (1990) Structural features of cell-wall polysaccharides of potato
738
(Solanum tuberosum). Carbohydr. Res. 195: 257-272 739
Somerville C, Bauer S, Brininstool G, Facette M, Hamann T, Milne J, Osborne E, Paredez
740
A, Persson S, Raab T, Vorwerk S, Youngs H (2004) Toward a systems approach to
741
understanding plant cell walls. Science 306: 2206-2211 742
Talbott LD, Ray PM (1992) Molecular size and separability features of pea cell wall
743
polysaccharides. Implications for models of primary wall structure. Plant Physiol. 92: 744
357-368 745
Tan L, Eberhard S, Pattathil S, Warder C, Glushka J, Yuan C, Hao Z, Zhu X, Avci U,
746
Miller JS, Baldwin D, Pham C, Orlando R, Darvill A, Hahn MG, Kieliszewski MJ,
747
Mohnen D (2013) An arabidopsis cell wall proteoglycan consists of pectin and
748
arabinoxylan covalently linked to an arabinogalactan protein. Plant Cell 25: 270-287 749
Torchia DA (1978) Measurement of proton-enhanced 13C T1 values by a method which 750
suppresses artifacts. J. Magn. Reson. 30: 613-616 751
van Rossum BJ, de Groot CP, Ladizhansky V, Vega S, de Groot HJM (2000) A method for
752
measuring heteronuclear 1H-13C distances in high speed MAS NMR. J. Am. Chem. Soc, 753
122: 3465-3472
754
Wang T, Park YB, Caporini MA, Rosay M, Zhong L, Cosgrove DJ, Hong M (2013)
755
Sensitivity-enhanced solid-state NMR detection of expansin's target in plant cell walls. 756
Proc. Natl. Acad. Sci. U.S.A. 110: 16444-16449 757
28
Wang T, Salazar A, Zabotina OA, Hong M (2014) Structure and dynamics of Brachypodium
758
primary cell wall polysaccharides from two-dimensional 13C solid-state nuclear magnetic 759
resonance spectroscopy. Biochemistry 53: 2840-2854 760
Wang T, Williams JK, Schmidt-Rohr K, Hong M (2015) Relaxation-compensated difference
761
spin diffusion NMR for detecting 13C–13C long-range correlations in proteins and 762
polysaccharides. J. Biomol. NMR 61: 97-107 763
Wang T, Zabotina O, Hong M (2012) Pectin-cellulose interactions in the Arabidopsis primary
764
cell wall from two-dimensional magic-angle-spinning solid-state nuclear magnetic 765
resonance. Biochemistry 51: 9846-9856 766
White PB, Wang T, Park YB, Cosgrove DJ, Hong M (2014) Water-polysaccharide
767
interactions in the primary cell wall of Arabidopsis thaliana from polarization transfer 768
solid-state NMR. J. Am. Chem. Soc. 136: 10399-10409 769
Yao XL, Hong M (2001) Dipolar filtered 1H-13C heteronuclear correlation spectroscopy for 770
resonance assignment of proteins. J. Biomol. NMR 20: 263-274 771
Yao XL, Schmidt-Rohr K, Hong M (2001) Medium- and long-distance 1H-13C heteronuclear 772
correlation NMR in solids. J. Magn. Reson. 149: 139-143 773
Zablackis E, Huang J, Muller B, Darvill AG, Albersheim P (1995) Characterization of the
774
cell-wall polysaccharides of Arabidopsis thaliana leaves. Plant Physiol 107: 1129-1138 775
Zhang T, Mahgsoudy-Louyeh S, Tittmann B, Cosgrove DJ (2014) Visualization of the
776
nanoscale pattern of recently-deposited cellulose microfibrils and matrix materials in 777
never-dried primary walls of the onion epidermis. Cellulose 21: 853-862 778
Zhao Z, Crespi VH, Kubicki JD, Cosgrove DJ, Zhong LH (2014) Molecular dynamics
779
simulation study of xyloglucan adsorption on cellulose surfaces: effects of surface 780
hydrophobicity and side-chain variation. Cellulose 21: 1025-1039 781
Zykwinska A, Thibault JF, Ralet MC (2007) Organization of pectic arabinan and galactan side
782
chains in association with cellulose microfibrils in primary cell walls and related models 783
envisaged. J. Exp. Bot. 58: 1795-1802 784
Zykwinska A, Thibault JF, Ralet MC (2008) Competitive binding of pectin and xyloglucan
785
with primary cell wall cellulose. Carbohydr. Polymers 74: 957-961 786
Zykwinska AW, Ralet MCJ, Garnier CD, Thibault JF (2005) Evidence for in vitro binding of
787
pectin side chains to cellulose. Plant Physiol. 139: 397-407 788
789 790 791