Publisher’s version / Version de l'éditeur:
Review of Quantitative Nondestructive Evaluation, 23, 2004-02-26
READ THESE TERMS AND CONDITIONS CAREFULLY BEFORE USING THIS WEBSITE.
https://nrc-publications.canada.ca/eng/copyright
Vous avez des questions? Nous pouvons vous aider. Pour communiquer directement avec un auteur, consultez la
première page de la revue dans laquelle son article a été publié afin de trouver ses coordonnées. Si vous n’arrivez pas à les repérer, communiquez avec nous à PublicationsArchive-ArchivesPublications@nrc-cnrc.gc.ca.
Questions? Contact the NRC Publications Archive team at
PublicationsArchive-ArchivesPublications@nrc-cnrc.gc.ca. If you wish to email the authors directly, please see the first page of the publication for their contact information.
NRC Publications Archive
Archives des publications du CNRC
This publication could be one of several versions: author’s original, accepted manuscript or the publisher’s version. / La version de cette publication peut être l’une des suivantes : la version prépublication de l’auteur, la version acceptée du manuscrit ou la version de l’éditeur.
For the publisher’s version, please access the DOI link below./ Pour consulter la version de l’éditeur, utilisez le lien DOI ci-dessous.
https://doi.org/10.1063/1.1711638
Access and use of this website and the material on it are subject to the Terms and Conditions set forth at
Laser-Ultrasonic Characterization of Fiber Reinforced Composites:
Effect of the Generation Laser Transverse Modes
Campagne, B.; Lévesque, D.; Bescond, C.; Néron, C.; Blouin, A.; Monchalin,
J.-P.
https://publications-cnrc.canada.ca/fra/droits
L’accès à ce site Web et l’utilisation de son contenu sont assujettis aux conditions présentées dans le site LISEZ CES CONDITIONS ATTENTIVEMENT AVANT D’UTILISER CE SITE WEB.
NRC Publications Record / Notice d'Archives des publications de CNRC:
https://nrc-publications.canada.ca/eng/view/object/?id=7579813e-6d7f-40f8-93b4-378d385d2f00 https://publications-cnrc.canada.ca/fra/voir/objet/?id=7579813e-6d7f-40f8-93b4-378d385d2f00
LASER-ULTRASONIC CHARACTERIZATION OF FIBER
REINFORCED COMPOSITES: EFFECT OF THE GENERATION
LASER TRANSVERSE MODES
B. Campagne, D. Lévesque, C. Bescond, C. Néron, A. Blouin and J.-P. Monchalin
Industrial Materials Institute, National Research Council of Canada, 75 de Mortagne Blvd., Boucherville, Québec, J4B 6Y4, Canada
ABSTRACT. Laser-ultrasonics has been used with success for the microstructure evaluation of metals by measuring ultrasonic attenuation and velocity. Extension of this technique to fiber reinforced polymer composites could provide useful information such as fiber contents and porosity. Ultrasonic generation in composite materials is usually performed by using a pulsed TEA-CO2 laser operated on several transverse
modes. The intensity profile of this laser could change from shot-to-shot, thus affecting the ultrasonic generation pattern and the accuracy of attenuation measurement. Two solutions are possible to overcome this problem. The first reported approach consists in numerically correcting for the diffraction effect by using a Monte Carlo integration after simultaneous acquisition of the ultrasonic signal and the laser mode pattern. The second reported approach consists in modifying the laser resonator to get a single transverse mode while maintaining high energy per pulse, and to make the diffraction correction much simpler. Both approaches have been tested on a bare carbon epoxy plate with laser generation in the thermoelastic regime. The results obtained from using either approaches show a significant improvement and are compared to those obtained by conventional ultrasonics.
INTRODUCTION
Laser-ultrasonics is a non-contact technique that uses lasers for the generation and detection of ultrasound [1, 2] and has been used with great success for the characterization of the microstructure of metals [3, 4]. Reliable characterization results were obtained in many cases from ultrasonic attenuation or velocity measurements [5]. Extension of these techniques to fiber reinforced polymer composites could provide information on consolidation, fiber contents and porosity in these materials. A very common laser used to
generate ultrasonic waves in composite materials is the TEA pulsed CO2 laser, whose
wavelength of 10.6 µm is well absorbed by the epoxy surface layer usually present in a
composite material. Advantages of using the TEA-CO2 laser are its high reliability and
high deliverable pulse energy. To provide high energy, the laser cavity is built such as several transverse modes are above laser threshold. These modes are competing with each other, so the resulting profile has a multimode pattern whose intensity distribution changes from shot-to-shot.
It is well known that precise measurement of material ultrasonic attenuation or velocity dispersion requires to compensate for diffraction effect. The classical and simple situations are when measurements are performed in the near field (larger spots, higher frequencies) where no correction is required and the far field (smaller spots, lower frequencies) where only a constant is to be removed. However, there are situations, i.e. a certain frequency range in the available bandwidth, where diffraction is in the intermediate field and therefore, a more sophisticated model is required [5, 6]. For laser generation in the thermoelastic regime with a finite optical penetration depth, the spatial shape of the ultrasonic source should be similar to that of the intensity distribution of the laser beam. Since, in practice, the laser intensity distribution changes from shot-to-shot, it appears difficult to predict and compensate adequately for diffraction effect.
In this paper, we propose two approaches to overcome this problem. The first approach consists in capturing the intensity distribution of the laser beam with a pyroelectric camera while simultaneously measuring the ultrasonic motion at the surface. The correction for ultrasonic diffraction caused by the actual laser intensity distribution is performed numerically using a Monte Carlo integration technique. The second approach consists in a modification of the laser resonator to get a single transverse mode beam while maintaining high energy per pulse. After this modification, the laser gives a highly reproducible transverse beam profile from shot-to-shot. In this case, the pyroelectric camera is no longer required and the diffraction correction is much simpler. Both approaches are tested on a bare carbon epoxy plate with laser generation in the thermoelastic regime and the results are compared to those using conventional ultrasonics.
MULTIMODE LASER GENERATION AND NUMERICAL CORRECTION
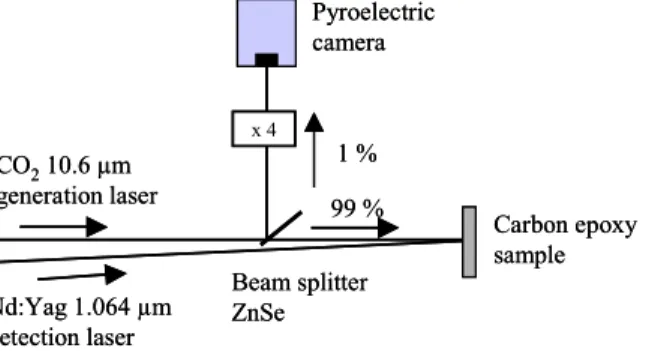
The experimental setup for the first approach is described in Fig. 1. The TEA-CO2
laser beam is split into two parts. A low energy beam is directed into the pyroelectric camera that captures the intensity distribution of the beam. The beam is magnified by 4 to cover the pyroelectric sensor matrix. The pyroelectric camera is Pyrocam II from Spiricon, Inc. The 25 mm x 25 mm square matrix is constituted of 32x32 individual sensors spaced with an interval of 0.8 mm. The Nd:YAG detection laser impinges the sample surface at the same location as the generation laser. The scattered light from the surface is then collected and sent into a Fabry-Perot interferometer for phase demodulation.
Some typical laser profiles are shown in Fig. 2. As one can see in Fig. 2a, the
multimode CO2 laser can change significantly from shot-to-shot. The profile of the fiber
coupled detection laser captured with the same camera remains nearly constant.
FIGURE 1. Schematic of the experimental setup.
1 % 99 % Beam splitter ZnSe Nd:Yag 1.064 µm detection laser CO210.6 µm generation laser Pyroelectric camera Carbon epoxy sample x 4 1 % 99 % Beam splitter ZnSe Nd:Yag 1.064 µm detection laser CO210.6 µm generation laser Pyroelectric camera Carbon epoxy sample x 4 303
a) b)
FIGURE 2. Laser profile images: a) typical intensity distribution of the multimode CO2 laser and b) intensity
distribution of the detection laser.
a)
b)
FIGURE 3. a) Typical waveform from the composite and b) amplitude spectrum of the second echo.
The sample used for attenuation measurement is a bare carbon epoxy composite that is widely used in the aeronautic industry. The thickness of the sample is 5.3 mm, and the longitudinal velocity is 2900 m/s. Fig. 3a shows a typical waveform where the large surface displacement at the beginning is saturated to make emphasis on the first and second echoes. The two echoes are windowed and their spectrum computed. The amplitude ratio provides the uncorrected attenuation as function of frequency and the phase difference is used to get the uncorrected velocity dispersion. The amplitude spectrum of the second echo normalized to the maximum of the first echo is presented in Fig. 3b. This allows to compute the attenuation in the 0.5 to 7 MHz frequency range. For amplitude smaller than -20 dB, the signal is buried in the noise.
The diffraction correction is performed numerically by integrating the scalar potential using the Green’s function for zero normal stress boundary conditions [5, 7]. With respect
to Fig. 4, the potential φ at a point P(x, y, z) on the detection area SD can be calculated
from the contributions of all the potentials φο(x’,y’,0) on the generation area ST using:
dS e r z jk r z ) 0 , ' y , ' x ( e ) z , y , x ( jkr 2 3 S o t j T − ω + φ π = φ
∫
2 (1)where ω=2πf, f is the frequency, k=ω/v is the wavenumber and v is the longitudinal
velocity. Then, the integration of the potential φ(x, y, z) over the detection area SD is
performed to get the averaged potential corresponding to propagation in absence of
attenuation in the medium. With the usual approximation for normal displacement uz=
∂φ/∂z ≈ -jkφ, the amplitude loss due to diffraction involved in the attenuation measurement is given by the ratio of the averaged potential evaluated at the travel distances of the first and second echoes. A Monte Carlo technique based on Sobol’s sequence [8] is used to efficiently perform the above 4-dimensional numerical integration.
FIGURE 4. Geometry for the Monte Carlo integration scheme.
a) b)
FIGURE 5. a) Attenuation spectra and b) velocity dispersion before (dashed line) and after diffraction correction (solid line).
Fig. 5 shows the attenuation spectra and velocity dispersion obtained with and without correction after 10 times averaging on the composite sample. One observes that the diffraction corrected attenuation tends to zero at zero frequency as expected. The velocity dispersion once corrected tends to be flatter than before correction as expected for bulk waves.
SINGLE-MODE LASER GENERATION
The second approach is to get a single transverse mode beam pattern by modifying
the resonator of the CO2 laser. This alternative approach does not require measurements
with a pyroelectric camera since the resulting single mode beam has a very stable and reproducible transverse intensity distribution. Also, the necessary diffraction correction should be much simpler since the beam is expected to have a simple gaussian intensity distribution at the working distance.
The new resonator is composed of a pair of mirrors specially designed to get a highly brilliant and low-divergent single mode laser beam. The output coupling is a variable reflectivity mirror (VRM) that has a reflection coefficient with a super-gaussian shape as shown in Fig. 6a. In the figure, the solid line is the theoretical reflectivity and the symbols indicate the measured reflectivity. Fig. 6b shows the resulting intensity distribution of the laser beam measured at the working distance of 3.6 m from the output coupling. The dots are the experimental data and the solid line is a gaussian fit. The beam diameter defined at
1/e2 of the maximum is of about 8 mm.
x
y
z
S
TS
Dr
P
x
y
z
S
TS
Dr
P
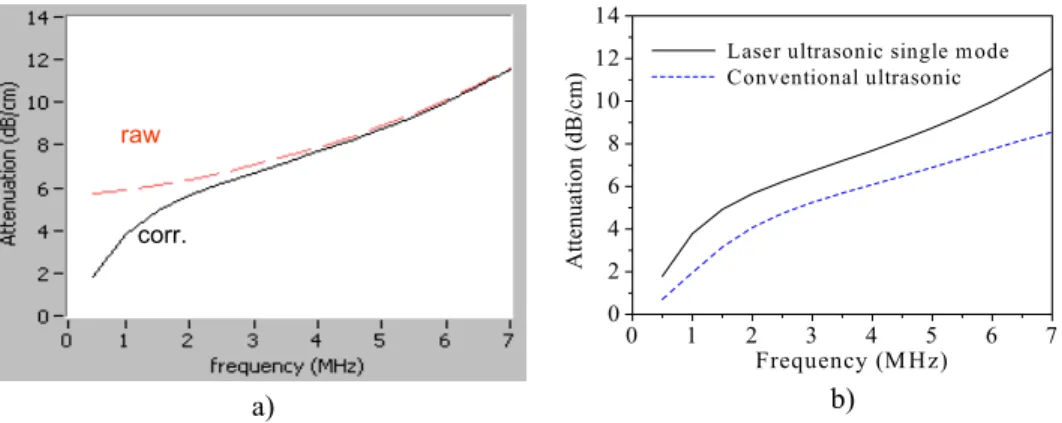
corr. raw raw corr. 305Fig. 7a presents the attenuation spectra obtained with and without diffraction correction using the single transverse mode laser generation. The diffraction correction in this case is based on a propagation model for ultrasound gaussian beam [5] and an analytical integration over the detection area. When compared to the attenuation obtained with the multimode laser generation (see Fig. 5a), we notice the same behavior as function of frequency and quantitatively the same results.
An experiment using conventional ultrasonics was performed to make a comparison with the above laser-ultrasonic results. The sample was placed in a water tank and a single 5 MHz transducer of diameter 1/8 in (3.2 mm) was used as transmitter and receiver (pulse-echo mode) at a distance of 10 mm from the sample. The diffraction correction due to ultrasound propagation in water and in the sample was calculated using the classical model for a piston source [5]. Also, the transmission loss due to impedance mismatch between the sample and water was taken into account. Fig. 7b shows a direct comparison of the corrected attenuation spectra measured with both techniques. While having nearly the same behavior as function of frequency, an offset of about 2 dB/cm is found between the two measurements with the laser-ultrasonic attenuation being larger.
a) b)
FIGURE 6. a) Reflection coefficient of the VRM output coupling with super-gaussian shape and b) gaussian intensity distribution of the single mode CO2 laser measured at 3.6 m from the output coupling.
a) b)
FIGURE 7. a) Attenuation spectra with and without diffraction correction using a single mode laser generation of 8 mm diameter and b) comparison between laser-ultrasonic and conventional ultrasonic results.
-5 0 5 0.0 0.5 1.0 1.5 2.0 2.5 A m p litud e (a .u.) X (mm) Radial distance (mm) Refl ec tivi ty 0 2 4 6 -6 -4 -2 0.2 0.4 0.6 0.8 1 0 Radial distance (mm) Refl ec tivi ty 0 2 4 6 -6 -4 -2 0 2 4 6 -6 -4 -2 0.2 0.4 0.6 0.8 1 0 raw corr. 0 1 2 3 4 5 6 7 0 2 4 6 8 10 12 14
Laser ultrasonic single m ode Conventional ultrasonic A ttenuat ion ( d B/ cm ) Frequency (M Hz)
DISCUSSION
To explain the discrepancy in Fig. 7b, it was first suspected that the laser generation mechanisms in the thermoelastic regime may not produce a spatial profile of the generated ultrasound matching the laser intensity distribution. It is well known that two important mechanisms for laser generation are the surface center of expansion (SCOE) producing horizontal dipoles, and either thermal diffusion (metal) or optical penetration (non-metal) producing vertical forces [1, 9]. Diffraction models based on the scalar potential would be inapplicable in the presence of significant horizontal dipoles. To check this point, numerical simulations were performed with a more complete model combining the above mechanisms for laser generation as well as wave propagation [10]. Fig. 8 shows the calculated spatial profiles obtained for the first and second longitudinal echoes after narrow bandpass filtering around 4 MHz. The optical source has a gaussian intensity distribution of 4.24 mm diameter, with an optical penetration of 20 µm as found in the literature for carbon epoxy [10]. A small beam diameter is used to better see the difference in the laser generation mechanisms. Also, simulations are performed for the thermoelastic regime and for a piston-like source having no horizontal dipole. In the figure, simulations show about the same profiles for both cases and for the two echoes, indicating that the effect of dipoles is indeed negligible. Moreover, the simple diffraction model gives very similar profiles, closer to piston-like source as expected, validating its use in the above and not explaining the discrepancy in Fig. 7b.
Longitudinal and shear wave velocities, vl and vs, were measured with contact
transducers to evaluate the possibility of interference in the arrivals of different modes. Such an effect could be anticipated on the second longitudinal echo if the shear velocity is close to half the longitudinal velocity value [11]. For the composite sample, the velocities
were found to be vl = 2900 m/s and vs = 1700 m/s. Numerical simulations were performed
with the full model for laser generation while neglecting attenuation in the material and show that the shear and longitudinal echoes are well separated in time. Also, predicted shear arrivals are not observed in the measured signals (see Fig. 3a), indicating that such shear waves are strongly attenuated in the composite. Therefore, interference effect between echo arrivals of different modes is not the cause of the discrepancy.
FIGURE 8. Spatial profiles of first and second longitudinal echoes in the composite material assuming a gaussian source of 4.24 mm diameter. Simulations for piston-like (▲) and thermoelastic () generation are compared with calculations from the diffraction model ().
source
2nd 1st
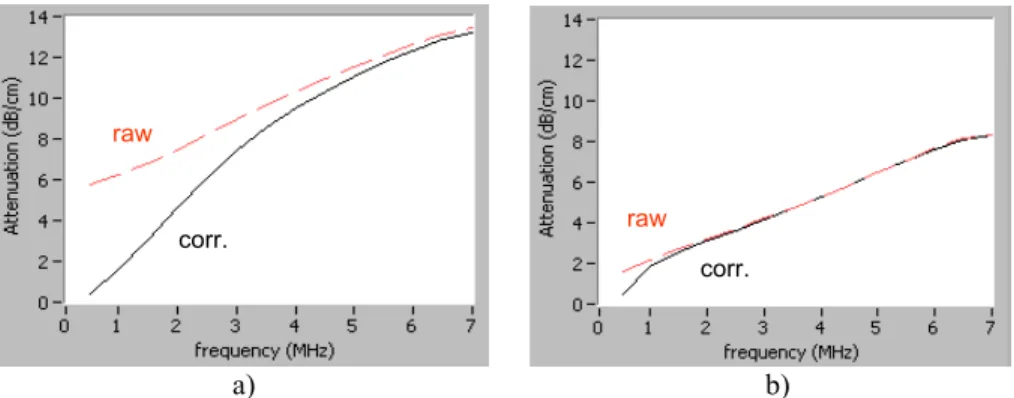
Additional experiments were performed with conventional and laser ultrasonics using different geometries for the generation and detection. With water immersion, Fig. 9 shows the attenuation obtained before and after diffraction correction in pulse-echo mode, using transducers of diameter 1/8 in (3.2 mm) and ½ in (12.7 mm) respectively located 10 mm and 150 mm from the composite sample. When corrected, the attenuation spectra are nearly identical, with a value of about 6 dB/cm at 4 MHz. From laser-ultrasonics, Fig. 10 show the attenuation obtained for generation spot diameters of 4 mm and 15 mm, inserting lenses of different focal lengths through the beam path. Clearly, a noticeable difference is observed even after diffraction correction. In the case of a large spot size (Fig. 10b), the diffraction correction is negligible as expected in the near field and a value of 5.5 dB/cm is found at 4 MHz, in close agreement with the one measured using immersion. With a small spot size (Fig. 10a), the attenuation appears overestimated in the whole frequency range and a value of 9.5 dB/cm is found at 4 MHz, where the diffraction correction is small. Such results are found insensitive to a change of the detection spot size after diffraction correction.
a) b)
FIGURE 9. Attenuation spectra with and without diffraction correction using immersion with a transducer of a) diameter 3.2 mm at a distance of 10 mm and b) diameter 12.7 mm at a distance of 150 mm.
a) b)
FIGURE 10. Attenuation spectra with and without diffraction correction using laser-ultrasonics with a generation laser diameter of a) 4 mm and b) 15 mm.
raw corr. raw corr. raw corr. raw corr.
CONCLUSION
Two approaches are presented for a more accurate attenuation measurement using laser-ultrasonics in fiber reinforced composites. First, a numerical correction for diffraction effect is proposed recording the laser multimode pattern with a pyroelectric camera. Alternatively, a modification of the laser resonator is presented to get a single transverse mode pattern and use a simpler diffraction correction. Both methods give similar results which however appear overestimated when compared with that of the conventional immersion technique. Several aspects were analyzed to explain the discrepancy, i.e. the presence of horizontal dipoles and the interference of different modes, but they were finally rejected as possible cause of the problem. However, evidence is made of still an effect of the laser generation spot size, a large spot providing an attenuation similar to the immersion case. We have found recently that the profile of the thin epoxy layer on each face of the sample we have used is composed of irregular valleys and peaks. Therefore, a more complex initial interaction of the laser with the surface of this sample may occur and enhance spreading of the acoustic wave. This will require further investigation and to verify the effect of surface characteristics, additional experiments with a carbon epoxy sample having smoother surfaces will be performed.
ACKNOWLEDGMENTS
The authors acknowledge that this work supported by the National Research Council of Canada was performed as partner in the project “Improved NDE Concepts for Innovative Aircraft Structures and Efficient Operational Maintenance” (INCA) of the European Commission, EC Contact no. G4RD-CT2001-00507.
REFERENCES
1. Scruby, C.B. and Drain, L.E., Laser-Ultrasonics: Techniques and Applications, Adam Hilger, Bristol, UK, 1990.
2. Monchalin, J.-P., IEEE Trans. Ultrason. Ferroelectrics and Freq. Cont. 33, 485 (1986).
3. Dubois, M., Militzer, M., Moreau A. and Bussière, J. F., Scripta Mater. 42, 867 (2000).
4. Dubois, M., Moreau, A. and Bussière, J.F., J. Appl. Phys. 89, 6487 (2001). 5. Kino, G.S., Acoustic waves, Prentice-Hall, Englewood Cliffs, NJ, 1987. 6. Monchalin, J.-P., Aussel, J.-D., J. Nondestr. Eval. 9, 211 (1990). 7. Ogi, H., Hirao, M. and Honda, T., J. Acoust. Soc. Am. 98, 1191 (1995).
8. Press, W.H., Teukolsky, S.A., Vetterling, W.T. and Flannery, B.P., Numerical Recipes
in Fortran, Cambridge Univ. Press, NY, 1992.
9. Telshow, K.L., Conant, R.J., J. Acoust. Soc. Am. 88, 1494 (1990).
10. Dubois, M., Enguehard, F., Bertrand, L., Choquet, M. and Monchalin, J.-P., Appl.
Phys. Lett. 64, 554 (1994).
11. Dubois, M., private communication.