Chaos game representation dataset of SARS-CoV-2 genome
The MIT Faculty has made this article openly available.
Please share
how this access benefits you. Your story matters.
Citation
Barbosa, Raquel de M. and Marcelo A.C.Fernandes. "Chaos game
representation dataset of SARS-CoV-2 genome." Data in Brief 30
(June 2020): 105618 © 2020 Elsevier
As Published
http://dx.doi.org/10.1016/j.dib.2020.105618
Publisher
Elsevier BV
Version
Final published version
Citable link
https://hdl.handle.net/1721.1/125023
Terms of Use
Creative Commons Attribution 4.0 International license
Contents lists available at ScienceDirect
Data
in
Brief
journal homepage: www.elsevier.com/locate/dib
Data
Article
Chaos
game
representation
dataset
of
SARS-CoV-2
genome
Raquel
de
M.
Barbosa
a
,
Marcelo
A.C.
Fernandes
b
,
c
,
1
,
∗
a MIT Department of Chemical Engineering, Massachusetts Institute of Technology, Cambridge, MA, 02142, USA b Laboratory of Machine Learning and Intelligent Instrumentation, IMD/nPITI, Federal University of Rio Grande do
Norte, Natal 59078-970, Brazil
c Department of Computer Engineering and Automation, Federal University of Rio Grande do Norte, Natal, RN,
59078-970, Brazil
a
r
t
i
c
l
e
i
n
f
o
Article history: Received 5 April 2020 Revised 17 April 2020 Accepted 20 April 2020 Available online 25 April 2020Keywords:
SARS-CoV-2 CGR COVID-19
a
b
s
t
r
a
c
t
As of April 16, 2020, the novel coronavirus disease (called COVID-19) spread to more than 185 countries/regions with more than 142,0 0 0 deaths and more than 2,0 0 0,0 0 0 con- firmed cases. In the bioinformatics area, one of the crucial points is the analysis of the virus nucleotide sequences us- ing approaches such as data stream, digital signal processing, and machine learning techniques and algorithms. However, to make feasible this approach, it is necessary to transform the nucleotide sequences string to numerical values repre- sentation. Thus, the dataset provides a chaos game repre- sentation (CGR) of SARS-CoV-2 virus nucleotide sequences. The dataset provides the CGR of 100 instances of SARS-CoV- 2 virus, 11540 instances of other viruses from the Virus-Host DB dataset, and three instances of Riboviria viruses from NCBI (Betacoronavirus RaTG13, bat-SL-CoVZC45, and bat-SL- CoVZXC21).
© 2020 The Author(s). Published by Elsevier Inc. This is an open access article under the CC BY license.
( http://creativecommons.org/licenses/by/4.0/)
∗ Corresponding author.
E-mail addresses: raquelmb@mit.edu (R.d.M. Barbosa), mfernandes@dca.ufrn.br (M.A.C. Fernandes).
1 Present address: John A. Paulson School of Engineering and Applied Sciences, Harvard University, Cambridge, MA
02138, USA.
https://doi.org/10.1016/j.dib.2020.105618
2352-3409/© 2020 The Author(s). Published by Elsevier Inc. This is an open access article under the CC BY license. ( http://creativecommons.org/licenses/by/4.0/ )
2 R.d.M. Barbosa and M.A.C. Fernandes / Data in Brief 30 (2020) 105618
Specification Table
Subject Biochemistry, Genetics and Molecular Biology (General) Specific subject area Bioinformatics
Type of data Table
Number
How data were acquired NCBI - Genbank - SARS-CoV2
https://www.ncbi.nlm.nih.gov/genbank/sars-cov-2-seqs/
Virus-Host-DBhttps://www.genome.jp/virushostdb/
Matlab Software Excel Software
Data format Raw and analyzed data are in Matlab file (.mat), Microsoft Excel file (.xlsx), and text file (.txt).
Parameters for data collection The entire dataset was generated using MATLAB 2019b on Windows operating system with Intel Core - i5 6500T 2.5 GHz quad-core processor with 16GB of RAM.
Description of data collection The raw data were downloaded from NCBI - Genbank, and Virus-Host-DB. The CGR values were generated using Matlab.
Data source location Laboratory of Machine Learning and Intelligent Instrumentation, IMD/nPITI, Federal University of Rio Grande do Norte.
Data accessibility https://data.mendeley.com/datasets/nvk5bf3m2f/1
Value
of
the
data
•
These
data
are
useful
because
they
provide
numeric
representation
of
the
COVID-2019
epi-demic
virus
(SARS-CoV-2).
With
this
form
of
the
data,
it
is
possible
to
use
data
stream,
digital
signal
processing,
and
machine
learning
algorithms.
•
All
researchers
in
bioinformatics,
computing
science,
and
computing
engineering
field
can
benefit
from
these
data
because
by
using
this
numeric
representation
they
can
apply
several
techniques
such
as
machine
learning
and
digital
signal
processing
in
genomic
information.
•
Data
experiments
that
use
clustering
and
classification
techniques
in
SARS-CoV-2
virus
ge-nomic
information
can
be
used
with
this
dataset.
•
These
data
represent
an
easy
way
to
evaluate
the
SARS-CoV-2
virus
genome.
1.
Data
Description
This
work
presents
a
new
dataset
of
a
chaos
game
representation
(CGR)
of
SARS-CoV-2
virus
nucleotide
sequences.
The
dataset
contains
two
kinds
of
data,
the
raw
data,
and
the
process-ing
data.
The
raw
data
is
composed
of
the
100
instances
of
the
SARS-CoV-2
virus
genome
col-lected
from
the
National
Center
for
Biotechnology
Information
(NCBI)
[1]
,
11540
instances
of
other
viruses
from
the
Virus-Host
DB
[2,3]
,
and
three
other
instances
of
Riboviria
also
collected
from
the
NCBI
(Betacoronavirus
RaTG13,
bat-SL-CoVZC45,
and
bat-SL-CoVZXC21).
Which
have
high
similarity
with
SARS-CoV-2
[4,5]
.
The
dataset
provides
two
groups
of
formats
files
for
all
data.
In
the
first
group,
all
data
are
stored
in
Matlab
file
format
(.mat),
and
in
the
second
group,
part
of
the
data
is
stored
in
Mi-crosoft
Excel
(.xlsx)
and
another
part
in
the
text
file
(.txt).
The
two
groups
have
the
same
in-formation.
The
data
is
organized
into
three
main
directories:
“SARS-CoV-2
data”,
“Virus-Host
DB
data” and “Other
viruses data.” Each main directory
is
formed
by
two
sub-directories:
“Matlab”
and
“Excel
and
txt.”
Each
sub-directory
“Matlab” contains
three
files
called
“RawDataTable.mat”,
“RawData.mat”
and
“CGRData.mat”.
“RawDataTable.mat” and
“RawData.mat” files
store
the
raw
data
information
from
the
viruses
database;
they
have
the
same
information,
however
in
the
“RawDataTable.mat”
the
attributes
are
stored
in
Matlab
table
format
(after
2013b
version)
and
in
“RawData.mat”
the
attributes
are
stored
in
Matlab
cell
arrays
format.
Each
“CGRData.mat” file
stores
the
CGR
values
of
all
viruses
presented
in
each
“RawDataTable.mat” and
“RawData.mat” file.
For
the
main
Barbosa and M.A .C. Fe rn a n d es / Dat a in Brief 30 (2020) 1 056 18 3
4 R.d.M. Barbosa and M.A.C. Fernandes / Data in Brief 30 (2020) 105618
directory
“Virus-Host
DB
data”,
the
CGR
values
are
stored
in
10
files
where
each
k
-th
file
is
called
“RawData_
k
.mat.”
Each
sub-directory
“Excel
and
txt” is
composed
of
a
file
and
another
sub-directory
called
“RawData.xlsx” and “CGRData”,
respectively.
Each
“RawData.xlsx” file
has
the
raw
data
informa-tion
from
the
viruses
database,
and
each
“CGRData” has
the
CGR
of
viruses
presented
in
each
“RawData.xlsx” file.
The
points
of
the
CGR
associated
with
each
virus
are
stored
in
a
text
file
called
“LocusName_
COD
.txt” where
COD
is
the
code
(locus
name)
associated
with
the
virus
in
Genbank
[6]
.
2.
Experimental
Design,
Materials,
and
Methods
The
Chaos
Game
Representation
(CGR),
proposed
by
H.
Joel
Jeffrey
in
[7]
,
transforms
the
nu-cleotide
sequence
(DNA
or
RNA)
to
bi-dimensional
real
values.
The
CGR
maintains
the
statistical
properties
of
the
nucleotide
sequence,
and
it
allows
an
investigation
of
the
local
and
global
pat-terns
in
sequences
[8,9]
.
The
CGR
has
with
input
the
nucleotide
sequence,
s
,
expressed
as
s
=
[
s
1,
.
.
.
,
s
n,
.
.
.
,
s
N]
(1)
where
N
is
the
length
of
sequence
and
s
nis
the
n
-th
nucleotide
of
the
sequence.
Each
n
-th
nucleotide,
s
n,
is
mapped
to
bi-dimensional
symbol
(
s
x(
n
),
s
y(
n
))
and
it
can
be
expressed
as
s
x(
n
)
=
⎧
⎪
⎨
⎪
⎩
1
for
s
n=
A
−1
for
s
n=
T
or
U
−1
for
s
n=
C
1
for
s
n=
G
(2)
and
s
y(
n
)
=
⎧
⎪
⎨
⎪
⎩
1
for
s
n=
A
1
for
s
n=
T
or
U
−1
for
s
n=
C
−1
for
s
n=
G
.
(3)
After
the
mapping,
each
n
-th
symbol
(
s
x(
n
),
s
y(
n
))
is
transformed
in
CGR
values
by
equations
expressed
as
p
x(
n
)
=
1
2
s
x(
n
)
+
1
2
p
x(
n
− 1
)
,
for
n
=
1
,
.
.
.
,
N
(4)
and
p
y(
n
)
=
1
2
s
y(
n
)
+
1
2
p
y(
n
− 1
)
,
for
n
=
1
,
.
.
.
,
N
(5)
where
for
the
initial
condition,
n
=
0
,
p
x(
0
)
=
α
xand
p
y(
0
)
=
α
y[7,8]
.
The
dataset
was
gener-ated
with
α
x=
0
and
α
y=
0
.
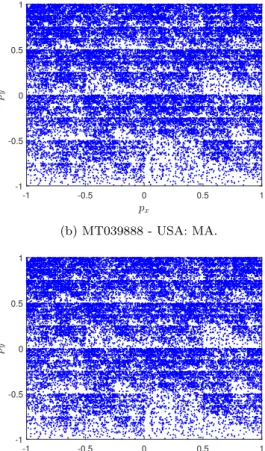
Figures
1
(a),
1
(b),
1
(c)
and
1
(d)
show
a
example
of
CGR
points
(
p
x(
n
),
p
y(
n
))
from
dataset
presented
in
this
work.
Acknowledgments
The
authors
wish
to
acknowledge
the
financial
support
of
the
Coordenação
de
Aperfeiçoa-mento
de
Pessoal
de
Nível
Superior
(CAPES)
for
their
financial
support.
Conflict
of
Interest
The
authors
declare
that
they
have
no
known
competing
financial
interests
or
personal
rela-tionships
that
could
have
appeared
to
influence
the
work
reported
in
this
paper.
Appendix
A.
Supplementary
data
Supplementary
data
to
this
article
can
be
found
online
at
https://data.mendeley.com/datasets/
nvk5bf3m2f/1
Supplementary
material
Supplementary
material
associated
with
this
article
can
be
found,
in
the
online
version,
at
10.1016/j.dib.2020.105618
References
[1] NCBI, SARS-CoV-2 (Severe acute respiratory syndrome coronavirus 2) Sequences, 2020, ( https://www.ncbi.nlm.nih. gov/genbank/sars-cov-2-seqs/ ).
[2] T. Mihara, Y. Nishimura, Y. Shimizu, H. Nishiyama, G. Yoshikawa, H. Uehara, P. Hingamp, S. Goto, H. Ogata, Linking virus genomes with host taxonomy, Viruses 8 (3) (2016), doi: 10.3390/v8030066 .
[3] Virus-Host DB, Virus-Host DB - Website, 2020, ( https://www.genome.jp/virushostdb ).
[4] G.S. Randhawa, M.P. Soltysiak, H.E. Roz, C.P. de Souza, K.A. Hill, L. Kari, Machine learning using intrinsic genomic signatures for rapid classification of novel pathogens: Covid-19 case study, bioRxiv (2020a), doi: 10.1101/2020.02.03. 932350 .
[5] G.S. Randhawa, M.P. Soltysiak, H.E. Roz, C.P. de Souza, K.A. Hill, L. Kari, Machine learning-based analysis of genomes suggests associations between wuhan 2019-ncov and bat betacoronaviruses, bioRxiv (2020b), doi: 10.1101/2020.02.03. 932350 .
[6] NCBI, Genbank, 2020, ( https://www.ncbi.nlm.nih.gov/genbank/ ).
[7] H. Jeffrey, Chaos game representation of gene structure, Nucleic Acids Research 18 (8) (1990) 2163–2170, doi: 10.1093/ nar/18.8.2163 .
[8] C. Yin, Encoding DNA sequences by integer chaos game representation. arXiv preprint arXiv: 1712.04546 , 2017. [9] T. Hoang, C. Yin, S.S.-T. Yau, Numerical encoding of dna sequences by chaos game representation with application in