READ THESE TERMS AND CONDITIONS CAREFULLY BEFORE USING THIS WEBSITE. https://nrc-publications.canada.ca/eng/copyright
Vous avez des questions? Nous pouvons vous aider. Pour communiquer directement avec un auteur, consultez la Questions? Contact the NRC Publications Archive team at
PublicationsArchive-ArchivesPublications@nrc-cnrc.gc.ca. If you wish to email the authors directly, please see the first page of the publication for their contact information.
NRC Publications Archive
Archives des publications du CNRC
This publication could be one of several versions: author’s original, accepted manuscript or the publisher’s version. / La version de cette publication peut être l’une des suivantes : la version prépublication de l’auteur, la version acceptée du manuscrit ou la version de l’éditeur.
Access and use of this website and the material on it are subject to the Terms and Conditions set forth at
A subjective evaluation of new acoustic measures in concert halls
using binaural simulation
Soulodre, G. A.; Bradley, J. S.
https://publications-cnrc.canada.ca/fra/droits
L’accès à ce site Web et l’utilisation de son contenu sont assujettis aux conditions présentées dans le site LISEZ CES CONDITIONS ATTENTIVEMENT AVANT D’UTILISER CE SITE WEB.
NRC Publications Record / Notice d'Archives des publications de CNRC:
https://nrc-publications.canada.ca/eng/view/object/?id=664f25b5-306c-49dd-9571-f002a85c9a3c https://publications-cnrc.canada.ca/fra/voir/objet/?id=664f25b5-306c-49dd-9571-f002a85c9a3chttp://www.nrc-cnrc.gc.ca/irc
A subje c t ive e va lua t ion of ne w a c oust ic m e a sure s in c onc e rt ha lls
using bina ura l sim ula t ion
N R C C - 3 8 8 1 4
S o u l o d r e , G . A . ; B r a d l e y , J . S .
J u n e 1 9 9 4
A version of this document is published in / Une version de ce document se trouve dans:
Proceedings Sabine Centennial Symposium, Cambridge, Mass., U.S.A. June 01,
1994, pp. 271-274
The material in this document is covered by the provisions of the Copyright Act, by Canadian laws, policies, regulations and international agreements. Such provisions serve to identify the information source and, in specific instances, to prohibit reproduction of materials without written permission. For more information visit http://laws.justice.gc.ca/en/showtdm/cs/C-42
Les renseignements dans ce document sont protégés par la Loi sur le droit d'auteur, par les lois, les politiques et les règlements du Canada et des accords internationaux. Ces dispositions permettent d'identifier la source de l'information et, dans certains cas, d'interdire la copie de documents sans permission écrite. Pour obtenir de plus amples renseignements : http://lois.justice.gc.ca/fr/showtdm/cs/C-42
2aAAe3
セ WJ\LLACE CLEMENT SABINE CENTENNIAL SYMPOSIUM ,
)
CAMBRIDGE, MASSACIIUSElTS, USA 5 TO 7 JUNE,1994
A SUBJECTIVE EVALUATION OF NEW ACOUSTIC
MEASURES IN CONCERT HALLS USING BINAURAL
SIMULATION
Gilbert
A.
Soulodre* and John S. Bradley**
*McGiII University, Montreal, Canada, H3A 1E3
--Acoustics Laboratory, National Research Council, Ottawa, Canada, K1A OR6
1. INTRODUCTION
About a h,undred years have passed since Sabine proposed his measure of reverberation time as a predictor of the acoustic quality of a concert hall. Since then, as a result of extensive research and our ability to make increasingly precise acoustical measurements, researchers have proposed many other objective measures as predictors of a concert hall's acoustic quality. In this paper, a series of experiments were conducted to evaluate the suitability of several acoustical measures as predictors of subjective judgements. Subjects were asked to rank binaurally reproduced sound fields in terms of reverberance, clarity, loudness, envelopment, treble, bass, apparent source width, and overall preference. The binaural impulse responses were measured in several North American concert halls and were chosen so as to cover as broad a range as possible with respect to RT60, EDT, C80, G, IACC and LF values. The results of these tests were then correlated with the various objective measures on an octave band basis to find the best predictor of each subjective parameter. The relative importance of the various subjective parameters to the overall preference of these sound fields was also examined.
2. EXPERIMENTAL PROCEDURE
The subjective experiments were conducted using a binaural simulator system. The value of this experimental approach has been demonstrated in a past study [1] and the validity of the present system for use in エセゥウ type of study has been demonstrated in previous work by the authors [2]. A detailed description of the present system is given in [3].
Sound fields were produced by convolving anechoic music with binaural impulse responses measured using a Brliel and Kjrer Type 4128 Head and Torso Simulator. A 15 second passage of Mozart's, "Le Nozze di Figaro" was used for the tests. The resultant sound fields were played back to listeners over a pair of loudspeakers.
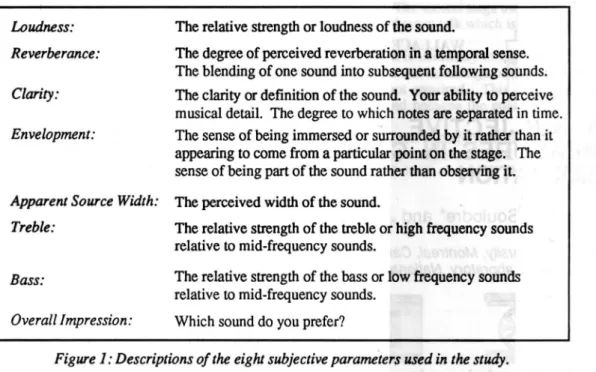
The subjective testing was in the form of double-blind paired comparison tests. A computer provided random playback of pairs of sound fields. The stimulus was played repeatedly by the computer allowing subjects to switch back and forth between the two sound fields for as long as they required in order to make their decision. The subjects' responses were automatically recorded by the computer. Unlike the study by Schroeder, Gottlob, and Siebrasse. subjects in the present study were not asked to simply identify which sound field they preferred. Rather, in this study. subjects conducted eight separate sets of listening tests and were asked to rank the sound fields in terms of reverberance, clarity, loudness. envelopment, treble. bass, apparent source width, and overall preference. This list of parameters was based on the one used by Barron in his subjective study of eleven British concert halls [4]. Prior to each test, a description of the parameter under test was read to the subject (see Figure 1).
Ten subjects participated in each of the eight experiments. All of the subjects had previous experience in critical ,listening tests and almost all had extensive musical training. To ensure that they fully understood theirtask. subjects were given a brief training sequence prior to each test
2aAAe3
Loudness:
Reverberance:
Clarity:
Envelopment:
Apparent Source Width:
Treble:
Bass:
Overall Impression:
Soulodre et al.
The relative strength or loudness of the sound.
The degree of perceived reverberation in a temporal sense. The blending of one sound into subsequent following sounds. The clarity or definition of the sound. Your ability to perceive musical detail. The degree to which notes are separated in time. The sense of being immersed or surrounded by it rather than it appearing to come from a particular point on the stage. The sense of being part of the sound rather than observing it. The perceived width of the sound.
The relative strength of the treble or high frequency sounds relative to mid-frequency sounds.
The relative strength of the bass or low frequency sounds relative to mid-frequency sounds.
Which sound do you prefer?
Figure 1: Descriptions of the eight subjective parameters used in the study.
A preliminary study was carried out prior to the final study. The purpose of this preliminary study was to verify that the process would provide meaningful results and to identify any procedural issues in the experiments. Eight sound fields were used in the preliminary study and two more were added to the final study so as to more thoroughly cover the ranges of all the objective parameters. The results shown here are from the preliminary study. The results of the final study including a complete analysis will be given at thepresentation.
3.
RESULTS
(
Sound fields were chosen from a large database of measurements made in North American concert halls. Since the main goal of the study was to evaluate various objective measures as predictors of subjective opinion, sound fields were chosen to encompass as much of the full ranges of each of the objective measures as possible. The objective measures of interest were; RT60, EDT, e80, G, LF, and lACe. Therefore, ten sound fields were chosen such that the full range (as found in actual concert halls) of each of these objective parameters would be included.
100 R=0.978 :: 80 Q> c:: 'Q セ 60
...
'Q Nセ 40 Q> U...
If
20 0'---'---1-...- 0 1 0 _...---1... 1 2 3 4 5 6G dB (average over all octaves)
2aAAe3 The イセウオャエウ from the, loudness experiment are given in Figure 2. The figure shows the ranking of perceived loudness versus the measured values of G. The values of G consist of the average of the octave bands from 125Hz to 4kHz. Clearly there is a very strong correlation (R=O.978) between the subjective and objective results. If however, the abscissa of Figure 2 is replaced with the average value of G measured across the octave bands from 250Hz to 2kHz, then the correlation is even higher (R=O.987). This suggests that, while a broadband measure of G performs very well as a predictor of loudness, a better predictor might be obtained by excluding certain frequency bands. It should be noted that the vertical axis does not have any units.
3.2 Reyerberance
o
O L . - - - L -..._'"""-_oL...---L_...----'
2.2 2.3 2.4 2.5
RT60 s (average over all octaves)
Figure
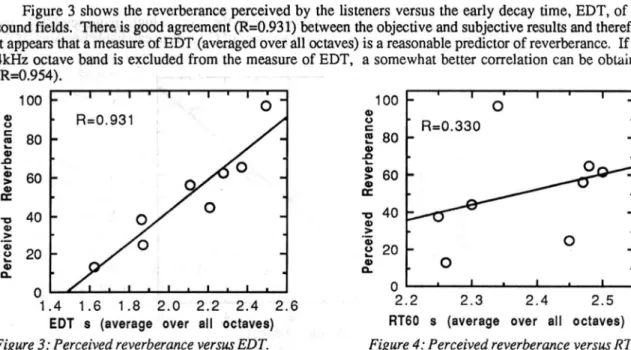
4:Perceived reverberance versus RT60.
'Q 40 CI) > 'Q) 20 0 u
..
CI) 0 CL 100 CI) u c セ 80 CI) .0...
セ 60 CI) セ CI) R=0.931 u c 80 III...
CI) .0 Q) 60 > CI) セ 'Q 40 CI) > 'Q) 20 u...
CI) CLFigure 3 shows the reverberance perceived by the listeners versus the early decay time, EDT, of the sound fields. tィ・イセ is good agreement (R=O.931) between the objective and subjective results and therefore it appears that a measure of EDT (averaged over all octaves) is a reasonable predictor of reverberance. If the 4kHz octave band is excluded from the measure of EDT, a somewhat better correlation can be obtained (R=O.954).
100 イMBNNNNNNNLイBBGBBQMNNLNMMイセNNNNLNNBBBtBBBGtBNLNNNMイMNL
OL...-'--"---'--""--'"""-...-&...
1.4 1.6 1.8 2.0 2.2 2.4 2.6
EDT s (average over all octaves)
Figure
3:Perceived reverberance versus
EDT.Figure 4 shows the perceived reverberance plotted against the measured values of RT60. It can be seen that the correlation is very low in this case (R=O.330). Part of this poor correlation canbeexplained by the rather small range of RT60's included in the preliminary experiment. The final experiment includes additional sound fields to expand the range. Regardless of this however, it is clear that EDT performs far belter than RT60 as a predictor of perceived reverberance.
OL.-..L-...&.---Io_L.-..L-...-L...&.---Io----l
-4 -3 -2 -1 0 2
CaD dB (SOD-4kHz)
Figure
6: Perceived clarity versus
C80averagedfrom
500Hz
to
4kHz. 3.3 Clarity 100 100 R=0.552 R=0.930 0 セ 80 セ 80 .;: .;: III III 0 60 U 60 'Q 'Q CI) CI)•
> > 'Q) 40 'Q) 40 セ u..
CI) CI) CL CL 20 20 0 OL...--'--""--'"""-...-&...&.--L---l'--'L...-L...I -4 -3 -2 -1 0 1 2CaD dB (average over all octaves)
Figure
5: Perceived clarity versus
C80averaged
over all octave bands.
2aAAe3
Soulodre et ale
Figure 5 shows the perceived degree of clarity plotted against C80 averaged over the 125Hz to 4kHz octave bands. In this case we see that the correlation is not very strong (R=O.552). However, if only the octave bands from 500Hz to 4kHz are used in measuring C80, the correlation increases (R=O.602). This is shown in Figure 6. It seems reasonable that the lower octave bands may not contribute to a listener's perception of clarity.
There is one sound field which seems to be an outlier (indicated by the black square). When this data point is excluded, the correlation increases significantly (R=O.930). An examination of the impulse response for this sound field revealed two very strong reflections. Although both reflections arrive within 80ms of the direct sound, it may be that they are in some way reducing the perceived clarity.
3.4 Treble
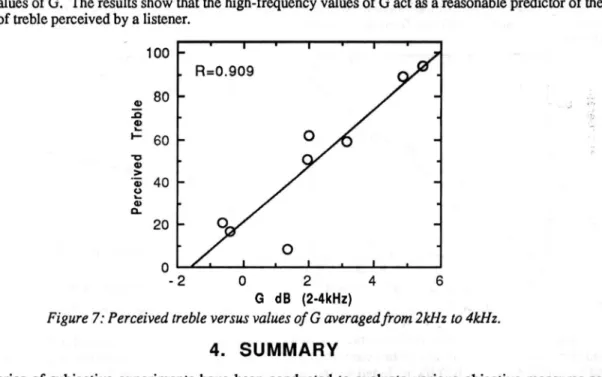
Figure 7 shows the perceived level of treble frequencies versus the average high-frequency (2kHz and 4kHz) values of G. The results show that the high-frequency values of G act as a reasonable predictor of the amount of treble perceived by a listener.
100 R=0.909 Q) 80 ',', 1) Q)
...
t- 60 "0 Q) > 'G) 40 u...
Q) Q. 20 0 OL...-';...&._...MMMMi⦅NNNNNlN⦅BBGMMMMl⦅MGMセ -2 0 2 4 6 G dB (204kHz)Figure
7:Perceived treble versus values ofG averaged from 2kHz to 4kHz.
4.
SUMMARY
A series of subjective experiments have been conducted to evaluate various objective measures as predictors of subjective opinion. The results of the preliminary study indicate that a broadband measure of G performs well as a predictor of loudness. Also, the broadband mea'sure of EDT is a good predictor of perceived reverberance. Improved correlation between objective and subjective results can be obtained for some parameters if certain frequency bands are excluded from the measurements. The results from the full study and a complete statistical analysis will be given in the presentation.
ACKNOWLEDGMENTS
The authors are grateful to the Concert Hall Research Group for their support in this work.
REFERENCES
[1] "Comparative study of European concert halls: correlation of subjective preference with geometric and acoustic parameters", M.R. Schroeder, D. Gottlob, and K.F. Siebrasse, Journal of the Acoustical Society of
America,S6 (4), 1195-1201 (1974).
[2] "Spaciousness judgments of binaurally reproduced sound fields," G.A. Soulodre, J.S. Bradley, and D.R. Stammen, presented at the 125th meeting of the Acoustical Society of America, Ottawa (1993).
[3] "A binaural simulator for conducting subjective studies of concert hail acoustics," G.A. Soulodre and D.R. Stammen, presented at the Sabine Centennial Symposium of the 127th meeting of the Acoustical Society
of America, Cambridge (1994).