Publisher’s version / Version de l'éditeur: PERD/CHC Report 20-34, 1997-10
READ THESE TERMS AND CONDITIONS CAREFULLY BEFORE USING THIS WEBSITE.
https://nrc-publications.canada.ca/eng/copyright
Vous avez des questions? Nous pouvons vous aider. Pour communiquer directement avec un auteur, consultez la première page de la revue dans laquelle son article a été publié afin de trouver ses coordonnées. Si vous n’arrivez pas à les repérer, communiquez avec nous à PublicationsArchive-ArchivesPublications@nrc-cnrc.gc.ca.
Questions? Contact the NRC Publications Archive team at
PublicationsArchive-ArchivesPublications@nrc-cnrc.gc.ca. If you wish to email the authors directly, please see the first page of the publication for their contact information.
NRC Publications Archive
Archives des publications du CNRC
For the publisher’s version, please access the DOI link below./ Pour consulter la version de l’éditeur, utilisez le lien DOI ci-dessous.
https://doi.org/10.4224/12340998
Access and use of this website and the material on it are subject to the Terms and Conditions set forth at
A Review of the Environmental Conditions on the West Coast of Newfoundland
Pilkington, R.; Hill, C.; Langford, L.
https://publications-cnrc.canada.ca/fra/droits
L’accès à ce site Web et l’utilisation de son contenu sont assujettis aux conditions présentées dans le site LISEZ CES CONDITIONS ATTENTIVEMENT AVANT D’UTILISER CE SITE WEB.
NRC Publications Record / Notice d'Archives des publications de CNRC:
https://nrc-publications.canada.ca/eng/view/object/?id=b12fbf69-2c27-4946-8efa-b67b620d072b https://publications-cnrc.canada.ca/fra/voir/objet/?id=b12fbf69-2c27-4946-8efa-b67b620d072b
A REVIEW OF THE
ENVIRONMENTAL CONDITIONS
ON THE
WEST COAST OF NEWFOUNDLAND
for
NATIONAL RESEARCH COUNCIL CANADA
File Number: RFP C57-234248
by
Roger Pilkington, Chris Hill, and Colin Langford
CANATEC Consultants Ltd.
220, 1414 - 8
thSt SW
Calgary, Canada, T2R 1J6
October, 1997
ABSTRACT
A study of the available environmental data for the West Coast of Newfoundland has been carried out. Data have been obtained from a variety of sources, but there are limited in-situ measurements for the area of interest. Data for the area have been used where available,
otherwise, generic data from other locations have been used to fill data gaps where possible. The tables below summarize the major findings.
Climate and Oceanography
Item Value Unit
s
Extreme Winds, 100 year / 20 year 42 / 37 m/s
Wind exceedence, 80% / 50% / 20% of time 5 / 8.5 / 12 m/s
Winds, predominant direction West and Southwest
Gust wind, maximum winter / maximum summer 48 / 20 m/s
Air temperature, mean: minimum winter / maximum. summer -8 / +15 °C Air temperature: minimum winter/maximum summer(in 17
years)
-40 / +20 °C
Wave height, 100 year, significant / maximum 10.6 / 19.8 m
Wave period for 100 year wave 13-14 sec
Wave height, 10 year, significant / maximum 8.5 / 16.0 m
Significant wave exceedence, 80/50/20 % of time 1 / 1.5 / 2.5 m
Predominant wave direction To East
Water salinity at surface, summer/winter 31 / 32 ppt
Water salinity at 50 m depth, summer/winter 32 / 32 ppt
Water temperature at surface, summer/winter 14 / -1.8 °C
Water temperature at 50 m depth, summer/winter 2 / 0 °C
Currents at surface, nearshore, average / maximum 0.05 / 0.65 m/s
Currents at surface, off shore, average / maximum 0.5 / 1 m/s
Tidal variation (large tides) 1.6 to 2.3 m
Fog, days per year (typical) 38 days
Ice Parameters
Item Values Units
Freeze-over dates, North, earliest/mean/latest 4 Jan / 18 Jan / 3 Feb Freeze-over dates, Centre, earliest/mean/latest 22 Jan / 31 Jan /9 Feb Freeze-over dates, South, earliest/mean/latest 6 Feb / 14 Feb / 8 Mar Ice clearance dates, North, earliest/mean/latest 18 Mar/23 Apr/18 May Ice clearance dates, Centre, earliest/mean/latest 18 Mar / 15 Apr / 8 May Ice clearance dates, South, earliest/mean/latest 11 Mar / 8 Apr / 27 Apr
Ice covered period, median - North/Centre/South 95 / 74 / 54 days Open water period, median - North/Centre/South 270 / 291 / 311 days
Ice drift speed, mean / maximum 0.14 / 0.53 m/s
Ice drift direction, predominant (towards) Northeast & Southeast
Level ice thickness, typical annual maximum 0.8 m
Level ice thickness, estimated maximum 1.5 m
Level ice temperature, mean / minimum -2.5 /-13.5 °C
Level ice salinity, typical 4.5 to 5.5 ppt
Level ice density, typical 0.91 Mg-m-3
Level ice flexural strength, mean / maximum 150 / 672 kPa
Level ice horizontal compressive strength, mean / maximum 2.5 / 3.5 MPa Ridge sail height, typical average / typical maximum 0.7 / 2.8 m Ridge frequency, average number/km, North/Centre/South 26 / 6 / 5 /km Ridge frequency, maximum number/km, North/Centre/South 55 / 28 / 59 /km Consolidated layer thickness, typical annual / typical
maximum
1 / 2 m
Consolidated layer ice temperature, typical -2.5 °C
Consolidated layer salinity, typical 4.5 ppt
Consolidated layer density, typical 0.92 Mg-m-3
Ridge keel porosity, typical (range) 28 % (10 to 40%)
Icebergs and growlers Few approx. every 2
years. Generally stay to north along the Quebec shore
Soils Parameters
Item Value
Bathymetry The 100 m contour is close to shore at the
north end of region of interest, 50 to 70 km from shore at Port au Port, and within 3 km from shore off Port aux Basques.
Soil types south region (south of Port au Port Peninsula)
Pelite, sandy pelite, typically 5 m thick but up to 20 m thick. In east end of St George’s Bay sediments over 50 m thick.
Soil types central region (Port au Port to Bonne Bay)
Gravelly pelitic sand and gravelly poorly sorted sand, with sandy gravel and gravelly poorly sorted sand near shore. Sediments generally less than 20 m thick, but can reach 60 m or more in Bay of Islands.
Soil types north region (north of Bonne Bay) Sandy gravel, with narrow strip of gravelly poorly sorted sand in water depths of less than 20 m.. North of Hawkes Bay, sandy pelite and pelitic sand predominate. Soil shear strengths - pelites Typically 2 to 5 kPa at surface
Ice scour No measurements in shallow water, but it is
expected that seafloor will be saturated with scours in less than 10 m water depth. Relic scours in water over 100 m.
RECOMMENDATIONS
There is a lack of information on the ice conditions along the West Coast of Newfoundland; no systematic, on-ice measurements are available. The extreme waves, which will cause major loads on offshore structures, are predicted (hindcast) from wind data for the area; there are no actual wave measurements available to verify the predictions. There is no scour data for the area. Such data are essential for the design of well heads and subsea pipelines. Site specific soils data are required, however, these data can be obtained when exact production locations are known.
Specific recommendations are as follows:
1. There is a serious lack of physical and mechanical data for the ice in the area of interest, and a field program in the area should be conducted to collect the following information at various locations along the coast:
1.1 Information is required on ice thickness. Systematic on-ice measurements should be carried out in March and April at several locations along the coast.
1.2 The AES Ice Charts indicate the occasional presence of old ice in the area. This should be confirmed and the size and thickness of the old ice floes determined. 1.3 There is no information on the mechanical properties of ice in the area.
Measurements of temperature and salinity should be carried out as these allow determination of ice strength. Actual ice strength measurements from the area would be useful for confirmation of the calculated values.
1.4 Ridge heights in this study are based on laser profilometer data plus empirical relationships between ice thickness and ridge height. As ridges are important in the determination of extreme loads, a field program should be conducted to measure sail heights, keel depths, consolidation, porosity, and ridge sail block sizes.
1.5 Numbers and sizes of ridges are also required for load probability analyses. An upward looking ice keel profiler placed on the seabed would provide invaluable data on the number and size of ridge keels and ice movement throughout the winter, plus currents and wave heights. The Institute for Oceanographic Sciences in Victoria, BC, should be encouraged to conduct such measurements as they have developed the equipment.
1.6 As first year ridges are likely to be major hazards for any offshore structure, further theoretical work is required on the determination of ice loads generated by such ridges. Measurements of ridge keel strengths should be carried out, for comparison with the theory.
1.7 There are no actual measurements of ice drift in the area. Such measurements are needed to gain a complete picture of the frequency and magnitude of ice loading events. Satellite drift buoys (e.g., Argos buoys) placed on the ice in February would provide ice drift data with good time resolution. Also, profilers as mentioned in 1.5 above will provide ice drift data at or near the area of interest.
2. Wave heights are predicted from wind measurements; there are no actual wave
those generated by ice), the Marine Environmental Data Services (MEDS) should be encouraged to extend their summer wave measurement programs into the area. An
oceanographic buoy located off Port au Port, would provide valuable data in the area of most current activity.
3. There is no data on offshore currents. MEDS should be encouraged to continue their measurements in this area.
4. Soil shear strengths are very low. When a production site has been selected based on drilling results, detailed soil testing will be required to determine the type, strength and depth of the surface sediments at the exact location. Such measurements are required prior to preliminary engineering design. No long term data collection program is needed, although samples gathered on an opportunity basis would be helpful to clarify the soil types and strengths to be expected.
5. There is no ice scour data for the area. Measurements should be made in the early summer (before the scours are eroded away), from potential production site locations to shore in locations where pipelines may be installed.
6. Due to limited resources, not all available iceberg data have been obtained from AES. These data should be obtained for a more thorough analysis of icebergs.
7. The cooling trend, which has been observed over the past few years, should be investigated and its potential effects considered. Such a trend could increase the thickness of level ice and of the consolidated layer in first ridges.
ACKNOWLEDGEMENTS
The authors of this project wish to acknowledge the help and support of a number of people and organizations. The project manager, Gary Timco, provided numerous helpful suggestions and data. Maria MacLeod and her staff in the Client Services department at the Canadian Ice Service in Ottawa were extremely helpful when we went to Ottawa to review data for this project, and in fulfilling our data requests. Numerous researchers at the Bedford Institute of Oceanography (Ken Drinkwater, Gary Sonnichsen, Bob Harms, and Brian Petrie) provided oceanographic and soils data for the project. Canadian Coast Guard personnel (Andy Mollet, Barbara O’Connell, and Alan Rowsell) provided first hand knowledge of the ice in the area and photographs. Paul Spencer, manager of the contract, provided a variety of data and reviewed the various versions of the report. Michel Metge provided advice on all aspects of the project and assisted with editing. Ron Ritch provided valuable advice on various aspects of the data and assistance with technical problems.
TABLE OF CONTENTS
1. INTRODUCTION ... 1-1 1.1BACKGROUND &RATIONALE... 1-1 1.2OBJECTIVE... 1-1 1.3APPROACH... 1-3 2. ICE... 2-1 2.1GENERAL... 2-1
2.1.1 Daily Ice Conditions and Variations ... 2-8 2.1.2 Ice Morphology... 2-8
2.2FREEZE-UP AND BREAK-UP... 2-19 2.3ICE THICKNESS... 2-20 2.4LANDFAST ICE... 2-23 2.5PRESSURE RIDGES... 2-23
2.5.1 Maximum Pressure Ridge Sail Heights ... 2-26 2.5.2 Ridge Keel Depth ... 2-26 2.5.3 Ridge Porosity and Consolidation ... 2-27 2.5.4 Ridge Keel Geometry ... 2-27 2.5.5 Ridge Impact Rates ... 2-28
2.6RUBBLE FIELDS... 2-29 2.7MULTI-YEAR ICE... 2-29 2.8ICE DRIFT... 2-29 2.9ICEBERGS... 2-32
2.9.1 General ... 2-32 2.9.2 Iceberg Impact Rate ... 2-35
2.10LEADS AND POLYNYA... 2-37 2.11ICE PROPERTIES... 2-38
2.11.1 Ice Temperature ... 2-38 2.11.2 Salinity ... 2-39 2.11.3 Density ... 2-42 2.11.4 Ice Flexural Strength ... 2-42 2.11.5 Ice Compressive Strength... 2-43
2.12OTHER ICE DATA NOT USED IN THIS STUDY... 2-44 3. CLIMATE ... 3-1 3.1GENERAL... 3-1 3.2TEMPERATURE... 3-1 3.3WINDS... 3-1 3.4PRECIPITATION... 3-6 3.5VISIBILITY... 3-6 4. OCEANOGRAPHY ... 4-1 4.1GENERAL... 4-1 4.2WATER EXCHANGE... 4-1 4.3WATER TEMPERATURE AND SALINITY... 4-2 4.4WAVES... 4-2 4.5TIDES AND TIDAL CURRENTS... 4-11 4.6LOCAL CURRENTS... 4-11 5. GEOTECHNICAL ... 5-1 5.1BATHYMETRY... 5-1 5.2SEABED SEDIMENTS... 5-1
5.3SOIL STRENGTHS... 5-5 5.4SEDIMENT THICKNESS... 5-8 5.5ICE SCOUR... 5-8 5.6SEISMIC ACTIVITY... 5-8 6. CONCLUSION ... 6-1 6.1GENERAL... 6-1 6.2CLIMATE TRENDS... 6-2 7. REFERENCES ... 7-1 A.DESCRIPTION OF ICE CONDITIONS FOR TWO YEARS...A-1
A.1ICE SEASON OF 1994-1995 ...A-1 A.2ICE SEASON OF 1995-1996 ...A-7
FIGURES
Figure 1-1: Map showing the West Coast of Newfoundland and land interests in the area... 1-2 Figure 2-1: Minimum, Medium, and Maximum Ice Edges on December 11... 2-9 Figure 2-2: Minimum, Medium, and Maximum Ice Edges on January 1... 2-10 Figure 2-3: Minimum, Medium, and Maximum Ice Edges on January 15... 2-11 Figure 2-4: Minimum, Medium, and Maximum Ice Edges on January 29... 2-12 Figure 2-5: Minimum, Medium, and Maximum Ice Edges on February 19... 2-13 Figure 2-6: Minimum, Medium, and Maximum Ice Edges on March 5... 2-14 Figure 2-7: Minimum, Medium, and Maximum Ice Edges on March 19... 2-15 Figure 2-8: Minimum, Medium, and Maximum Ice Edges on April 2... 2-16 Figure 2-9: Minimum, Medium, and Maximum Ice Edges on May 14... 2-17 Figure 2-10: Minimum, Medium, and Maximum Ice Edges on June 18... 2-18 Figure 2-11: Summary of freeze-up and break-up along the outer West Coast of
Newfoundland and at Corner Brook. ... 2-19 Figure 2-12: Ice Growth based on measurements made in the Humber Arm, Corner
Brook. ... 2-21 Figure 2-13: Number of ridge sail per km off the West Coast of Newfoundland (based on
AES laser profilometer data, 1974-1981)... 2-25 Figure 2-14: Typical first year ridge geometry (from Timco and Burden, 1996) ... 2-28 Figure 2-15: Percent frequency of ice drift direction at three areas along the West Coast
of Newfoundland ... 2-30 Figure 2-16: Percentage directional frequency of ice drift by displacement, in m/s,
Central coastal area. ... 2-31 Figure 2-17: Exceedence frequency of ice drift rates at three coastal areas along the West
Coast of Newfoundland... 2-32 Figure 2-18: Locations of the six iceberg observation zones ... 2-34 Figure 2-19: Iceberg observations off the West Coast of Newfoundland, 1960 to 1977
and 1984 to 1994, by year ... 2-35 Figure 2-20: Percentage exceedence frequency of duration of shore lead conditions, for
ice on West Coast of Newfoundland. ... 2-38 Figure 2-21: Bulk Salinity versus ice thickness in first year ice ... 2-40 Figure 2-22: Salinity and density measurements from Langleben (1959) for Shippegan,
N.B. ... 2-41 Figure 3-1: Daily Temperature Statistics for Daniel’s Harbour ... 3-2 Figure 3-2: Daily Temperature Statistics for Stephenville ... 3-2 Figure 3-3: Annual Wind Statistics for NE Gulf of St. Lawrence... 3-3 Figure 3-4: Monthly Wind Direction Statistics ... 3-4 Figure 3-5: Monthly Wind Direction Statistics ... 3-5 Figure 4-1: Dominant horizontal surface circulation in the Gulf and Estuary (White and
Johns, 1997)... 4-2 Figure 4-2: Temperature and Salinity for Subarea 2 ... 4-3 Figure 4-3: Temperature and Salinity for Subarea 3 ... 4-4 Figure 4-4: Gulf of St. Lawrence Oceanographic Subareas ... 4-5 Figure 4-5: Annual Wave Statistics for North-East Gulf of St. Lawrence ... 4-6
Figure 4-6: Annual Wave Statistics for the North-East Gulf of St. Lawrence ... 4-7 Figure 4-7: Monthly Wave Direction Statistics for the North-East Gulf of St. Lawrence ... 4-8 Figure 4-8: Monthly Wave Direction Statistics for the North-East Gulf of St. Lawrence ... 4-9 Figure 4-9: Significant Wave Height Statistics ... 4-10 Figure 5-1: Surface Sediment Texture... 5-2 Figure 5-2: Seabed Sediments ... 5-3 Figure 5-3: Bedrock Geology ... 5-4 Figure 5-4: Core Sample and Section Locations ... 5-6 Figure 5-5: Response Spectrum for the West Coast of Newfoundland (from Atkinson et
TABLES
Table 2-1: Mean and maximum measured ice thicknesses in the general area of interest ... 2-21 Table 2-2: Ice thickness measurements made by ice observer on John A MacDonald... 2-22 Table 2-3: Recommended ice thicknesses for area of interest... 2-23 Table 2-4: Ridge statistics for laser profilometer data for West Coast of Newfoundland... 2-24 Table 2-5: Ridge height statistics for AES laser profilometer data for West Coast of
Newfoundland ... 2-24 Table 2-6: Ridge Parameters for the West Coast of Newfoundland... 2-27 Table 2-7: Percentage directional frequency of ice drift by displacement in nautical
miles/day, Central coastal area... 2-31 Table 2-8: Proportion of offshore and onshore ice drift along the West Coast of
Newfoundland. ... 2-32 Table 2-9: Listing of Iceberg sightings in the zones indicated in Figure 2-18. The
symbols are explained in the text. ... 2-33 Table 2-10: Iceberg impact Probabilities for 4 zones along the West Coast of
Newfoundland over the 25 year life of a structure... 2-36 Table 2-11: General statistics on shore lead occurrence and duration at three locations
along the West Coast of Newfoundland... 2-37 Table 2-12: Sea ice temperatures for ice at about 48° north latitude, on the West Coast of
Newfoundland. ... 2-39 Table 2-13: Bulk salinities for two different ice thicknesses for ice on the West Coast of
Newfoundland. ... 2-40 Table 2-14: Recommended ice density values for ice on the West Coast of
Newfoundland. ... 2-42 Table 2-15: Calculated flexural strength values for ice on the West Coast of
Newfoundland. ... 2-43 Table 2-16: Uniaxial compressive ice strength values based on analysis of small scale
tests... 2-44 Table 3-1: Percentage exceedence winds for the West Coast of Newfoundland ... 3-1 Table 3-2: Extreme winds on West Coast of Newfoundland ... 3-6 Table 4-1: Percentage Exceedence Wave Heights and Periods... 4-2 Table 4-2: Extreme Wave Heights:... 4-2 Table 4-3: Summary of current meter readings for two sites on West Coast of
Newfoundland ... 4-12 Table 5-1: Example of soil strengths for pelite in the general area of interest. ... 5-7
PHOTOGRAPHS
Photo 1: Typical ice conditions on the West Coast of Newfoundland, March... 2-3 Photo 2: Ice conditions on West Coast of Newfoundland, March... 2-3 Photo 3: Light ice conditions on West Coast of Newfoundland, March, with boat in tow ... 2-4 Photo 4: Heavy ice conditions, April 29, 1995... 2-4 Photo 5: Vessel ramming large ridge sail, ... 2-5 Photo 6: Synthetic Aperture Radar imagery for 12 February, 1994 ... 2-6 Photo 7: Synthetic Aperture Radar imagery for 12 March, 1994 ... 2-7
1. INTRODUCTION
1.1 Background & RationaleThe pace of offshore activities off the West Coast of Newfoundland has increased significantly in 1996 and 1997, as indicated below.
• January, 1996, Minister of Natural Resources for Newfoundland and Labrador announces that IEXCO will acquire seismic data in the Bay of Islands/Humber Arm area.
• February, 1996, Minister announces that Talisman will drill a directional well off Cape St George.
• March 5, 1996, Minister announces a Call for Bids on four parcels off the West Coast of Newfoundland.
• May 15, 1996, Hunt and PanCanadian spud a well east of St George’s Bay, using a jackup rig.
• February 1997, a port is planned for St George’s Bay, to support the offshore actively in the area.
• May, 1997, a Call for Bids is made by the Canada-Newfoundland Offshore Petroleum Board for three parcels of land off the West Coast of Newfoundland.
• 1997, PanCanadian plans to drill a directional well off the West Coast Newfoundland. BHP, Mobil, Hunt, and other major oil companies have acquired land off the West Coast of Newfoundland as indicated in the figure to the right, representing this study’s area of interest. Up to this time, the offshore wells drilled in the area have taken advantage of the open water period, typically 311 days during the summer season. Once commercially viable quantities of oil are confirmed, there will be a need to consider year-round production, and this will require operating throughout the winter, ice covered season. Although this area is considered a
“temperate” ice zone, systems suitable for operating offshore year round will have to withstand harsh ice and climatic conditions.
The purpose of this PERD (Program for Energy Research and Development) funded study is to review of the environmental conditions off the West Coast of Newfoundland. This is being carried out in conjunction with a second study to evaluate structures suitable for operating seasonally or year round in the area. “Recommended” parameters are provided in this report specifically for the purpose of the review of the various structures. The parameters provided should not be used for design, as, in most cases, the data are inadequate for this purpose and no probabilistic analyses have been carried out.
1.2 Objective
The Request for Proposal put out by the National Research Council indicated that the Objectives of the project were to “….summarize the annual ice regime off the West Coast of Newfoundland, and to provide a preliminary assessment of the types of offshore structures that could be used for oil development in this region.”
The proposal submitted by Sandwell and CANATEC indicated that to assess structures it was necessary to also define all the environmental conditions, including the summer meteorological and oceanographic conditions, in particular the winds, waves and currents, to an adequate level to ensure that any structure considered will be able to survive and operate efficiently in the local conditions.
As indicated in the proposal, the “typical” operating conditions are required when reviewing operational aspects and the extreme conditions are required when reviewing the design of a structure. Both these conditions will be considered to allow a careful assessment of the optimum structures for producing oil in this offshore region.
1.3 Approach
The requirement of the project was to collect as much information, as possible, on the West Coast of Newfoundland, and to present it in a format which would allow an assessment of structures suitable for operation in the area.
Firstly a literature search was conducted through the Arctic Institute of North America in Calgary; this provided one (1) citation.
This was followed by the collection of information from the Canadian Ice Services of the Atmospheric Environment Services and various other government agencies, Canadian Coast Guards, and institutes. This provided a large quantity of information on the weather, ice, soils, etc. One of the team members visited the Canadian Ice Services in Ottawa and reviewed their ice data. This resulted in an order being placed for ice data and aircraft radar imagery. These data were analyzed and summarized for this report.
2. ICE
2.1 GeneralThe annual reports written by the Canadian Coast Guard (CCG) for the Gulf of St. Lawrence provide an excellent anecdotal description of the ice conditions in the area. The following treatment is based on the CCG accounts, supplemented by an examination of daily ice charts of the most recent ten year period (1987-1996).
Ice generally starts to form in the Gulf in early to mid-December, but often melts again due to mild temperatures later in the month. By year-end, any ice that has formed remains in the area for the winter. Along the West Coast of Newfoundland, ice begins to form in the north and develops toward the south by a combination of drift and new ice growth. Depending on the occurrence of offshore winds, the new ice may develop along the coast line or offshore.
Whatever the mode of development, however, the ice generally closes against the West Coast in the second and third weeks of January, when the ice is reported to reach the “young” ice stage (10 to 30 cm). The first year ice thickness continues to increase, reaching the “medium” (30 to 70 cm) to “thick” (0.7 to 1.2 m) stage by mid-March.
Through February, narrow shore leads may open in response to offshore winds. The area is particularly susceptible to opening and closing of shore leads in March and April, with frequency of lead occurrence and persistence varying with the season. In some years, easterly winds can drive the ice far out into the Gulf, leaving a major shore lead for much of the winter (e.g., 1994-95). In other years, northwesterly winds can create intense pressure along the Newfoundland coast for much of the winter (e.g., 1993-94).
Ice clearance proceeds from south to north along the coast. The offshore first-year ice mass generally disperses from the central coast area in the third and fourth weeks of April. In exceptional seasons, offshore and coastal ice have persisted along the central and southern regions of the coast to mid-May. Exceptionally early offshore ice dispersal can occur in the fourth week of March.
Ice disperses from the northern coastal area and Strait of Belle Isle in May and June. Icebergs and fragments of old ice enter the area from the Labrador Sea, but these are only evident in the late winter when the local ice starts to clear. In the seasons when such incursions have been observed, most of the icebergs and old ice have tended to drift to the Quebec shore of the
northeast Gulf of St. Lawrence. We have no data or observations of these features in the coastal waters along the West Coast of Newfoundland; the northward flowing current along the coast may keep away from this area. A maximum late season presence of 30% multi-year floes within thick first-year ice (greater than 1.2 m thickness) has been reported in the channel between the West Coast of Newfoundland and Quebec.
The following photographs of ice in the region of interest were kindly provided by Captain Alan Rowsell of the Canadian Coast Guard, Newfoundland Region.
Photo 1 and Photo 2 show general shots of the ice surface in March as the Abitibi Concord was being escorted into Corner Brook. The ice surface is broken up by the wind and wave action, with ice pieces of less than about 5 m across and small piles of ice in between the pieces. No large, well defined ridges can be seen. Photo 3 was taken off the stern of the MV Terry Fox as
she was towing a small vessel in close formation. The ice is very loose on this occasion, as is seen by the areas of open water between floes, and the open wake behind the tow vessel. Ice thickness is estimated to be 20 to 30 cm at the most.
Photo 4, taken on the 29 April, 1995, shows much heavier ice conditions than the other
photographs. The ice on this occasion was 10/10th concentration, heavily ridged, and probably under pressure. Ridges with sail heights estimated to be 1.5 to 2 m high are evident in front of the red hulled vessel on the left of the picture. Photo 5 shows one of the vessels moving by or ramming a large, probably grounded ridge sail. The vessel appears to have rammed into the ice, causing the flattened area on the ice pile being viewed by the seamen. This ridge sail height is estimated to be over 3 m.
The following two photographs are based on SAR data.
The Canadian Atmospheric Environment Services SAR (Synthetic Aperture Radar) aircraft, known as STAR 2 was used from 1990 to 1994 (from 1975 to 1990 a Side Looking Airborne Radar sensor was used). AES have a list of aircraft flight lines in their database and they have archived hard copy imagery obtained from the aircraft during the operation. Digital SAR data on exabyte tape can be purchased (for about $30 per tape) from AES and turned into hard copy by the user. The SAR aircraft was flown on a regular basis over the Gulf during the winter months. The image resolution used here is 25 m and the swath wide 100 km on both sides of the aircraft. These data provide information on the nature of the ice surface and the location of significant ridges and areas of ridging. Interpretation of the data is not trivial as it depends on the angle of incidence of the radar beam on the ice and the ice surface conditions (i.e., wet, dry, young, old, snow cover, etc).
Photo 6 shows the ice conditions on February 12th, 1994, from Port aux Basque to the Bay of Islands, Newfoundland, with a scale of approximately 1 mm equal to 0.4 km. The fine white lines are ice pressure ridges or ice rubble piles, dark gray areas are level ice (e.g., Port au Port Bay contains smooth, level, landfast ice), and black areas are generally water (e.g., the wedge along the coast south of Port aux Basque) but can be very smooth ice in sheltered water (e.g., Humber Arm). Note that radar shadows also show as black areas. The general ice conditions offshore are believed similar to those shown in Photo 1 and Photo 2 above, small ridges or upturned ice pieces between small pieces of level ice. Heavy ridging, evident by an area of light gray texture, is present along the south shore of St George’s Bay, the north shore of the Port au Port peninsula, and for about 3 to 5 km out along the coast north of Port au Port Bay. The area of rougher ice and a few distinct floes (about 1 by 4 km in size) about 65 km west of the Port au Port Peninsula, is believed to be ice which has drifted into the area from the north shore of the Gulf. Heavier ice is evident about 100 km west of Bay of Islands, near the north shore of the Gulf, and larger floes are seen in this area. There is a shear line extending north from Port aux Basque. Ice to the east of this line has moved enough to cause heavy ridging along the West Coast of Newfoundland, but is believed to be relatively stationary when this image was obtained. To the west of the shear line, the ice is moving to the south (note the area of heavier ice 65 km west of Port au Port is displaced to the south on the west side of this shear line) and exiting via the Cabot Strait. Considering that the ice cover is 10/10th in this image, heavily deformed along the coast, there is clear evidence of southward ice drift, it is evident that the ice along the West Coast of Newfoundland was under pressure on the 12th February, 1994. There are no well defined shear ridges in the area (i.e., straight ridges which shear through floes), although there are several short straight lines which may define small shear ridges in the ice north of Port au Port Bay. Note the looser ice in the Cabot Strait, where the pressure
Photo 1: Typical ice conditions on the West Coast of Newfoundland, March
Photo 3: Light ice conditions on West Coast of Newfoundland, March, with boat in tow
releases. Note also the icebreaker track going into the Bay of Islands and Corner
Brook. This track can be seen, as a very fine line, extending out into the pack ice 30 km west of Cape St. George, crossing the shear line, and turning sharply south towards the Cabot Strait. Photo 7 shows the SAR data for 12 March, 1994, again from Port aux Basque to Bay of Islands. The area to the north of Port au Port Bay is still closed in with heavy ridging along the coast; even heavier than shown in Photo 6. There is no evidence of open water or leads in this area and we believe that it is still under pressure from the effects of westerly winds or the tide. The ice in the Port au Port Bay appears much smoother, and the rubble has cleared from the northern entrance to the Bay and is pulling away from the north shore of the Peninsula. This black area in and around the Bay may be open water from ice clearing and melting in the shallow areas. The ice is seen to be moving out of St. George’s Bay and exiting the area via the Cabot Strait. Open water is noted in the east end of St. George’s Bay, along the south and north shores of the Bay, and in the Cabot Strait. The icebreaker track is again visible in the Humber Arm.
2.1.1 Daily Ice Conditions and Variations
Day-to-day variations in the ice conditions are presented for two years in Appendix A, based on the daily ice charts from AES. These descriptions indicate the extreme variability of the ice conditions also the West Coast of Newfoundland.
2.1.2 Ice Morphology
Variations of the average ice edge by month are shown in Figure 2-1 to Figure 2-10, reproduced from Cote (1989). This report supersedes the earlier work by Markham (1980). These figures indicate that ice forms in the northern regions of the Gulf in mid December, and slowly extends across the Gulf generally lying along the West Coast of Newfoundland by late January. Despite frequent day to day and year to year variations, the ice generally starts to recede from the
coastline in the later part of March. Based on the 26 years of data reviewed by Cote, the last remnants of ice generally clear the coastal region of interest by late May-early June, but ice may still exists along the north coast of the Gulf and in the Strait of Belle Isle.
2.2 Freeze-up and Break-up
The preceding figures indicate the development and decay of ice in the area of interest. Freeze-up and break-Freeze-up dates were interpreted from eight years of daily AES ice charts (1985 - 1994 period), and the resulting summaries are presented Figure 2-11, with Corner Brook data included for comparison. The offshore conditions were noted off three fixed coastal locations adjacent to Daniel’s Harbour (Northern coastal area), the Bay of Islands (Central coastal area), and St. George’s Bay (Southern coastal area). The “freeze-over” date was the first chart date recording in excess of 9-tenths ice concentration against the shoreline at the three observation points. The “ice clearance” date was the chart date at which local ice concentration reduced to open water and remained so for the remainder of the season.
Figure 2-11: Summary of freeze-up and break-up along the outer West Coast of Newfoundland and at Corner Brook.
These dates in Figure 2-11 indicate the trend of ice development from north to south and of ice clearance from south to north. Freeze-over of the Central coastal area, in the years studied, has
always completed within a three-week window between 22 January and 9 February. Clearance shows greater variability, from 18 March to 8 May. This is attributed to onshore and
southwesterly winds which, in some seasons, maintain residual concentrations of deteriorating ice floes in the area. The sheltered, brackish waters of the various inlets along the coast freeze up earlier but clear about the same time as the adjacent offshore waters. For example, in the Humber Arm, Corner Brook, freeze-up occurs between late November and early January, and break-up between mid February and mid April. Freeze-over at Corner Brook, on average, precedes freeze-over off the Bay of Islands by a month but this may approach three months in an extreme season when Humber Arm covers entirely by mid-November.
2.3 Ice Thickness
Ice thickness is extremely important in the calculation of loads on offshore structures. Of interest are both the level ice thickness and the thickest ice which may enter an area. No on-ice field program has been carried out in the area of interest as far as we are aware. Hence the different sources of information on level ice thickness will be reviewed here.
Regular Ice thickness measurements
Ice thickness for Corner Brook (1974 to 90) is indicated in Figure 2-12 from measurements taken in the Humber Arm. This station is closest to the area of interest, however, it is inshore and protected. In this area, ice starts to grow at the end of November and grows to a maximum thickness of about 40 cm at the end of March. Ice starts to melt in early April and is generally dispersed by mid-May. The Corner Brook data record of 17 years (1974 to 1990) indicates an extreme maximum ice thickness of 60 cm and an extreme minimum ice thickness of about 20 cm.
We know from section 4.2 that ice growth is quite different offshore compared to inshore, hence the ice growth data from Corner Brook can be considered only as an indication of the level ice thickness in the general area. Considering that ice starts to grow earlier inshore than offshore, the Corner Brook ice thicknesses are probably greater than those expected from ice which forms in the adjacent area offshore. However, ice moves into the area from the north shore of the Gulf, and this and the consolidation within ridge keels can be much thicker than the locally formed level ice.
AES (1991) provides the ice thickness for several stations in the Gulf of St. Lawrence and these are indicated in Table 1. Cartwright, located on the coast of Labrador, is provided as this is considered to be the maximum possible level ice thickness which would be expected in the Gulf of St. Lawrence.
Only freezing degree day values are available for several relevant stations in the Gulf of St. Lawrence (see AES 1992). The mean freezing degree day (fdd) values for Stephenville (just south of Corner Brook) of 634 suggest a mean ice thickness of 40 to 55 cm (using fdd to ice thickness conversions from Cammaert and Muggeridge, 1992). By comparison, Sept-Isle, in Quebec has a mean fdd of 1526 and a maximum of 2011. These correspond to an ice thickness of 0.8 to 1.0 m mean and 1.2 m maximum. It is doubtful that ice from Sept-Isle enters the area of interest here due to the river currents which flow to the south, however, it cannot be ruled out at present. Freezing degree day values for Harrington Harbour, Quebec, of 1269 mean and 1712 maximum correspond to ice thicknesses of 0.7 to 0.85 cm.
Location Fresh (F), Saline (S), Brackish (B) Mean Ice Thickness (cm) Max Ice Thickness (cm) Corner Brook (Nfld) B 43.7 62 Natashquan (PQ) F 76.2 112 Havre-Saint-Pierre (PQ) F 67.9 91 Blanc-Sablon (PQ) F 82.4 110 Caraquet (NB) S 69.0 92 Summerside (PEI) S 50.0 73 Botwood (Nfld) F 57.9 79 Cartwright (Lab) S 94.8 160
Table 1: Mean and maximum measured ice thicknesses in the general area of interest
Weekly Ice T hickness Development - Corner Brook
0 10 20 30 40 50 60 70 Week Min Mean Max
Figure 2-12: Ice Growth based on measurements made in the Humber Arm, Corner Brook.
AES Ice Charts
The AES ice charts for the Gulf of St. Lawrence indicate that the ice in the area of interest is generally in the thin first year ice class, i.e., 30 to 70 cm. However, 2 to 4/10th concentration of ice in the 70 to 120 cm ice class, in the form of small floes, is reported in most years.
Occasionally a trace (< 1/10th) to a few tenths of ice thicker than 120 cm is reported in late April in the northern regions of the area. In some years, e.g., 1991, old ice was reported in the
northern regions of the area along with icebergs. These had come from the Labrador Sea down the Strait of Belle Isle.
AES Ice Thickness Measurements
Ice thickness measurements made by ice observers on board the ice breakers which operate in the area are provided as supplements to the various AES ice maps. Table 2 summarizes some of these measurements for 1990 taken as the John A. MacDonald was progressing north from Port aux Basque enroute for Corner Brook. These measurements indicate level ice thicknesses in the 30 to 80 cm range with a few measurements of very thick rough ice on 10 April, 1990.
Date Latitude Longitude Ice thickness Comments
1 April, 90 48 00 to 48 30
59 31 to 59 56
31 to 65 cm Floes smooth. From small to vast. Trace of old rafts and/or ridges on vast floes. Wet snow. Signs of melting
2 April, 90 49 00 58 00 45 to 80 cm. Fast ice thin to medium thickness. Bare ice in places. Ridges to 0.3 m, some puddling, ice very wet, snow slushy.
3 April, 90 48 00 59 50 39 to 54 cm Ridges to 1.75 m. Ice very wet. All ice bare except for snow in ridge sails
10 April, 90
49 10 58 00 43 to 68 cm Smooth fast ice. Ice 147 and 195 cm thick in area of rough old weathered rafts.
14 April, 90
49 12 58 29 38 cm and 76
cm
Big floe. Ridging to 1.5 m
Based on the above, we recommend the following ice thicknesses for use in the review of structures suitable for the area of interest:
Situation Ice Thickness
Annual maximum level ice thickness 80 cm
Maximum first year level ice thickness as a result of a particularly cold year (worst year in the 17 years of available data)
100 cm
Extreme first year ice thickness 1.5 m
Table 3: Recommended ice thicknesses for area of interest 2.4 Landfast Ice
As the ice in the Gulf is very mobile during the winter, often forcing into shore with the
development of extensive ridging, one would expect landfast ice forming along the coastline to water depths of 5 to 10 m, about 1 to 1 ½ km from shore. AES Ice Charts indicate that landfast ice develops in some years for a few weeks in the shallow bays around Port au Port, the Bay of Islands, Daniels Harbour, the east end of St George’s Bay, St John’s Bay, and various other small bays. The AES SAR data indicate a narrow band of fast ice at various places along the coast between bays, to a distance of about 1 km offshore; the AES ice charts do not have adequate resolution to show this. Landfast ice is anchored by grounded ridges. The grounded ridges in this area would have to have adequate freeboard to remain grounded in the 2 m tides experienced in the area, or they would have to be formed high up the beach during a high tide. Due to the limited quantity of landfast ice, it is not considered to be the hazard that it is in other areas such as the Beaufort Sea.
2.5 Pressure Ridges
AES flew laser profilometer missions over the Gulf of St. Lawrence and Cabot Strait between 1974 to 1981. The data were provided by AES as the number of ridges in each 0.2 m sail height range per line km. For this project, we divided the data into 4 zones; a north nearshore zone from the southern end of the Strait of Belle Isle to latitude 50° 30’, a central nearshore zone between latitudes 49° 30’ and 50° 30’, a southern nearshore zone south of 49° 30’ latitude, and an offshore zone, beyond water depths of 100 m. In each zone, the number of ridges in each sail height interval were added together and the results are shown in Table 4. The Table indicates the number of km of flight line in the zones of interest, the number of ridges processed, and the average and maximum number of ridges per km. It is noted that there are 1200 km of data and 7439 ridges in the nearshore area of interest. Data were obtained in the months February to May, from 1974 to 1980, with the majority of flights being made in the months March and April.
Zone on Coast Number of km of data Number of Ridges Average number of ridges/km Maximum number ridges/km North Nearshore 70 1812 26.3 55 Centre Nearshore 80 467 5.8 28 South Nearshore 1047 5160 4.9 59 Offshore 354 2906 8.28 40
Table 4: Ridge statistics for laser profilometer data for West Coast of Newfoundland
These data indicate that the number of ridges/km decreases from the northern zone to the southern zone. The maximum number of ridges is highest in the northern and southern zones. Figure 2-13 shows the number of ridges with height exceeding a given sail height. The figure indicates a low percentage of ridges with sail heights exceeding 2 m and a maximum ridge sail height of 2.8 m measured. This ridge would have a total thickness of 12.3 m, based on a keel to sail ratio of 4.4 (Timco and Burden, 1996). Table 5 shows ridge sail height statistics for the AES laser profilometer data. The trend lines fit the graphs shown in Figure 2-13. The equations indicate the number of ridges with sail heights exceeding x m per km.
Zone on Coast Mean ridge sail height (m) Trend Equation
North Nearshore 0.81 142 e-x/0.31
Centre Nearshore 0.66 95 e-x/0.16
South Nearshore 0.73 45 e-x/0.23
Offshore 0.69 93 e-x/0.2
Table 5: Ridge height statistics for AES laser profilometer data for West Coast of Newfoundland
The e-folding scale of 0.31 m for the sail height distribution corresponds to a keel of 1.37 m and less which are appreciably lower than the values of 2.16 m reported by Melling and Reidel (1996) for the Beaufort Sea. This indicates that there are relatively fewer deep keel depths in the area of interest here than in the Beaufort Sea, as one would expect.
0.001 0.01 0.1 1 10 100 0 0.5 1 1.5 2 2.5 3 Ridge Height (m)
Ridges Exceeding Height Indicated per km
Nearshore South
Nearshore Centre
Nearshore North
Off Shore
Figure 2-13: Number of ridge sail per km off the West Coast of Newfoundland (based on AES laser profilometer data, 1974-1981).
2.5.1 Maximum Pressure Ridge Sail Heights
Maximum pressure ridge sail heights can be estimated from the parent ice thickness. Tucker and Govoni (1981) measured 30 ridges in the Beaufort Sea and compared their height to the
thickness of blocks in the ridge and found that the maximum sail height is proportional to the square root of the ice thickness within the ridge sail. Sayed and Frederking (1988) found similar results.
The mean ridge sail height is given by:
S = 3.71
√
t m and the maximum sail height is given by:S = 5.2
√
t m Where t is the block ice thickness within the sail (in m)Here we will assume that the maximum annual ridge sail height is produced by the maximum annual ice thickness of 0.8 m (see 4.3 above); this indicates the mean ridge sail height of 3.3 m and maximum of 4.65. (Note that Timco and Burden (1996) reported no correlation between level ice thickness, presumably alongside the ridge, and sail height. Melling and Riedel(1996) noted a relationship between ridge keel depth and thickness of ice to the side of the ridge. Their parameters differed from those given by Tucker et al, 1984). For the extreme ice thickness of 1 m (thickest level ice in 17 years), the average sail height is 3.7 m and maximum is 5.2 m for a floating ridge.
2.5.2 Ridge Keel Depth
The ridge keel depth can be obtained from the ridge sail height based on relationships derived for other ice-covered areas. Burden and Timco (1996) use the measurements of various authors and determined the ridge keel/sail ratio to be:
Keel/Sail = 4.4 ± 1.8 for first year ridges in temperate regions.
Ridges heights and sail depths for the area of interest are indicated below.
Note that these are the thickest ridges, and ridges from zero up to these thicknesses would be expected, depending on the environmental forces and extent of ice movement.
Ridge Parameters
Worst Annual Extreme (worst in 17 years)
Ice thickness 0.8 m 1.0 m
Largest ridge sail height 4.7 m 5.2 m
Ridge keel depth 21 m 23 m
Ridge keel depth plus 1 standard deviation
29 m 32 m
Porosity 0.1 to 0.3 0.1 to 0.3
Consolidated Layer thickness 1.6 m 2 m
Table 6: Ridge Parameters for the West Coast of Newfoundland
2.5.3 Ridge Porosity and Consolidation
There is no data on ridge porosity or consolidation for our area. The consolidation depends on the porosity of the ridge keel. Lepparanta and Hakala (1996) measured an average porosity of 29 %, with a lowest keel porosity of 23 % and lowest sail porosity of 9 %. Kovacs and Mellor (1974) indicate a range of porosities from 10 % to 40 % for compressive and shear ridges, with the lower porosities in shear ridges. Timco and O’Brien (1994) reviewed data on 112 first year ridges from 13 authors. Their data indicate a mean porosity of 19 % for sails and 30 % for keels. Minimum and maximum porosities of 5 % and 41 % were reported for sails, and 22 and 37 % for keels, respectively. Timco and O’Brien (1994) indicated a mean consolidation of 1.88 times level ice thickness, with a range from 0.5 to 4.
2.5.4 Ridge Keel Geometry
There is no data on ridge geometry for this area. Timco and Burden (1996) review the geometry of ridges in temperate (and Arctic) regions and found considerable variability. They develop a typical ridge geometry, as indicated in Figure 2-14.
Figure 2-14: Typical first year ridge geometry (from Timco and Burden, 1996)
2.5.5 Ridge Impact Rates
Considering that pressure ridges form along the coast every year, and the ice moves around almost daily, any structure placed in the coastal regions (except possibly for some of the shallow areas) will be impacted by pressure ridges. Table 5 presents data on ridge thicknesses, which indicate that keels to 21 m are an annual occurrence and impact of such ridges with a structure should be considered an annual occurrence. Extreme ridges have keels of up to 32 m thick. The extreme ice thickness which gave this ridge (using the Tucker and Govoni theory), was the thickest ice in 17 years of data, and hence one might consider this ridge to be the 1 in 17 year extreme thickness. One would expect a 100 year extreme ridge keel of about 32 m. As ridges tend to be quite long, and one would expect several such ridges in the 100th year, it is reasonable to assume any structure would be impacted by such a ridge in the 100th year, provided the structure were in water depths exceeding 32 m.
If the ridges were compression ridges, then the consolidation within the ridge would amount to about 96 cm in the annual ridge, and 1.2 m in the 1 ridge in 17 years. However, if the ridge is a shear ridge, then the porosity will be considerably lower and consolidation of up to 1.6 to 2 m would be expected.
2.6 Rubble Fields
There is no data on rubble or rubble fields in the area of interest. The laser profilometer data indicate up to 58 ridges per km, many of these may form rubble fields.
2.7 Multi-Year Ice
The CCGS anecdotal report and AES ice charts occasionally indicate the presence of small quantities of multi-year ice on the north shore of the Gulf. This ice drifts down the Strait of Belle Isle and melts in the Gulf during the summer. A review of two decades of AES ice charts indicates that the occurrence of multiyear ice in the Gulf of St. Lawrence is rare. No multiyear ice was reported in the area from 1969 to 1978, but there were 7 occasions from 1984 to 1996 when old ice was reported during the April to June period, around the southern end of the Strait of Belle Isle. Very likely the more frequent occurrence of old ice after 1984 is a result of improved detection methods (the introduction of aircraft with radar sensors). The concentration of the old ice is generally in the trace amounts. There was one report of 2/10 old ice in the winter of 1994/95, but floe sizes were reported as “small”, i.e., 20 to 100 m.
2.8 Ice Drift
The most consistent indicator of ice drift found was the forecast drift vector information noted on daily ice charts of the region. Based on area wind forecasts, presence of ice, and land
configuration, the AES interpreters display a 24-hour ice drift forecast at various points on a given day’s ice chart. The drift forecast indicator consists of an arrow pointing in the direction of forecast drift and a value indicating forecast nautical miles of drift over the following 24-hour period. Of 12 years of chart data examined, a total of 1361 records were extracted. Of these, 1031, or three-quarters, had associated drift vectors.
Figure 2-15 is a graphical summary of the percent frequency of drift directions at three areas along the West Coast of Newfoundland.
Although at least 50 percent of forecast ice drift is in an onshore direction (between east-northeast and southeast) not conducive to shore lead development, it should be noted that the cumulative period of regional shore lead conditions account for only three to five weeks (approximately one-fifth) of the ice season. Of note are the sub-peaks in the distribution at northeast, southeast, southwest, and north west directions. These are either parallel or
perpendicular to the general trend of the coastlines of the area, suggesting that there may be a significant sea current influence on drift.
0 5 10 15 20 25 Drifting toward South Centre North
Figure 2-15: Percent frequency of ice drift direction at three areas along the West Coast of Newfoundland
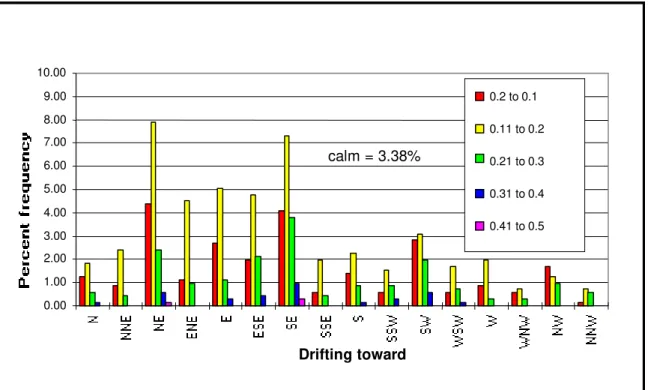
The drift direction by speed statistics show no evident directional preference for the ice displacement classes. Data were reviewed for all three geographical areas of study (North, Central, and South), and all three show a similar overall division of drift magnitudes as shown for the Central region, with roughly half the observations falling in the 0.13 to 0.02 m/s range, one-quarter falling in the 0.02 to 0.1 m/s range, and one-fifth falling in the 0.23 to 0.32 m/s range. Less than five percent of drift forecasts, in any area, exceeded 0.32 m/s. The average residual drift rate was 0.14 m/s over 24 hours. No information is available on the instantaneous drift rate.
Table 8 presents a summary of offshore and onshore drift, based on the drift forecast vectors extracted from 12 years of daily ice charts. In constructing Table 8, onshore directions were assumed to be those clockwise from east-northeast (ENE) to south (S) inclusive. The offshore drift sector was taken to be directions running clockwise from west-southwest (WSW) to north (N) inclusive. The remaining directions are considered to be neither onshore nor offshore drift sectors. The recorded drift vectors for the three coastal areas repeat the pattern shown in Figure 2-15 for the region as a whole, i.e. onshore drift approximately half the time and offshore drift less than one-fifth of the time. There is a slight increase in frequency of offshore drift as one proceeds north along the coast. This is in agreement with the trend of increasing incidence of shore lead episodes to the northern end of the coast (see section 3.8, below).
0.00 1.00 2.00 3.00 4.00 5.00 6.00 7.00 8.00 9.00 10.00 Drifting toward 0.2 to 0.1 0.11 to 0.2 0.21 to 0.3 0.31 to 0.4 0.41 to 0.5 calm = 3.38%
Figure 2-16: Percentage directional frequency of ice drift by displacement, in m/s, Central coastal area.
Naut mi/day: calm 1 to 5 6 to 10 11 to 15 16 to 20 21 to 25 Totals
N 1.27 1.83 0.56 0.14 0.00 3.80 NNE 0.84 2.39 0.42 0.00 0.00 3.66 NE 4.36 7.88 2.39 0.56 0.14 15.33 ENE 1.13 4.50 0.98 0.00 0.00 6.61 E 2.67 5.06 1.13 0.28 0.00 9.14 ESE 1.97 4.78 2.11 0.42 0.00 9.28 SE 4.08 7.31 3.80 0.98 0.28 16.46 SSE 0.56 1.97 0.42 0.00 0.00 2.95 S 1.41 2.25 0.84 0.14 0.00 4.64 SSW 0.56 1.55 0.84 0.28 0.00 3.23 SW 2.81 3.09 1.97 0.56 0.00 8.44 WSW 0.56 1.69 0.70 0.14 0.00 3.09 W 0.84 1.97 0.28 0.00 0.00 3.09 WNW 0.56 0.70 0.28 0.00 0.00 1.55 NW 1.69 1.27 0.98 0.00 0.00 3.94 NNW 0.14 0.70 0.56 0.00 0.00 1.41 calm 3.38 0.00 0.00 0.00 0.00 0.00 3.38 Totals: 3.38 25.46 48.95 18.28 3.52 0.42 100.00
Table 7: Percentage directional frequency of ice drift by displacement in nautical miles/day, Central coastal area.
Coastal area Offshore Onshore Parallel No drift South 16 % 53 % 29 % 2.5 % Central 17 % 49 % 31 % 3.4 % North 18 % 47 % 31 % 3.8 %
Table 8: Proportion of offshore and onshore ice drift along the West Coast of Newfoundland.
Figure 2-17 shows the percentage exceedence frequencies of the forecast ice drift rates taken from 12 years of daily ice charts. The exceedence frequency distribution is very similar for the three coastal areas, reflecting the regional nature of ice drift.
0 10 20 30 40 50 60 70 80 90 100
Nautical miles per day drift
South Central North
Figure 2-17: Exceedence frequency of ice drift rates at three coastal areas along the West Coast of Newfoundland.
2.9 Icebergs 2.9.1 General
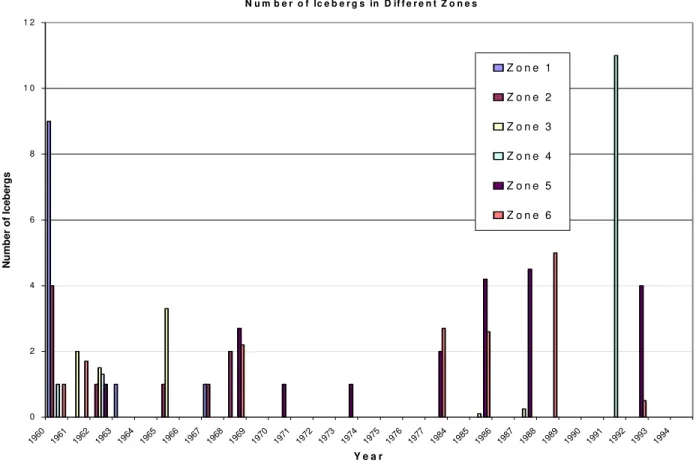
Iceberg information was obtained from two sources; Coretech Inc. and AES. Table 9 lists the number of icebergs from 1960 to 1977 (from Coretech Inc.) and 1985 to 1994 (from AES) for six zones along the coast (see Figure 2-18). Coretech data came from the International Ice Patrol, who flew over the northern part of the area prior to 1977. The AES data came from the micro-film of daily ice charts. AES also have daily iceberg charts; these were not reviewed.
We assume that the mean number of icebergs in a given area is the mean of the mean number of icebergs observed per flight in that area. We assume that this is the mean number of icebergs in the area every day during the “iceberg period”, typically April to June, inclusive. As noted in the Table, the majority of icebergs in the area are generally growlers. Impact probability calculations have been carried out including and excluding growlers. These calculations are probably conservative, as each flight indicates the number of icebergs seen on the particular day, and when no icebergs are reported, there were presumably no icebergs on that day or days.
Year Zone 1 Zone 2 Zone 3 Zone 4 Zone 5 Zone 6 Bergs(flights)
1960 13g32s0m1l(5) 2g6s(2) 1g(1) 46 1961 2m(1) 1m(1) 3 1962 1s(1) 3g(2) 1g2s1m(3) 2g (2) 1g2s1l(3) 13 1963 1g(1) 1 1965 2l(2) 10l(3) 12 1967 1g(1) 1s(1) 2 1968 2m(1) 3g1s3m1l(3) 2s8m(3) 20 1970 1g (1) 1 1972 1g(1) 1 1973 1s/1 1 1977 1g2s2m1l(3) 2g4s1m2l(4) 14 1985 1u(8) 0(8) 1s1m32u(8) 20s1m(8) 56(8) 1986 0 0 1987 1u(4) 0(4) 18u(4) 0(4) 19(4) 1988 0(1) 5u(1) 5(1) 1989 0 0 1990 0 0 1991 22u(2) 0(2) 0(4) 22(4) 1992 16u(4) 2u(4) 18(4) 1993 0(3) 0(3) 0(3) 1994 0 0 Average number of bergs in zone 0.44 0.32 0.26 0.56 0.74 0.57 Including growlers Average number of bergs in zone 0.23 0.29 0.20 0.43 0.62 0.54 Excluding growlers Average number of large bergs in zone 0.001 0.05 0.14 0.016 0.03 0.04 Large icebergs only Area of Zone 3930 1960 5880 7830 4700 7830 km2 Table 9: Listing of Iceberg sightings in the zones indicated in Figure 2-18. The symbols
are explained in the text.
In above table, g = growler (< 15 m in length), s = small iceberg (15 to 60 m), m = medium iceberg (61 to 122 m), an l = large iceberg (123 to 213m), u = unknown. Number indicates the numbers in each category. Number in brackets is the number of flights. Above iceberg sizes are according to International Iceberg Patrol Classification.
We are concerned about the high numbers of icebergs in Zone 1 and 2 in the Coretech Inc. data. The daily ice charts and other information (C. Langford, private communication) indicate that the icebergs enter the area via the Strait of Belle Isle, and generally stay to the north along the coast of Quebec. The AES daily ice charts indicate decreasing numbers of icebergs as one progresses south, and none south of Bay of Islands. It is unlikely that icebergs would enter the area via the Cabot Strait, as the major current is to the south. Calculations are provided for zone 1, but the results are questionable, and more work should be done in this area, if this is
considered to be a problem.
N u m b e r o f Ic e b e r g s in D if f e r e n t Z o n e s 0 2 4 6 8 1 0 1 2 1960 1961 1962 196 3 196 4 1965 1966 1967 1968 1969 1970 1971 1972 1973 1974 1975 1976 1977 1984 198 5 198 6 1987 1988 1989 1990 1991 1992 1993 1994 Y e a r Nu mb er o f I ceb erg s Z o n e 1 Z o n e 2 Z o n e 3 Z o n e 4 Z o n e 5 Z o n e 6
Figure 2-19: Iceberg observations off the West Coast of Newfoundland, 1960 to 1977 and 1984 to 1994, by year
2.9.2 Iceberg Impact Rate
We can use the iceberg data given in Table 9 to calculate the impact probability of icebergs with an offshore structure.
Based on Sanderson (1988, page 220) the probability of iceberg impact with a fixed structure is:
P = n v (d + D) T A
where n is the number of icebergs in the area A A is the area of the zone (km2)
T is the time during which icebergs are in the area
d is the iceberg diameter (as most bergs are small, assume d = 60 m)
D is the diameter of the drilling or production structure (assume D = 100 m) v is the average drift speed (assume v = 0.14 m/s, see section 2.5)
A review of the AES ice charts indicated icebergs reside in the north east Gulf of St. Lawrence from about ½ month (May - early June) to 5 months (May to October) with an average of 2 ½ months; hence T = 2 ½ months.
For example, for Zone 5, the number of icebergs, including growlers, is 0.74, and therefore the impact probability is:
P = 0.74 x 0.14 (100 + 60) x (3600 x 24 x 30 x 2.5) 4700 * 106
P = 0.023 per year
For the four zones along the coast, the iceberg impact probabilities are:
Zone 5 Situation Iceberg Density in
zone Annual Impact Probability Impact Probability in 25 years With growlers 0.74 0.023 44 % Without growlers 0.62 0.02 38 % Large icebergs 0.03 0.002 4 % Zone 3 With growlers 0.26 0.006 15 % Without growlers 0.2 0.005 11 % Large icebergs 0.14 0.006 15 % Zone 2 With growlers 0.32 0.024 45 % Without growlers 0.29 0.021 42 % Large icebergs 0.05 0.007 16 % Zone 1 With growlers 0.44 0.016 34 % Without growlers 0.23 0.008 19 % Large icebergs 0.001 0.00007 0.2 %
Table 10: Iceberg impact Probabilities for 4 zones along the West Coast of Newfoundland over the 25 year life of a structure.
2.10 Leads and Polynya
An annual recurring feature in the ice cover off the West Coast of Newfoundland is a shore lead, which may appear at any time throughout the winter. Eight complete years of daily ice charts were examined in compiling the summary data in Table 11. In analyzing the ice charts, a lead was defined as a reduction of local ice concentration to 3-tenths or less following the date of local freeze-over (see 4.2, above). The early season pattern of ice formation seaward from the Quebec shore results in an open water condition along the Newfoundland coast prior to freeze-over of that region. These early season lead-like conditions were not counted in compiling shore lead statistics. When leads were present, widths were measured along three fixed lines extending west-northwesterly from three point along the Newfoundland coast. These three points were Daniel’s Harbour (representing the northern coastal area), Guernsey Island at the mouth of the Bay of Islands (representing the central coastal area), and the intersection of west longitude 59° with the shore of St. George’s Bay (representing the southern coastal area) - see map in back pocket of report. Southern section Central section Northern section
Days of lead, total 175 218 269
Mean days of lead per season 22 27 34
Maximum duration of lead 13 days 56 days* 36 days*
Minimum duration of lead 1 day 1 day 1 day
Mean lead episodes per season 7 6 7.5
* Occurred in final lead episode of season.
Table 11: General statistics on shore lead occurrence and duration at three locations along the West Coast of Newfoundland.
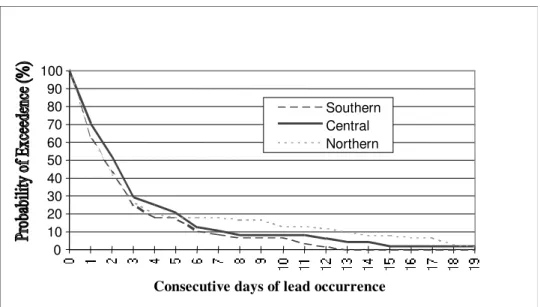
The number of days in a season in which a lead occurs increases from south to north along the coast. This is consistent with the overall ice regime (see 4.1), and is a result of the more northerly regions experiencing ice cover for a longer period, and hence there is a longer period during which a lead can form. Extremely long periods of uninterrupted shore lead conditions are noted in the maximum duration values for the central and northern coast areas. In both cases, a lead formed in higher concentration ice and ultimately closed back in on the coast again or otherwise experienced compression sufficient to increase ice concentration beyond 3-tenths. In both cases, this period of lead closing was of brief duration just prior to final ice clearance at the end of the season.
Figure 2-20 shows the percentage exceedence of duration of lead occurrence at three areas along the coast. This shows the number of consecutive days during which lead conditions (3-tenths of ice concentration or less) prevail.
0 10 20 30 40 50 60 70 80 90 100
Consecutive days of lead occurrence Southern Central Northern
Figure 2-20: Percentage exceedence frequency of duration of shore lead conditions, for ice on West Coast of Newfoundland.
2.11 Ice Properties
The physical and mechanical properties of the ice cover are important, since they influence the ice forces that are experienced by fixed offshore structures and vessels. Design ice loads for terminal structures depend on the thickness and geometry of the ice features that may be encountered, and also on the mechanical and physical properties of the ice. Similarly, the
performance of tankers and ice management vessels that operate at each terminal location will be affected by the range of ice conditions encountered, including ice properties such as flexural strengths, ice densities, and ice/hull friction coefficients. The normal and extreme loads that tanker mooring systems experience during oil loading operations will also depend on some of these ice properties.
2.11.1 Ice Temperature
No actual ice temperature measurements are available for the area of interest, as far as we know. Ice temperatures can be calculated from the ambient air temperature for different ice and snow thicknesses, assuming thermal equilibrium though the ice, which is a reasonable assumption (Cammaert and Muggeridge, 1988). If we take the Corner Brook air temperatures and snow and ice thicknesses, we get the following:
Month Ice thick-ness (cm) Snow thickness (cm) Mean Air Temp (°C) Mean Ice Core Temp (°C) Minimum Air temp (°C) Minimum Ice Surface Temp (no snow) (°C) Minimum Ice Core Temp (°C) Feb 22.3 13.4 -8 -2.2 -35 -25 -13.5 March 35.6 13.5 -5 -2.0 -30 -22 -12 April 39.3 13.5 0 -1.5 -18 -15 -8.5
Table 12: Sea ice temperatures for ice at about 48° north latitude, on the West Coast of Newfoundland.
The Mean Core Ice Temperatures given above indicate the temperatures in the centre of the ice for the Mean Air Temperatures corresponding to offshore locations in the vicinity of Corner Brook, with a snow cover similar to that at Corner Brook. The Minimum Core Ice Temperatures are the temperatures in the centre of the ice for the minimum air temperatures, without snow. The temperature profile through the ice is assumed to be linear, varying from a minimum temperature at the snow surface similar to the persistent air temperatures (using relationship given in Timco and Frederking, 1989) to a maximum temperature of -1.8°C at the bottom of the solid ice (i.e. the freezing point of sea water).
It is recommended that the minimum core ice temperature values given in Table 12 should be used for any analyses.
The above Table provides best estimates of level ice temperatures based on available inshore data. If more accurate offshore ice temperatures are required and temperatures within ridge consolidation layers, then direct on-ice measurements should be carried out.
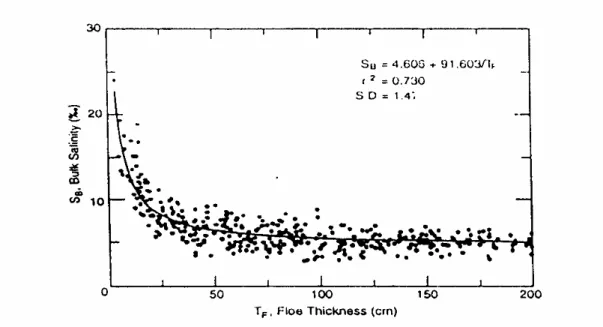
2.11.2 Salinity
Again, no actual measurements are available on the ice salinity. Cammaert and Muggeridge (1988) indicate that the ice salinity is proportional to the parent water salinity and to the rate of ice formation. As the water salinity in the area is 30 to 33 ppt, about 10 % less than the typical value of 34.5 ppt in other areas, and the rate of freezing is lower than in the Arctic, then the resulting ice salinity is expected to be lower than the Arctic by about 10%. The ice salinity varies with depth, being higher at the surface where the freezing rate is highest. Figure 2-21 shows the bulk salinity of first year sea ice from Kovacs, (1996).